
Stocks & Equities
Most people are risk averse because it’s been bred in them from early childhood. Protective parents caution their children “Don’t climb that tree, you might fall.” “Be careful of that dog, it might bite you.” That caution carries over into early adulthood and then into the workplace, where “don’t rock the boat” makes the most sense. Is it any wonder that when it comes to investing people are subjected to two conflicting ideals? One is to make as much money as possible, and the other is to take as little risk as possible to achieve this. How can this be done? Well, it can’t. Many people resort to professional money management in their desire to achieve these diverse aims.
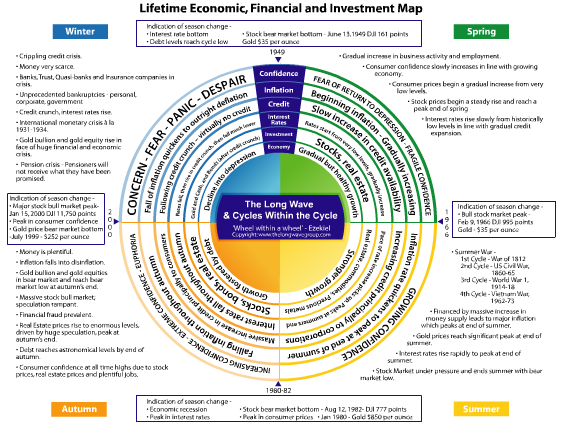
Even the best money manager will fail if the investment cycle is not with him or her. A major benefit of understanding the Kondratieff cycle is that it allows us to make lower risk investments in each of the four Kondratieff seasons. In each of the seasons there are appropriate and inappropriate investment mediums. For example, in the Kondratieff autumn, stocks, bonds and real estate make the best investments, whereas investing in gold and gold stocks are high risk. The opposite is true for the Kondratieff winter. The trick is recognizing where we are in the cycle. Fortunately there are events that provide us with that information. For example, we know when the great bull markets in stocks, bonds and real estate are about to commence in sync with the onset of the Kondratieff autumn. Four events precede this: the peak in interest rates, the peak in prices, a bear market in stocks, and a recession. These events occurred between 1980 and 1982 and similarly between 1920 and 1921. Following those events one could have invested in real estate, bonds and, in particular, stocks, with the confidence that these three investments were about to begin the biggest bull market of a lifetime.
Important: Click HERE or on image for functioning Chart below
……read more HERE

Markets that see volume of transactions evaporate on up days and surge on down days have traditionally offered a warning sign to invested capital. The price action on Friday for the Canadian TSX 60 (here captured in the XIU) is just one of several red flags to anyone who is paying attention to downside risk. Red bars at bottom of this chart (in red oval) denote selling pressure and should be compared with the grey bars of buying pressure shown here on the other trading days year to date.
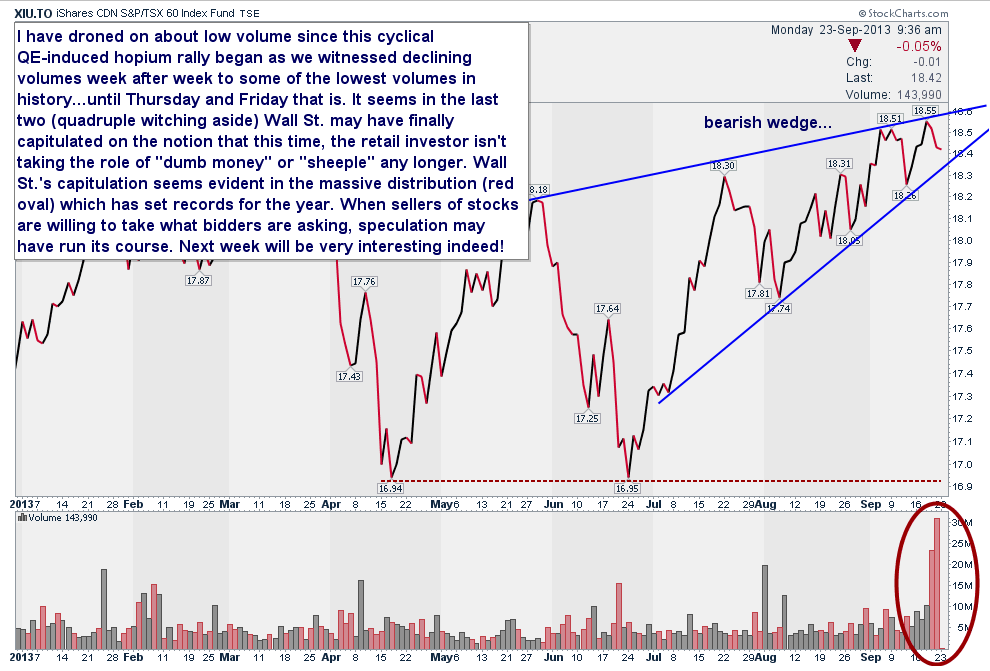
Source: Cory Venable, CMT, Venable Park Investment Counsel Inc.
Ed Note: More from Danielle Park
How the economic machine works
 [Buffett] noted that the equity market was fairly valued and stocks were not overvalued. Specifically, Buffett said “They were very cheap five years ago, ridiculously cheap,” and “That’s been corrected.” He also noted, “We’re having a hard time finding things to buy.” One has to take note when the world’s most high profile investor (a long investor), cannot find stocks to buy although he reports his business is improving. Buffett was not the only Billionaire to weigh in last week. Carl Icahn responded candidly when asked his view on the market. “Right now, the market is giving you a false picture.
…..read it all HERE
The S&P futures have lost over 10 pts on the day reaching a low of 1690. This represents a drop of over 36 pts from the new all time highs and a return of all the “no taper” gains.
Drew Zimmerman
Investment & Commodities/Futures Advisor
604-664-2842 – Direct
604 664 2900 – Main
604 664 2666 – Fax
800 810 7022 – Toll Free

The Bottom Line
The correction in North American equity markets that started on August 2nd is proving to be a flat trend rather than a downtrend. Look for more of the same until well into October. Preferred strategy is to maintain a healthy cash position for possible entry into the favourable seasonal trade in October.
Economic News This Week
Canadian July Retail Sales to be released at 8:30 AM EDT on Tuesday are expected to increase 0.6% versus a decline of 0.6% in June.
July Case-Shiller 20 City Home Price Index to be released at 9:00 AM EDT on Tuesday is expected to increase to 12.5% from 12.1% on a year-over-year basis.
September Consumer Confidence to be released at 10:00 AM EDT on Tuesday is expected to slip to 80.3 from 81.5 in August
August Durable Goods Orders to be released at 8:30 AM EDT on Wednesday are expected to ease 0.1% versus a decline of 7.4% in July. Excluding Transportation, August Orders are expected to improve 1.1% versus a decline of 0.8% in July
August New Home Sales to be released at 10:00 AM EDT on Wednesday are expected to increase to 425,000 from 394,000 in July.
Weekly Jobless Claims to be released at 8:30 AM EDT on Thursday are expected to increase to 330,000 from 309,000 last week.
Third estimate of second quarter GDP to be released at 8:30 AM EDT on Thursday is expected to increase to 2.7% from the second estimate of 2.5%
August Personal Income to be released at 8:30 AM EDT on Friday is expected to increase 0.4% versus a gain of 0.1% in July.August Personal Spending is expected to increase 0.3% versus a 0.1% gain in July.
September Michigan Sentiment Index to be released at 9:55 AM EDT on Friday is expected to improve to 78.0 from 76.8 in August.
Equity Trends
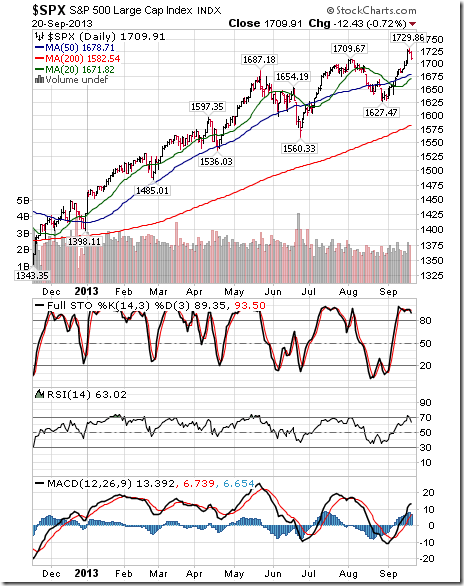
The S&P 500 Index added 21.92 points (1.30%) last week. Uptrend was confirmed when the Index moved above 1,709.91 to an all-time high. The Index remains above its 20 and 50 day moving averages. Short term momentum indicators are overbought and showing early signs of rolling over.
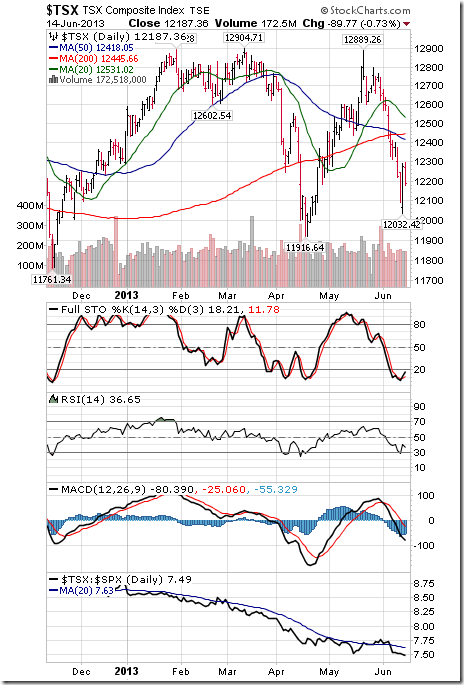
The TSX Composite Index added 83.07 points (0.65%) last week. Uptrend was confirmed on a move above 12,904.71 to reach a two year high. The Index remains above its 20 day moving average. Strength relative to the S&P 500 Index remained negative. Technical score remained at 2.0 out of 3.0. Short term momentum indicators are overbought and showing early signs of peaking.
The TSX Metals and Mining Index added 10.27 points (1.28%) last week. Trend remains up. The Index remains above its 20 day moving average. Strength relative to the S&P 500 Index remains neutral. Technical score remains at 2.5 out of 3.0. Short term momentum indicators are overbought.

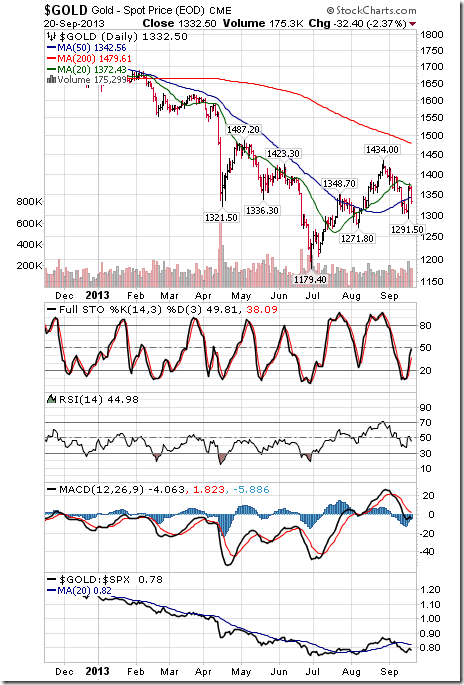
Gold added $23.90 per ounce (1.83%) last week. Trend remains up. Gold remains below its 20 and 50 day moving averages. Strength relative to the S&P 500 Index remains negative. Technical score remained at 1.0 out of 3.0. Short term momentum indicators are recovering from oversold levels.
….go HERE for 45 more charts on Interest Rates, Commodities, Stocks & Currencies
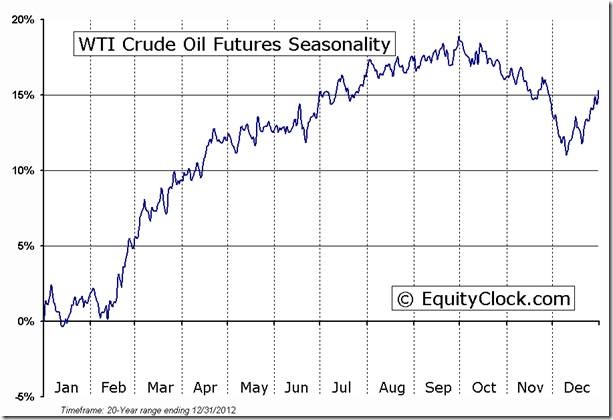
Special Free Services available through www.equityclock.com
Equityclock.com is offering free access to a data base showing seasonal studies on individual stocks and sectors. The data base holds seasonality studies on over 1000 big and moderate cap securities and indices. Notice that most of the seasonality charts have been updated recently.
To login, simply go to http://www.equityclock.com/charts/
Following is an example:

-
I know Mike is a very solid investor and respect his opinions very much. So if he says pay attention to this or that - I will.
~ Dale G.
-
I've started managing my own investments so view Michael's site as a one-stop shop from which to get information and perspectives.
~ Dave E.
-
Michael offers easy reading, honest, common sense information that anyone can use in a practical manner.
~ der_al.
-
A sane voice in a scrambled investment world.
~ Ed R.
Inside Edge Pro Contributors

Greg Weldon

Josef Schachter

Tyler Bollhorn

Ryan Irvine

Paul Beattie

Martin Straith

Patrick Ceresna

Mark Leibovit

James Thorne

Victor Adair