
Stocks & Equities

Penny stocks are well known to traders for lightning fast percentage gains, but is there any evidence for a penny stock to potentially become a high dollar stock? There have been quite a few penny stocks to become big company stocks over the past 10-20 years, but considering the amount of penny stocks trading on the market; it is uncommon. Penny stocks are high risk and high reward so prudent investors do not usually allocate a large portfolio percentage to penny stocks, if any at all. There are questions that investors should ask when deciding to invest in penny stocks with potential: is the company poised for a reverse merger with a larger company, does the company offer a valuable product, is the company actually legitimate, and can this company actually make a profit?
….read Beacon Equities 7 Top Penny Stocks HERE

It seems like everyone loves the stock market these days. The S&P 500 is off to the races this year. Only a handful of years throughout history compare to the index’s 7.1% surge to kick off 2012.
BlackRock chieftan Larry Fink says asset allocation should be steered toward 100% equities. No questions asked. Even Dr. Doom is less gloomy than he’s been in the past.
Has everyone gone mad?
Cyclicals have led this year’s rally, with financials jumping 13%, materials surging 12% and tech stocks advancing 11%.
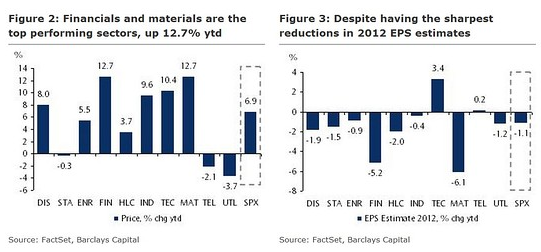
While the rally doesn’t look like its petering out anytime soon, Barry Knapp at Barclays Capital offers some reasons for caution.
….read it all HERE
Energy is of huge importance for the growth of the economy. The demand is steadily growing and the political change away from nuclear power to renewable energy slows the supply growth of energy. I screened stocks from the investment theme by the best growth over the past 10 years. I decided to select only stocks with a double-digit sales growth and a dividend yield of more than three percent. Fourteen stocks fulfilled my criteria. The highest growth was realized by Penn Virginia Resource Partners (PVR) who had a yearly growth of 40.3 percent. One company has a yield of more than 50 percent.
Here are my favorite stocks:
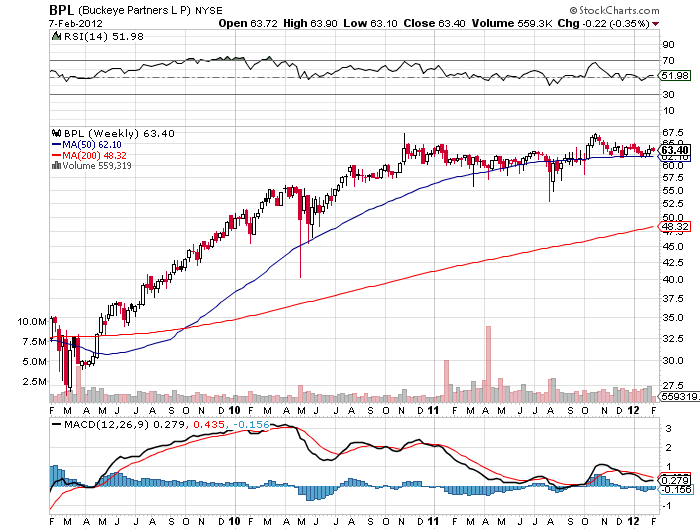
1. Buckeye Partners (BPL) has a market capitalization of $5.89 billion. The company employs 859 people, generates revenues of $3,151.27 million and has a net income of $43.08 million. The firm’s earnings before interest, taxes, depreciation and amortization (EBITDA) amounts to $338.70 million. Because of these figures, the EBITDA margin is 10.75 percent (operating margin 8.87 percent and the net profit margin finally 1.37 percent).
The total debt representing 50.51 percent of the company’s assets and the total debt in relation to the equity amounts to 129.65 percent. Due to the financial situation, a return on equity of 5.27 percent was realized. Twelve trailing months earnings per share reached a value of $0.80. Last fiscal year, the company paid $3.82 in form of dividends to shareholders.
Here are the price ratios of the company: The P/E ratio is 79.04, Price/Sales 1.88 and Price/Book ratio 3.26. Dividend Yield: 6.44 percent. The beta ratio is 0.26.
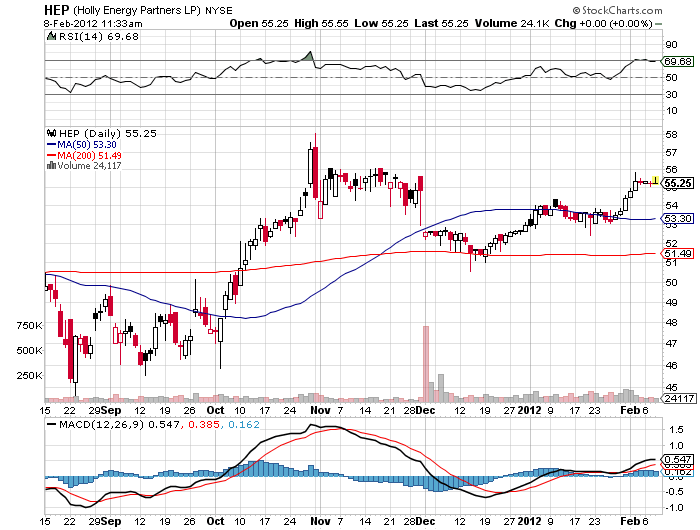
2. Holly Energy Partners (HEP) has a market capitalization of $1.22 billion. The company employs 148 people, generates revenues of $182.10 million and has a net income of $58.87 million. The firm’s earnings before interest, taxes, depreciation and amortization (EBITDA) amounts to $121.35 million. Because of these figures, the EBITDA margin is 66.64 percent (operating margin 49.84 percent and the net profit margin finally 32.33 percent).
The total debt representing 76.43 percent of the company’s assets and the total debt in relation to the equity amounts to 449.52 percent. Due to the financial situation, a return on equity of 17.33 percent was realized. Twelve trailing months earnings per share reached a value of $2.47. Last fiscal year, the company paid $3.32 in form of dividends to shareholders.
Here are the price ratios of the company: The P/E ratio is 22.39, Price/Sales 8.30 and Price/Book ratio 4.86. Dividend Yield: 6.41 percent. The beta ratio is 0.65.
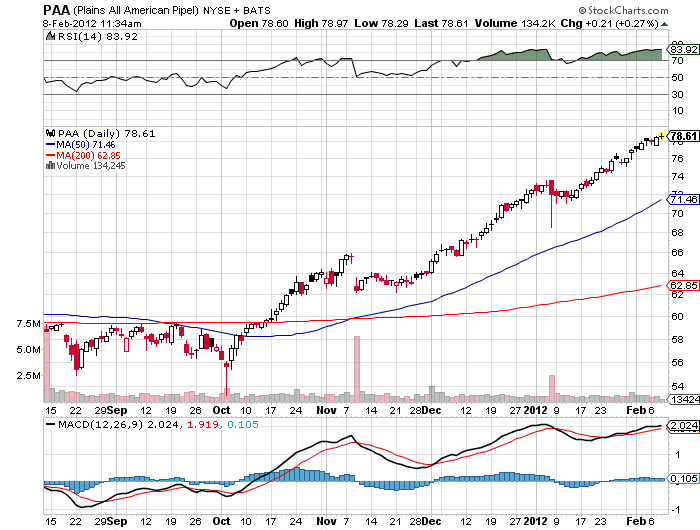
3. Plains All American Pipelines (PAA) has a market capitalization of $11.65 billion. The company employs 3,500 people, generates revenues of $25,893.00 million and has a net income of $514.00 million. The firm’s earnings before interest, taxes, depreciation and amortization (EBITDA) amounts to $1,016.00 million. Because of these figures, the EBITDA margin is 3.92 percent (operating margin 2.96 percent and the net profit margin finally 1.99 percent).
The total debt representing 43.47 percent of the company’s assets and the total debt in relation to the equity amounts to 137.19 percent. Due to the financial situation, a return on equity of 8.01 percent was realized. Twelve trailing months earnings per share reached a value of $4.18. Last fiscal year, the company paid $3.76 in form of dividends to shareholders.
Here are the price ratios of the company: The P/E ratio is 18.64, Price/Sales 0.47 and Price/Book ratio 2.60. Dividend Yield: 5.25 percent. The beta ratio is 0.50.
Take a closer look at the full table of energy stocks with fastest growth and big dividends. The average price to earnings ratio (P/E ratio) amounts to 20.95. The dividend yield has a value of 9.02 percent. Price to book ratio is 2.70 and price to sales ratio 2.88. The operating margin amounts to 26.35 percent.
Related stock ticker symbols:
ARLP, BPT, BPL, HEP, MMP, MMLP, PGH, PVR, PTR, PBR, PAA, RES, TGS, YZC
Famed investor Jim Rogers has already said he wouldn’t buy Facebook when the social networking giant has its IPO later this week. “No, that kind of stock I don’t buy. They are usually very, very expensive. A lot of people like to buy expensive stocks like that, but I do not,” said Rogers to CNBC yesterday.
However, that Rogers seems bearish on the internet company shouldn’t necessarily drive one away from Facebook. Rogers is bearish on…well, just about everything in America these days.
“It has been demonstrated many, many times before that sellers are usually smarter than the buyers, and they usually know when the best time to sell is, and Facebook is doing it,” he said. Rogers also stated his general opposition to the high prices in the Tech sector, saying ”I am interested in technology in some shape or form, but I can’t imagine buying any of them. They are a bit hot these days and they have been for two or three months, so that is why I am short. I don’t buy high-priced stocks.”
….read more HERE
Downside short term risk in equity markets currently exceeds short term upside potential. More sectors are starting to roll over from overbought levels. Fourth quarter earnings reports, economic news and possible macro events point to the high probability of at least a shallow, short term correction. Short term weakness will provide an opportunity to enter into seasonal plays that traditionally outperform during the spring season (e.g. Energy).
Equity Trends
Editor’s Comment: No question! Response to the U.S. employment report released on Friday was a surprise. Validity of the report is questionable, but the response was real. However, strength on Friday only pushed technical indicators to a greater short term overbought level. Regrettably, Tech Talk missed most of that gain, but the gain does not change the strategy on North America equity markets.
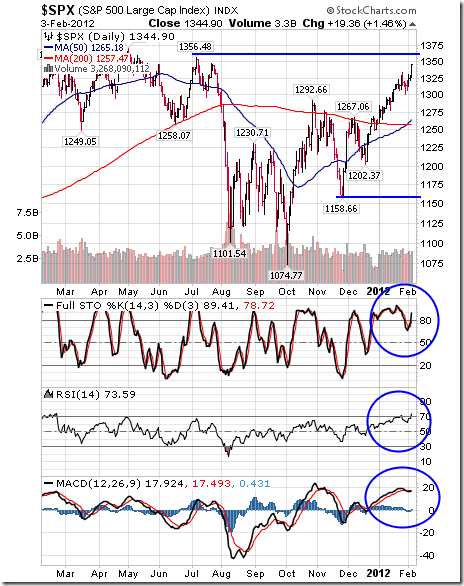
The S&P 500 Index gained 28.58 points (2.17%) last week. Intermediate trend is up. Support is at 1,158.66. Next resistance is at 1,356.48. The Index remains above its 50 and 200 day moving averages. It completed a “Golden Cross” last week. Short term momentum indicators are overbought and showing early signs of rolling over. Strength on Friday on news of the employment report was a surprise, but only caused the chart to become more overbought.
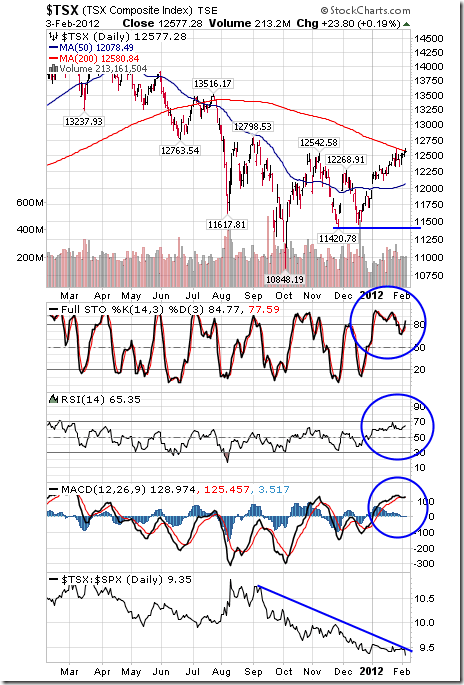
The TSX Composite Index gained110.78 points (0.89%) last week. Intermediate trend is up. Support is at 11,420.78 and next resistance is at 12,789.53. The Index trades above its 50 day moving average and trades at its 200 day moving average. Short term momentum indicators are overbought and showing early signs of peaking. Strength relative to the S&P 500 Index remains negative.
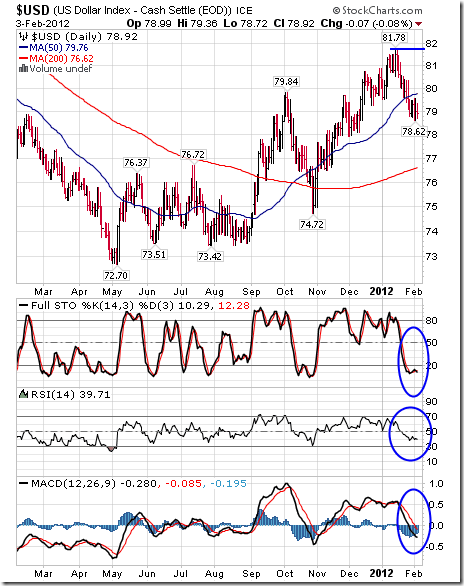
The U.S.Dollar Index was virtually unchanged last week (up 0.02). Intermediate trend is up. Support is at 74.72 and resistance is at 81.78. The Index remains below its 50 day moving average. Short term momentum indicators are oversold, but have yet to show signs of bottoming.
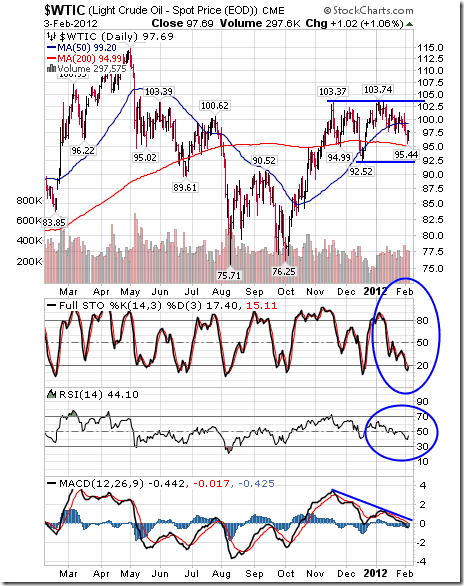
Crude Oil fell $2.07 per barrel (2.07%) last week. Intermediate trend is up. Support is at $92.52 and resistance is at $103.74. Crude fell below its 50 day moving average, but remains above its 200 day moving average. Short term momentum indicators are oversold, but have yet to show signs of bottoming. Seasonal influences turn positive in mid-February.
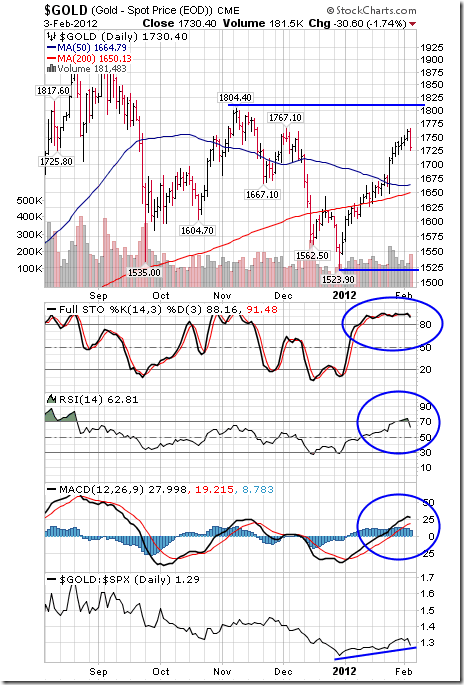
Gold slipped $3.10 (0.18%) last week. Notice the Leibovit volume reversal on Friday. Short term momentum indicators are overbought. Stochastics recorded a short term sell signal Friday. Strength relative to the S&P 500 was positive until Friday. A correction to its 50 and 200 day moving averages is possible.
….so much more over at Don’t Monday Morning Site HERE


-
I know Mike is a very solid investor and respect his opinions very much. So if he says pay attention to this or that - I will.
~ Dale G.
-
I've started managing my own investments so view Michael's site as a one-stop shop from which to get information and perspectives.
~ Dave E.
-
Michael offers easy reading, honest, common sense information that anyone can use in a practical manner.
~ der_al.
-
A sane voice in a scrambled investment world.
~ Ed R.
Inside Edge Pro Contributors

Greg Weldon

Josef Schachter

Tyler Bollhorn

Ryan Irvine

Paul Beattie

Martin Straith

Patrick Ceresna

Mark Leibovit

James Thorne

Victor Adair