
Stocks & Equities
Said another way one could argue that we are in the golden age of the individual investor. That might seem like an odd thing to say coming off what some people call a ‘lost decade for stocks.’ However over that same time period the technological advancements that made Web 2.0, like Facebook, Twitter andLinkedIn, possible have also led to unprecedented opportunities for investors not previously seen.
We are for the moment leaving aside the state of the markets at the moment. We could have written this same post a couple of months ago when the stock market was 20% lower. We are also leaving aside the issue of whether the zero interest rate policy of the Federal Reserve represents a “war on savers” or is simply the byproduct of necessary policies. The failure of MF Global and the systemtic risks it poses for all account holders are also outside the scope of this post.
This is not a novel theme for us. Indeed one thing we note in our forthcoming book, Abnormal Returns: Winning Strategies from the Frontlines of the Investment Blogosphere, is that investing has never been “cheaper or easier.” Some of this has to do with the rise exchange traded funds. In other respects it has to do with the blossoming of the options markets. In large part, it has to do with technology. In short, never before have investors had access to data, analysis, opinion and social tools that are commonplace today. Let’s take these points one by one.
- Easier: Investors today can with a brokerage account and a computer is now only a few mouse clicks away from a globally diversified portfolio of ETFs that in terms of expenses rivals what institutions paid a decade ago. For all intents and purposes the expense ratio on the big ETFs iscloser to 0.0% that 1.0%. Many brokers now allow online trading of individual bonds and overseas securities.
…read points 2-5 HERE
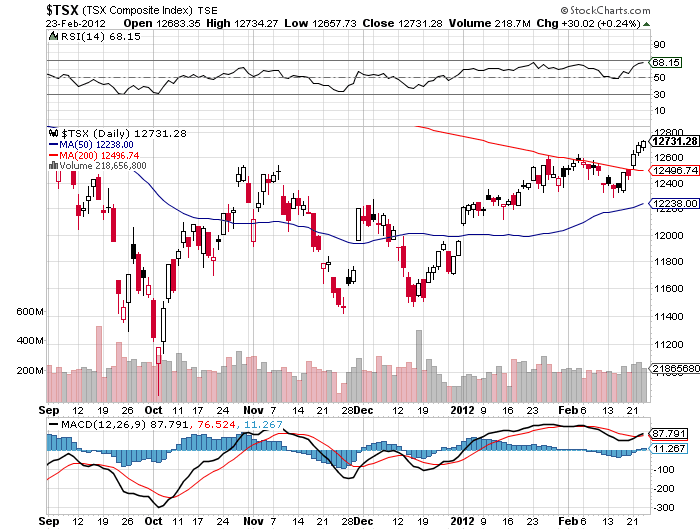

Some downbeat economic numbers from Europe combined with disappointing earnings from Dell Computer to hold stocks under water on Wednesday.
The stock market has been acting somewhat tired, particularly after the so called “deal” on Greece. There doesn’t seem to be a catalyst to push stocks meaningfully higher on the short term.
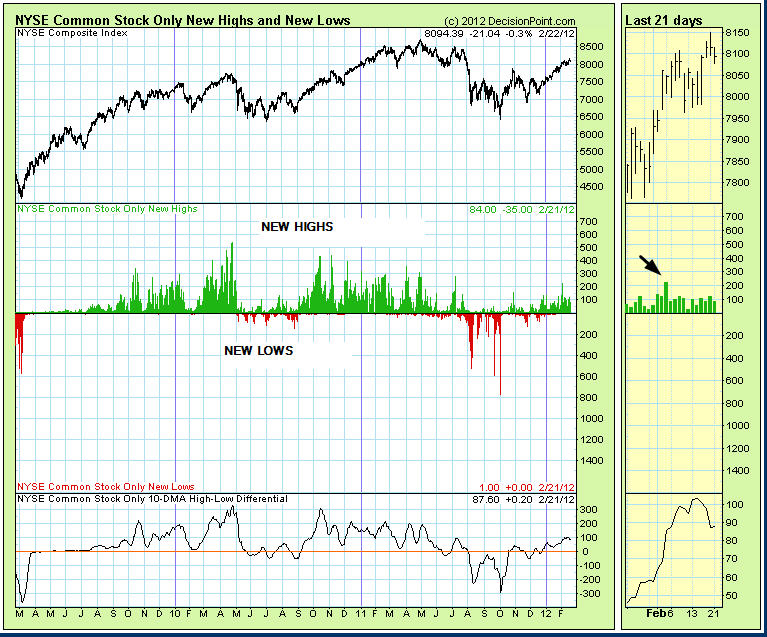
Besides the overbought condition, one indicator that concerns us is the number of new yearly highs. over the past two weeks, as the market has pushed higher, new highs have attenuated (arrow). That is frequently a signal that the market needs a short rest. We can see this in the chart below courtesy of Decisionpoint.com.
Stephen Todd was the #1 2011 Timers Digest Gold Timer of the Year – More #1 Rankings listed below
GOLD: Gold started off rather lackluster, but came on strongly as the day progressed. The yellow metal is looking pretty good here.
BONDS: Bonds rebounded somewhat on Wednesday.
THE REST: The dollar was up a bit and this probably helped push down silver, copper and crude oil, but gold bucked the trend.
BOTTOM LINE:
- Our intermediate term systems are on a buy signal.
- System 2 traders are in cash. Stay there for now.
- System 7 traders are in cash. Stay there for now.
NEWS AND FUNDAMENTALS:
Existing home sales came in at 4.57 million, less than the expected 4.69 million. On Thursday we get initial jobless claims and oil inventories.
————————————————————————————–
- We’re on a sell for bonds as of December 21.
- We’re on a sell for the dollar and a buy for the euro as of January 18.
- We’re on a buy on gold as of Feb. 21.
- We’re on a buy on silver as today Feb. 21.
- We’re on a buy for crude oil as of Feb. 13.
- We’re on a buy for copper as of December 20
We are long term bullish for all major world markets, including those of the U.S., Britain, Canada, Germany, France and Japan.
About the Todd Market Forecast:
RANKED # 1 BY TIMER DIGEST
Timer Digest of Greenwich, CT monitors and ranks over 100 of the nation’s best known stock market advisory services.
Once per year in January, Timer Digest publishes the rankings of all services monitored for multiple time frames.
For the years 2003, 2004 and 2005, The Todd Market Forecast was rated # 1 for the preceding ten years. For the year 2006, we slipped to # 3 and in 2007, we were ranked # 5.
Our bond timing was rated # 1 for the years 1997, 2007 and 2008.
Gold timing was rated # 1 for 1997 and # 2 for 2006. and # 1 for 2011.
We were # 1 in long term stock market timing for the years 1998 and 2004 and # 4 in 2010.
To subscribe go HERE.
We provide daily commentary via e-mail for the stock market, gold,monthly newsletter.
Our approach is mainly technical in nature. We pay attention to chart patterns, volume, overbought – oversold indicators and market sentiment. However, consideration is also given to fundamentals such as interest rates, Fed policy, earnings and the economy.
We have two main approaches. First we seek to provide specific entry and exit points for conservative investors who utilize mutual funds and ETFs. We also give precise instructions for short term traders who utilize ETFs, Options and stock index futures. To subscribe online go HERE
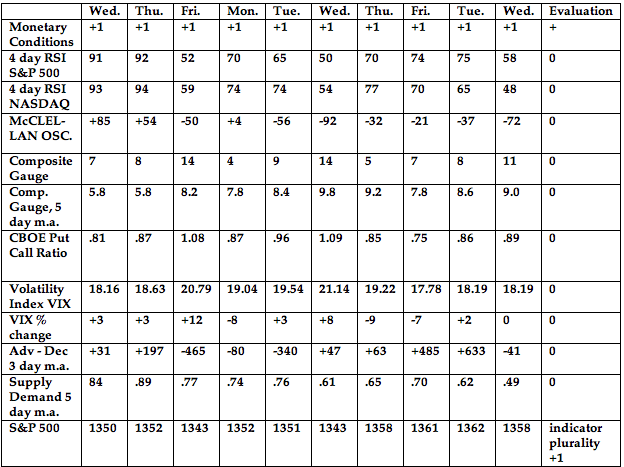
INDICATOR PARAMETERS
Monetary conditions (+2 means the Fed is actively dropping rates; +1 means a bias toward easing. 0 means neutral, -1 means a bias toward tightening, -2 means actively raising rates). RSI (30 or below is oversold, 80 or above is overbought). McClellan Oscillator ( minus 100 is oversold. Plus 100 is overbought). Composite Gauge (5 or below is negative, 13 or above is positive). Composite Gauge five day m.a. (8.0 or below is overbought. 13.0 or above is oversold). CBOE Put Call Ratio ( Below .80 is a negative. Above 1.00 is a positive). Volatility Index, VIX (low teens bearish, high twenties bullish), VIX % single day change. + 5 or greater bullish. -5 or less, bearish. Advances minus declines three day m.a.( +500 is bearish. – 500 is bullish). Supply Demand 5 day m.a. (.45 or below is a positive. .80 or above is a negative).
No guarantees are made. Traders can and do lose money. The publisher may take positions in recommended securities.
Nothing to Fear but Fear Itself
Trading success is only partly due to having the right strategy and good knowledge of the market. Emotion plays a big role in your ability to be profitable. A trader can know the market inside and out but if fear plays a role in their decision making, they will probably not do well. Here are five common fears that we each need to learn to overcome:
Fear of Missing Out
We have all thought about buying a stock but passed on it, only to watch that missed trade work extraordinarily well. This leads us to the fear of missing out. It may be that there was a good reason for not taking the trade, but if the trade works, we are likely to break our rules in the future. This leads us in to a downward spiral toward failure.
Our trading rules are, or should be, based on testing and experience. The rules of a trading strategy are designed to work over a large number of trades, but there will always be cases where they do not serve us well.
It is important that we do not judge the validity of our rules based on what happens on one trade. To change our rules should require that we find a new set of rules that works better over a large number of trades.
When evaluating a trade, don’t think about what happened on that trade that you missed. Rely on the results of your testing which determined your strategy rules in the first place. If a trade opportunity does not fit your rules, don’t take the trade.
Fear of a Profit Turning in to a Loss
Stocks do not usually go straight up. Up trends are filled with periods of price pull backs. It is these pull backs that often shake investors out of their stock because they fear that a winner will turn in to a loser.
You have to give stocks room to move but still have a set of exit rules which will maximize profits over a large number of trades.
One of the most common reasons we exit our winners too early is because we spend too much time watching the scoreboard. All brokerages have that page where you can see what your profit and loss is for your positions. If a stock is showing a gain that then goes down, we start to attach our sensitivity to money to what is happening and that leads to emotional mistakes.
To overcome this fear, start out by not watching the profit and loss and make sure you have a set of rules for when to exit that you follow.
Fear of Taking a Loss
No one likes losing money, but losing is part of winning for all successful traders. The stock market cannot be predicted with 100% accuracy making it impossible to always be right.
What we must do is minimize the size of our losses when we are wrong. When I make a trade, I know the price point that will make me hit the eject button. If the stock falls to that price, I am out and ready to move on.
It is important to set your stop loss point at a price that makes sense. An arbitrary draw down, like a move lower of 5%, is not based on the opinion of the market. If you put your stop loss point at a price that demonstrates a negative turn for the market, then getting out will save you from taking a bigger loss and that will inspire confidence in the long term.
Fear of Not Maximizing Profits
How do you feel when you sell a stock at a profit but then watch it continue higher? For many, this is a memorable pain that sits with them the next time they have a winner giving a sell signal. Instead of exiting, they hang on for a bigger gain, hoping for the home run winner.
It is important to hang on to your winners as long as they are behaving like winners. However, when the market tells you that the trend is coming to an end, you have to take the cue and exit the trade.
If you attach goals to the stock’s performance, you take the emphasis off of the stock and can miss the message of the market. Suppose you plan to buy a new car when the stock that you have a large position in hits $5. The trade is now about the new car rather than the stock and you will likely not exit the trade until it hits your target. If the stock never gets there, you are left with a winner that turned in to a loser because you failed to do what the market told you to do.
Fear of Not Knowing
There is a lot of uncertainty in the market and many people have a hard time dealing with that ambiguity. They end up making mistakes because they do not know how to make decisions in situations of uncertain outcomes.
Trading the stock market is not a science. We cannot say that if A and B happen, C will happen, we can only say that if A and B happen, C may happen. Since C does not always happen, many people have a hard time making that decision because their personality requires certain outcomes.
To be a successful trader, you have to think like a casino owner. We do not know what will happen on the next trade but, with good strategy testing, we can know what will happen if we do the same trade 100 times. The casino owner does not know who will win the next hand of Blackjack but they do know that if they deal 100 hands of Blackjack, they will make a profit. We have to put our confidence in the averages and expected outcomes of our actions, and not judge our success one trade at a time.
Strategy of the Week
This week, I just looked at a lot of charts to get a feel for the market. In general, it was a quiet week as investors seemed more interested in digesting the recent gains than taking new risks ahead of the Greek debt solution that is expected for Monday. North American markets are closed on Monday so we will wait till Monday to see the reaction from what happens in Europe.
My Market Scan this week was to look for stocks trading at least 1500 times in Canada or 2500 times in the US, focusing me in on the most active issues. Most charts were quiet but Energy stood out with Uranium and Oil and Gas stocks performing well. Below are two picks from those sectors.
1. T.UUU
The Uranium stocks were beat up by the Japanese tsunami in 2011 and it has taken almost a year for them to stabilize and start to recover. T.UUU is breaking from a rising bottom this week, a sign that the buyers are taking an interest in the stock again. Volume was strong on Friday, supporting the upward move. The stock has support at $2.65.

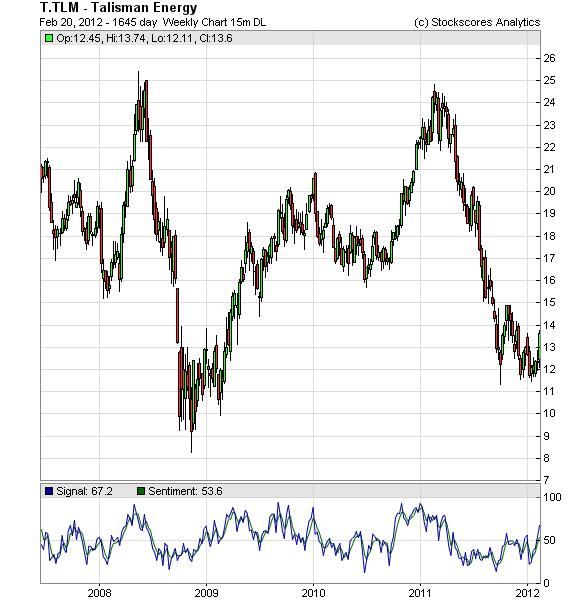
2. T.TLM
Oil made a good move to the upside this week and that helped many oil stocks look better. T.TLM (TLM) made a break of its long term downward trend line this week and looks like it is in the early stages of a long term trend reversal. Support at $11.95
References
- Get the Stockscore on any of over 20,000 North American stocks.
- Background on the theories used by Stockscores.
- Strategies that can help you find new opportunities.
- Scan the market using extensive filter criteria.
- Build a portfolio of stocks and view a slide show of their charts.
- See which sectors are leading the market, and their components.
Disclaimer
This is not an investment advisory, and should not be used to make investment decisions. Information in Stockscores Perspectives is often opinionated and should be considered for information purposes only. No stock exchange anywhere has approved or disapproved of the information contained herein. There is no express or implied solicitation to buy or sell securities. The writers and editors of Perspectives may have positions in the stocks discussed above and may trade in the stocks mentioned. Don’t consider buying or selling any stock without conducting your own due diligence.

Market Buzz – A New Breed of Small-Cap Dividend Growth Stocks Lead the Charge in 2012
2011 proved to be another very tumultuous year for both the Canadian and global markets in general. But, in the wake of the 2008 credit crisis that froze capital, seriously eroded confidence in financial institutions and the ability of our leaders to act effectively is nothing new.
With Western economies awash in debt, both public and private, the great deleveraging has just begun. Volatility is here to stay in equity markets – so get used to it.
Fortunately, over the course of 2011, a number of strong themes began to emerge and gained momentum into 2012. The first being a return to dividend paying stocks. The excesses of the preceding two decades led to the pursuit of growth as a panacea of stock valuation. The promise of future growth was intoxicating for investors and the multiples applied to the growth element of a company far exceeded any premium put on a company that thought it appropriate to actually “return capital” to their investors.
In fact, there have been several periods over the past 20 years when a company was actually given a lower multiple after instituting a dividend policy as analysts then perceived the company was signaling to the markets that the company had no better use for its capital. As such, there was little growth potential left in the company and it was now a “stodgy old dividend payer.”
But this has changed. The reasons are varied and include a low rate environment, which makes dividends or distributions very attractive; distrust of management’s stewardship of capital and a need to see “cash in hand” to keep cash generation a focus; a lack of growth opportunities as the global economy grinds lower; and for Canadians specifically, a lack of alternative income generating vehicles following what was essentially the end of the business trust segment.
Our Income Stock Research performed incredibly well in 2012. What was more a surprise was that the trend did not end at with traditional cash cows such as utilities, telco’s, and pipelines etc. Within our Small-Cap research, growth companies who managed their cash flows effectively enough to paid decent dividends also produced strong returns in 2011. Included in this list are familiar names such as Enghouse Systems Limited (TSX: ESL) (initial IWB positions established in the $8.00-$9.00 range),
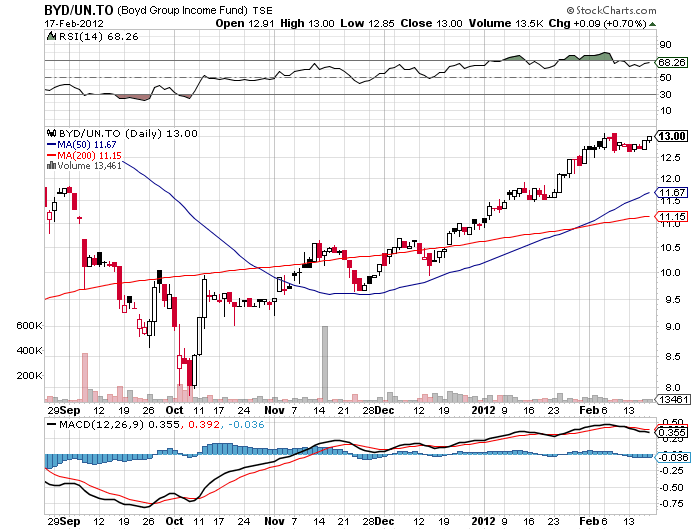
MOSAID Corporation (TSX: MSD), and Boyd Group Income Fund (TSX: BYD.UN) (initial IWB positions established in the $5.55 range), which each saw their shares rise over 50% (in the case of the latter two, over 100%).
Today, an announcement of a dividend policy or the upping of a dividend is again met with cheers from the market and we often see immediate gains – and rightfully so. What greater confidence can a management team show you as an investor than that the underlying business is generating more cash that can be paid back to you.
While growth is an essential element in our small-cap research, we have always found it prudent to invest in a basket of what we call “dividend growth stocks” and will continue to emphasize this, although not exclusively, in 2012. In the universe of investing, companies that are able to grow their dividends add an interesting dynamic to a portfolio. A growing dividend means that the income yield on the original investment also continues to grow over time.
For example, a company with a $10 share price and dividend yield of 5% will yield almost 6.7% on the initial investment after five years, if they were to grow their dividends at 6% per year. Dividend growth investors also stand to benefit from potential upside in the share price. A company that is growing their dividend in a sustainable manner will typically generate share price appreciation at the rate of dividend growth or even higher. In this scenario, if the stock in the example would appreciate almost 34% over that five year period, the company is able to grow the dividend at 6% per year. In essence, dividend growth stocks provide investors with three different sources of return – the initial dividend yield, the dividend yield growth, and the share price appreciation.
Be it in growth names or traditional cash cows, the demand for a return of capital continues to grow and we see no end to it in 2012.
KeyStone’s Latest Reports Section
- Extrusion & Automotive Manufacturer Posts Strong Q1 2012, Pays Strong Dividend (3.1%), Looks for Growth in 2012 – Reiterate BUY (Flash Update)
- Micro-Cap Oil Sands Service Company Trades at 4 Times Earnings and with Big Growth Opportunities in 2012 (New Buy Report)
- Technology – Software Company Reports Record 2011 Results, Q4 EPS Significantly Beats Street Estimates (Flash Update)
- Oil & Gas Equipment Manufacturer Announces Tripling of Quarterly Dividend (Yield Now 4%) (Flash Update)
- Contract Drilling Company, Low Valuations (5.5 times EPS), Strong Growth, Strong Rig Growth – Initiating Coverage with SPEC BUY (Focus BUY) (New Buy Report)
The Dow made another post-financial crisis rally high Thursday. To provide some further perspective to the current Dow rally and in response to several requests, all major market rallies of the last 111 years are plotted on today’s chart. Each dot represents a major stock market rally as measured by the Dow with the majority of rallies referred to by a label which states the year in which the rally began. The difference between today’s chart and last week’s chart is that for last week’s chart a rally was defined as an advance that followed a 15% correction (i.e. a major correction). For today’s chart, however, a rally is being defined as an advance that follows a 30% decline (i.e. a major bear market). As today’s chart illustrates, the Dow has begun a major rally 13 times over the past 111 years which equates to an average of one rally every 8.5 years. It is also interesting to note that the duration and magnitude of each rally correlated fairly well with the linear regression line (gray upward sloping line). As it stands right now, the current Dow rally that began in March 2009 (blue dot labeled you are here) would be classified as well below average in both duration and magnitude.
Notes:
Where’s the Dow headed? The answer may surprise you. Find out right now with the exclusive & Barron’s recommended charts of Chart of the Day Plus.

-
I know Mike is a very solid investor and respect his opinions very much. So if he says pay attention to this or that - I will.
~ Dale G.
-
I've started managing my own investments so view Michael's site as a one-stop shop from which to get information and perspectives.
~ Dave E.
-
Michael offers easy reading, honest, common sense information that anyone can use in a practical manner.
~ der_al.
-
A sane voice in a scrambled investment world.
~ Ed R.
Inside Edge Pro Contributors

Greg Weldon

Josef Schachter

Tyler Bollhorn

Ryan Irvine

Paul Beattie

Martin Straith

Patrick Ceresna

Mark Leibovit

James Thorne

Victor Adair