

Some downbeat economic numbers from Europe combined with disappointing earnings from Dell Computer to hold stocks under water on Wednesday.
The stock market has been acting somewhat tired, particularly after the so called “deal” on Greece. There doesn’t seem to be a catalyst to push stocks meaningfully higher on the short term.
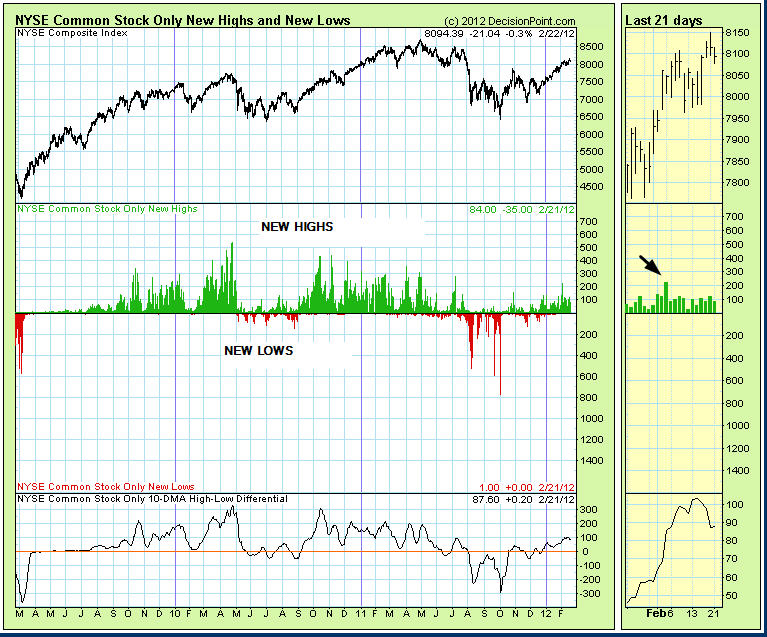
Besides the overbought condition, one indicator that concerns us is the number of new yearly highs. over the past two weeks, as the market has pushed higher, new highs have attenuated (arrow). That is frequently a signal that the market needs a short rest. We can see this in the chart below courtesy of Decisionpoint.com.
Stephen Todd was the #1 2011 Timers Digest Gold Timer of the Year – More #1 Rankings listed below
GOLD: Gold started off rather lackluster, but came on strongly as the day progressed. The yellow metal is looking pretty good here.
BONDS: Bonds rebounded somewhat on Wednesday.
THE REST: The dollar was up a bit and this probably helped push down silver, copper and crude oil, but gold bucked the trend.
BOTTOM LINE:
- Our intermediate term systems are on a buy signal.
- System 2 traders are in cash. Stay there for now.
- System 7 traders are in cash. Stay there for now.
NEWS AND FUNDAMENTALS:
Existing home sales came in at 4.57 million, less than the expected 4.69 million. On Thursday we get initial jobless claims and oil inventories.
————————————————————————————–
- We’re on a sell for bonds as of December 21.
- We’re on a sell for the dollar and a buy for the euro as of January 18.
- We’re on a buy on gold as of Feb. 21.
- We’re on a buy on silver as today Feb. 21.
- We’re on a buy for crude oil as of Feb. 13.
- We’re on a buy for copper as of December 20
We are long term bullish for all major world markets, including those of the U.S., Britain, Canada, Germany, France and Japan.
About the Todd Market Forecast:
RANKED # 1 BY TIMER DIGEST
Timer Digest of Greenwich, CT monitors and ranks over 100 of the nation’s best known stock market advisory services.
Once per year in January, Timer Digest publishes the rankings of all services monitored for multiple time frames.
For the years 2003, 2004 and 2005, The Todd Market Forecast was rated # 1 for the preceding ten years. For the year 2006, we slipped to # 3 and in 2007, we were ranked # 5.
Our bond timing was rated # 1 for the years 1997, 2007 and 2008.
Gold timing was rated # 1 for 1997 and # 2 for 2006. and # 1 for 2011.
We were # 1 in long term stock market timing for the years 1998 and 2004 and # 4 in 2010.
To subscribe go HERE.
We provide daily commentary via e-mail for the stock market, gold,monthly newsletter.
Our approach is mainly technical in nature. We pay attention to chart patterns, volume, overbought – oversold indicators and market sentiment. However, consideration is also given to fundamentals such as interest rates, Fed policy, earnings and the economy.
We have two main approaches. First we seek to provide specific entry and exit points for conservative investors who utilize mutual funds and ETFs. We also give precise instructions for short term traders who utilize ETFs, Options and stock index futures. To subscribe online go HERE
INDICATOR PARAMETERS
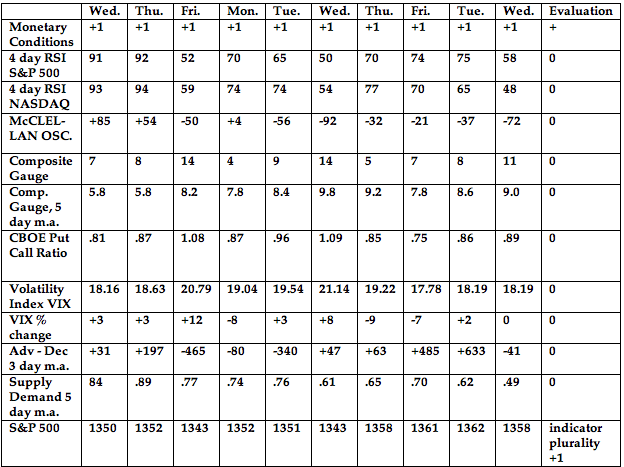
Monetary conditions (+2 means the Fed is actively dropping rates; +1 means a bias toward easing. 0 means neutral, -1 means a bias toward tightening, -2 means actively raising rates). RSI (30 or below is oversold, 80 or above is overbought). McClellan Oscillator ( minus 100 is oversold. Plus 100 is overbought). Composite Gauge (5 or below is negative, 13 or above is positive). Composite Gauge five day m.a. (8.0 or below is overbought. 13.0 or above is oversold). CBOE Put Call Ratio ( Below .80 is a negative. Above 1.00 is a positive). Volatility Index, VIX (low teens bearish, high twenties bullish), VIX % single day change. + 5 or greater bullish. -5 or less, bearish. Advances minus declines three day m.a.( +500 is bearish. – 500 is bullish). Supply Demand 5 day m.a. (.45 or below is a positive. .80 or above is a negative).
No guarantees are made. Traders can and do lose money. The publisher may take positions in recommended securities.


