
Stocks & Equities
Maintain Healthy Cash.
The Bottom Line
Look for wild volatility in equity markets this week. However, the correction in North American equity markets that started on August 2nd and likely to last until the end of October continues to be a flat rather than a downtrend. Preferred strategy is to maintain a healthy cash position in preparation for possible entry into the favourable seasonal starting in late October.
Economic News This Week
Canadian July Real GDP to be released at 8:30 AM EDT on Monday is expected to increase 0.5% versus a decline of 0.5% in June.
September Chicago PMI to be released at 9:45 AM EDT on Monday is expected to increase to 54.3 from 53.0 in August.
September ISM to be released at 10:00 AM EDT on Tuesday is expected to slip to 55.2 from 55.7 in August.
August Construction Spending to be released at 10:00 AM EDT on Tuesday is expected to increase 0.4% versus a gain of 0.6% in July
September ADP Private Payrolls to be released at 8:15 AM EDT on Wednesday are expected to slip to 175,000 from 176,000 in August
Weekly Initial Jobless Claims to be released at 8:30 AM EDT on Thursday are expected to increase to 315,000 from 305,000 last week.
August Factory Orders to be released at 10.00 AM EDT on Thursday are expected to increase 0.2% versus a decline of 2.4% in July.
September ISM Services to be released at 10:00 AM EDT on Thursday are expected to slip to 57.0 from 58.6 in August.
September Non-farm Payrolls to be released at 8:30 AM EDT on Friday are expected to increase to 183,000 from 169,000 in August. September Private Non-farm Payrolls are expected to increase to 180,000 from 152,000 in August. September Unemployment Rate is expected to slip to 7.3% from 7.5% in August. September Hourly Earnings are expected to increase 0.2% versus a gain of 0.2% in August
Equity Trends
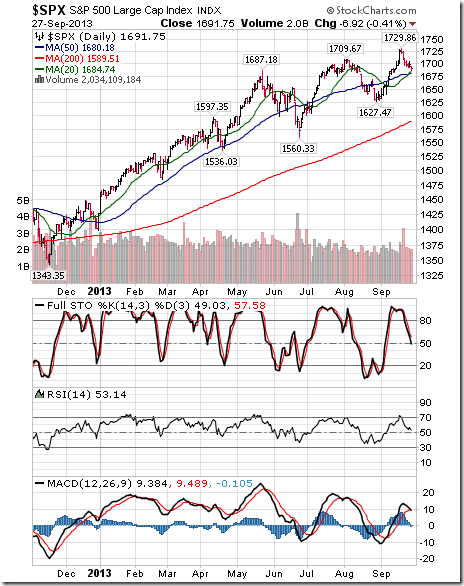
The S&P 500 Index fell 18.16 points (1.06%) last week. Trend remains up. The Index remains above its 20 and 50 day moving averages. Short term momentum indicators are trending down.
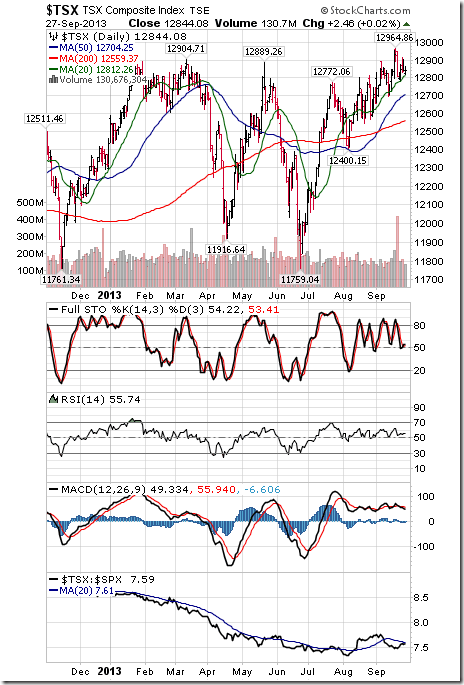
The TSX Composite Index added 37.61 points (0.03%) last week. Trend remains up (Score: 1.0). The Index remains above its 20 day moving average (Score: 1.0). Strength relative to the S&P 500 Index changed from negative to neutral (Score: 0.5). Technical score based on the above indicators improved to 2.5 from 2.0 out of 3.0. Short term momentum indicators are neutral.
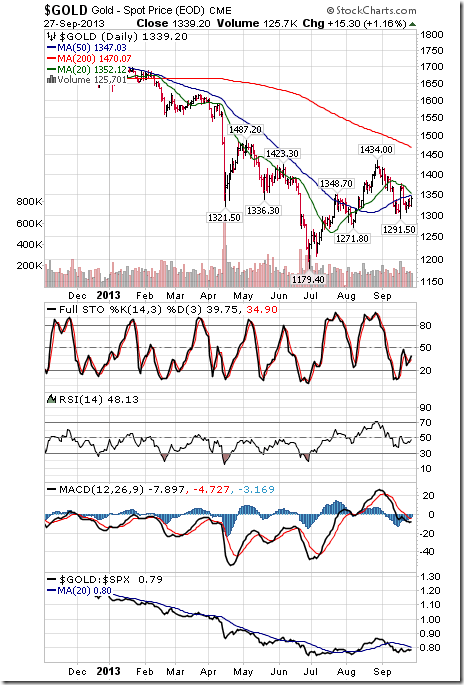
Gold added $6.70 per ounce (0.50%) last week. Trend remains up. Gold remains below its 20, 50 and 200 day moving averages. Strength relative to the S&P 500 Index remains negative. Technical score remained at 1.0 out of 3.0. Short term momentum indicators have recovered to a neutral level.
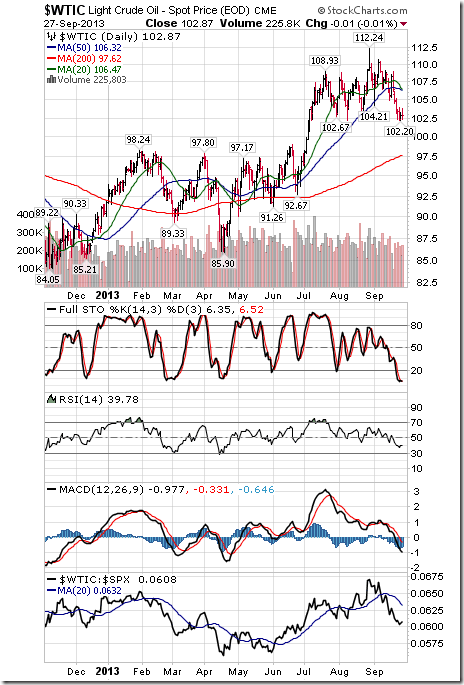
Crude oil fell $1.88 per barrel (1.79%) last week. Trend changed from up to neutral on a move below $102.22. Crude remains below it s20 and 50 day moving averages. Strength relative to the S&P 500 Index remains negative. Technical score eased to 0.5 from 1.0 out of 3.0. Short term momentum indicators are oversold.
….much more HERE including 45 more charts

 I know what you’re thinking, punk. You’re thinking: “Did he fire six shots or only five?” Now to tell you the truth I forgot myself in all this excitement. But being this is a .44 Magnum, the most powerful handgun in the world, and will blow your head clean off, you’ve gotta ask yourself a question: “Do I feel lucky?”
Well, do ya, punk?
The Dow finally broke its losing streak yesterday. It rose 55 points. Gold fell $12.
Nothing dramatic. Nothing conclusive. Or even persuasive.
Stocks are going up… or down. No one knows for sure.
We’re not gamblers. So we’re out of US stocks… and our “Crash Alert” flag flies… not because we think stocks are going down, but because we think the weight of risk lies on the downside.
That said, the feds have added $3 trillion in cash and some $23 trillion in credit guarantees over the last five years. Something had to happen to the money, right?
Don’t bother looking for it in the trailer parks. Hourly wages are no higher. And fewer people (as a percentage of the workforce) have jobs than ever before.
Household incomes are stagnant. So you won’t find it under middle-class seat cushions, either…
Real estate? Ultra-low mortgage rates hardly hurt…
But only stocks have skyrocketed…
According to former Merrill Lynch economist David Rosenberg, since the March 2009 low there has been a near-perfect correlation between a higher S&P 500 and the expansion of the Fed’s balance sheet.
So, we can plausibly assume the Fed will continue to push up stock prices – at a rate of about $85 billion per month… or about $1 trillion a year.
We may even assume that, by back-tracking on its own forward guidance, the Fed has now embarked on a new stage of perpetual money-pumping. And that investors might now anticipate trillions more dollars’ worth of stock buying.
From bearish fund manager John Hussman:
Investors may draw on this decision as evidence that the Federal Open Market Committee (FOMC) has placed a safety net below the market… and that the surprising extension of its current policies could spark a short-term speculative blow-off top.
We don’t deny it. Under these conditions, the bulls might be right. They might bet on a blow-off with much higher stock prices. They might make money.
Dear readers who are feeling lucky might take a chance. Buy some call options. Who knows? They could pay off big!
But dear readers are warned: Gamblers gotta know when to fold ‘em… and know when to walk away, too.
A bet on a blow-off top is a bet that: (1) the economy is not really recovering, (2) the Fed won’t taper, (3) with no real recovery, the cash goes into speculations, and 4) the most likely speculative market is stocks.
This is not a bad bet. “As long as the music is playing, you’ve got to get up and dance,” said former Citigroup boss Chuck Prince. But it’s risky. Because they don’t hold up cue cards to tell you when they’re going to pull the plug. Instead, as the end approaches, the party grows wilder and wilder.
Ah yes, dear reader, they don’t make it easy. The closer you are to disaster, the harder it is to leave. Just before the blow-off turns into a blow-up, stocks are typically going straight up. Who wants to leave the party then?
But when the lights go out, suddenly everybody rushes for the exits. But it’s too late. Bodies pile up in the doorways. It is impossible to get out.
The same is true of the entire Fed intervention. The more the central bank intervenes, the more dependent the economy becomes, and the harder it is to exit. They say they will head for the door when the numbers improve… but as soon as they make a move to the exit, the numbers will collapse.
In this sense, too, the bulls are reading the latest Fed announcement correctly. The Fed will keep at it until the bitter end. It will feed the market with more cash and credit. Then it will find it impossible to back up. Instead, it will keep going until we get a blow-off top in stock prices.
The bulls don’t realize they are subject to the same phenomenon: Gambling on a blow-off top is hard to stop. Gamblers do not walk away from 100%-a-year gains. They stay at the table… and go right to the end… from the blow-off to the blow-up.
There’s a better way to play this situation. By “anti-gambling”…
More next week…
Douglas McIntyre, of 24/7 Wall Street, recently wrote an article discussing the 10 reasons why the market will, or won’t, crash. The problem is that the view presented is terribly myopic which creates a misleading discussion of the current market environment. My notations are in blue in order to balance the discussion accordingly:
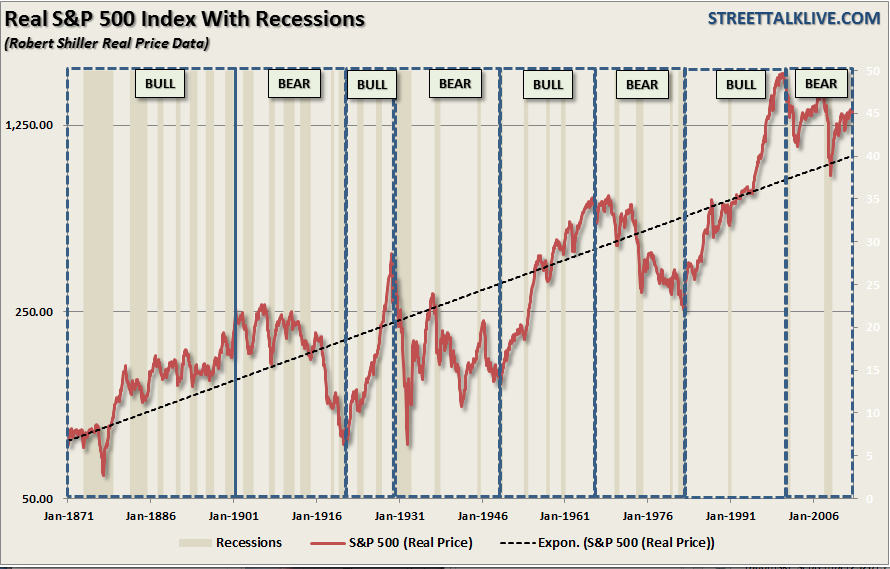
Like clockwork, every time the American stock market makes new highs, some people insist it cannot go higher. A subset of those believe the market will crash. Others even believe it will reset like it did when the S&P 500 dropped from more than 1,500 in October 2007 to just above 600 in March 2009. A review of the most widely held beliefs about why a new crash is coming shows that some are bogus, while others almost certainly are likely to be right.
The reason that when markets push to new highs that analysts begin to discuss the potential for the next crash is simply because every crash in history has occurred from market highs. The chart below shows the history of the S&P 500 going back to 1871. Each major “crash”has occurred from market peaks when valuations, based on trailing 12 months reported earnings, exceeded 20x earnings.
….much more HERE
On the all-important earnings environment, today’s chart illustrates ‘as reported’ S&P 500 earnings growth (i.e. 12-month rate of change) since 1940. There are a couple of points of interest. For one, earnings growth has tended to peak in the 20 to 40% range and trough somewhere in the -10 to -20% range. At least that was the case up until this millennium. Since the dot-com crash (i.e. the 2001 – 2002 timeframe), earnings growth volatility has increased dramatically. In fact, the post-financial crisis spike to 793% is not even shown on today’s chart so as to allow the rest of the data to remain visible (i.e. not flattened out). It is worth noting that this historic post-financial crisis earnings growth spike is due in large part to the fact that earnings came in so low as a result of the financial crisis. Currently, earnings growth has just moved into positive territory but remains well below average.
Notes:
Where’s the Dow headed? The answer may surprise you. Find out right now with the exclusive & Barron’s recommended charts of Chart of the Day Plus.
Quote of the Day
“Anybody can cut prices, but it takes brains to make a better article.” – Philip D. Armour
Events of the Day
October 07, 2013 – Supreme Court session begins
Stocks of the Day
— Find out which stocks investors are focused on with the most active stocks today.
— Which stocks are making big money? Find out with the biggest stock gainers today.
— What are the largest companies? Find out with the largest companies by market cap.
— Which stocks are the biggest dividend payers? Find out with the highest dividend paying stocks.
— You can also quickly review the performance, dividend yield and market capitalization for each of the Dow Jones Industrial Average Companies as well as for each of the S&P 500 Companies.
Mailing List Info
Chart of the Day is FREE to anyone who subscribes.
To ensure email delivery of Chart of the Day, add mailinglist@chartoftheday.com to your whitelist.
Mailing List Info
Chart of the Day is FREE to anyone who subscribes.
To ensure email delivery of Chart of the Day, add mailinglist@chartoftheday.com to your whitelist.
Subscribe to – Chart of the Day
Emerging economies including China and India, which are growing several times faster than the U.S., have nevertheless disappointed investors this year. The S&P 500 Index of the U.S. has rallied 22 percent, compared with the benchmark MXEF, MSCI Emerging Markets Index’s 1.46 percent loss.
U.S. stock markets clearly aren’t forward-looking. They’re blind. They’re no longer following fundamentals. They’re bedazzled by only one thing: How much money the Federal Reserve and other central banks will print.Nothing else matters.

Does that mean it’s time for investors seeking long-term value to look outside the U.S.?
With the U.S. economy expected to grow 2 percent a year and the U.K. at 1.5 percent, compared with China expanding at 7.5 percent and India at 5 percent, it may be time to look elsewhere.
Consider this: Other than the U.S. and Germany, all Western markets are lower than they were in 1999. In real-inflation-adjusted terms, even the U.S. and Germany are down about 30 percent.
 So far this year, investors have disregarded emerging markets’ economic advantages in favor of focusing on the risks, namely Fed policies that suck capital out of their financial systems like a giant vacuum cleaner and into speculative U.S. assets.
However, investors who are focused only on American investments run the risk of missing out over the long run. That’s because the fundamental advantages of emerging markets, particularly in Asia, remain solidly in place, including:
- A strong banking system supported by high personal savings rates. Banks have avoided foolish lending practices and are in a much stronger position to finance economic growth than peers in the developed world.
- Ample foreign-currency reserves with flexible exchange-rate policies.
- Companies with healthy balance sheets.
- Strong growth fundamentals — fast-growing, increasingly richer, middle classes; continuing strong investment in infrastructure that promotes economic growth; generally business-friendly government economic policies.
With forward-looking price-to-earnings ratios for emerging markets now below 10 (compared with almost double that in the U.S.), shares of companies in the emerging world have rarely been so cheap.
As the iconic investor Warren Buffett says: “Price is what you pay, value is what you get.”
Along that line, that’s why I believe the emerging markets have fallen back toward levels that represent good value. While they could continue to lag in the short run, especially if their currencies weaken, it’s my view that patient investors who maintain a balanced portfolio will be well-rewarded.
See Money and Markets‘ Facebook page to get my investment recommendation for emerging markets.
Best wishes,
Bill


-
I know Mike is a very solid investor and respect his opinions very much. So if he says pay attention to this or that - I will.
~ Dale G.
-
I've started managing my own investments so view Michael's site as a one-stop shop from which to get information and perspectives.
~ Dave E.
-
Michael offers easy reading, honest, common sense information that anyone can use in a practical manner.
~ der_al.
-
A sane voice in a scrambled investment world.
~ Ed R.
Inside Edge Pro Contributors

Greg Weldon

Josef Schachter

Tyler Bollhorn

Ryan Irvine

Paul Beattie

Martin Straith

Patrick Ceresna

Mark Leibovit

James Thorne

Victor Adair