“This site will be about the Dow formation that we see below. This formation is known as the “megaphone formation” or the “broadening formation.
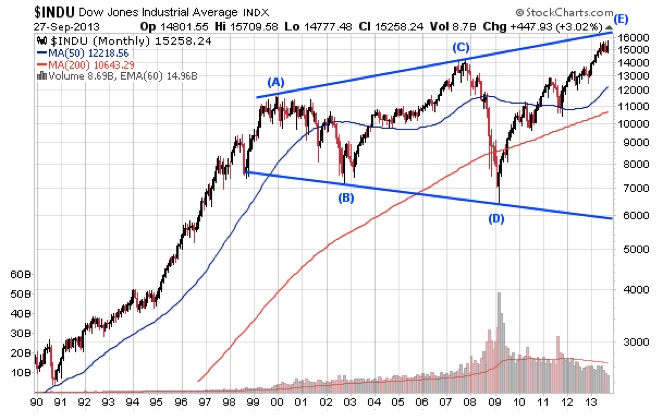
The broadening formation is indicative of a market in turmoil, with sentiment swinging wildly from one way to the other. Incredibly, the broadening formation has appeared in every major bear market since 1929. It appeared prior to WWII in 1929. It appeared in 1957 and 1965-66. We saw a broadening top in 1987 and again in 1998-2000. The most recent broadening formation we saw was in 2004 to 2008.
I have long speculated about the sentiment basis of broadening formations. Each broadening formation is made up of three rising waves and two corrective waves. As far as sentiment is concerned, I believe broadening formations are the result of wildly swinging reversals in sentiment from bearish to bullish — and then bearish, and finally a huge swing back to extreme bullishness. This final wave of optimism is the market’s kiss of death, since this final rising wave takes stocks far above known values.
The current broadening formation is unique in that it is, by far, the largest broadening formation that I have ever seen. Note that wave D to E has not yet touched the upper trendline. Frankly, I don’t know whether it is necessary for the Dow to make contact with the upper trendline in order to complete the formation.
If the Dow is to touch the upper trendline of the formation, the Dow will have to advance to at least 16,000, which would be an all-time high. An interesting thesis here is that earnings alone are not the reason for the Dow advancing. What is driving this market higher is an increase in price/earnings. In other words, earnings have not been rising, but what has been boosting the market is investors’ sentiment. Investors have been increasingly bullish on the market, and therefore, they have been willing to pay more and more for the same amount of earnings.
I’ve written about this before. The major swings in stock prices are often a result of drastic changes in the price/earnings ratio. Investors become too bullish or too bearish about stocks. When they become too bullish, this thrusts stocks into the dangerously overvalued zone. The opposite is true when investors become too bearish. Charles Dow wrote that unless there was some special reason, stocks were overvalued when dividends sank below 3.5%.
Back to the broadening formation: In past cases, the bear market associated with a broadening formation carried to the lower trendline of the formation. So let’s consider that the current broadening formation follows the typical pattern. In that case, we might expect the Dow to top out anywhere from its current position to a level around 16,000 or even a bit higher.
Assuming that a major bear market will begin from wherever the Dow tops out, we can assume that the Dow will decline to at least the right end of the lower trendline of the broadening formation. If that holds true, then we can expect the bear market will take the Dow down to at least 5,000. That would represent a horrendous loss, although not nearly as bad as the 1929 to 1932 bear market.
I’ve searched my mind to try to understand what a bear market to Dow 5,000 might mean. In the first place, I think such a bear market could involve a new monetary system. I also think a huge bear market would see the balance of international power shift from the US to China. Finally, the giant megaphone formation that I show could be an advance message to the effect that we must all be ready for massive and radical change.
Question — How do you think we should prepare for these massive changes that you foresee? I’m not really sure, but my first response is that we must abolish greed and become spiritual. Currently, it seems to me that the emphasis is on profit, growth at any price, power, greed and wealth.”
To subscribe to Richard Russell’s Dow Theory Letters CLICK HERE.
About Richard Russell
Russell began publishing Dow Theory Letters in 1958, and he has been writing the Letters ever since (never once having skipped a Letter). Dow Theory Letters is the oldest service continuously written by one person in the business.
Russell gained wide recognition via a series of over 30 Dow Theory and technical articles that he wrote for Barron’s during the late-’50s through the ’90s. Through Barron’s and via word of mouth, he gained a wide following. Russell was the first (in 1960) to recommend gold stocks. He called the top of the 1949-’66 bull market. And almost to the day he called the bottom of the great 1972-’74 bear market, and the beginning of the great bull market which started in December 1974.
Letters are published and mailed every three weeks. We offer a TRIAL (two consecutive up-to-date issues) for $1.00 (same price that was originally charged in 1958). Trials, please one time only. Mail your $1.00 check to: Dow Theory Letters, PO Box 1759, La Jolla, CA 92038 (annual cost of a subscription is $300, tax deductible if ordered through your business).