The Bottom Line
The correction in North American equity markets that started on August 2nd is proving to be a flat trend rather than a downtrend. Look for more of the same until well into October. Preferred strategy is to maintain a healthy cash position for possible entry into the favourable seasonal trade in October.
Economic News This Week
Canadian July Retail Sales to be released at 8:30 AM EDT on Tuesday are expected to increase 0.6% versus a decline of 0.6% in June.
July Case-Shiller 20 City Home Price Index to be released at 9:00 AM EDT on Tuesday is expected to increase to 12.5% from 12.1% on a year-over-year basis.
September Consumer Confidence to be released at 10:00 AM EDT on Tuesday is expected to slip to 80.3 from 81.5 in August
August Durable Goods Orders to be released at 8:30 AM EDT on Wednesday are expected to ease 0.1% versus a decline of 7.4% in July. Excluding Transportation, August Orders are expected to improve 1.1% versus a decline of 0.8% in July
August New Home Sales to be released at 10:00 AM EDT on Wednesday are expected to increase to 425,000 from 394,000 in July.
Weekly Jobless Claims to be released at 8:30 AM EDT on Thursday are expected to increase to 330,000 from 309,000 last week.
Third estimate of second quarter GDP to be released at 8:30 AM EDT on Thursday is expected to increase to 2.7% from the second estimate of 2.5%
August Personal Income to be released at 8:30 AM EDT on Friday is expected to increase 0.4% versus a gain of 0.1% in July.August Personal Spending is expected to increase 0.3% versus a 0.1% gain in July.
September Michigan Sentiment Index to be released at 9:55 AM EDT on Friday is expected to improve to 78.0 from 76.8 in August.
Equity Trends
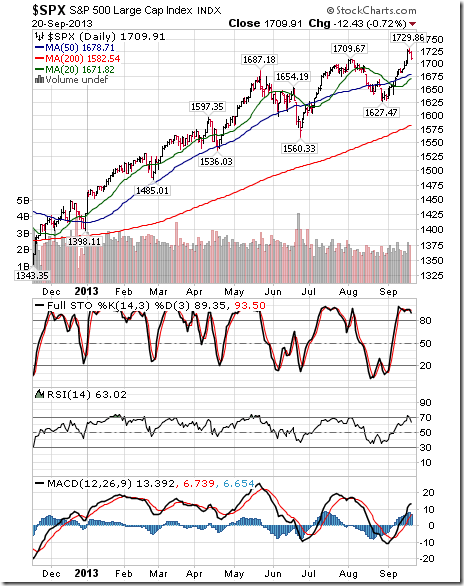
The S&P 500 Index added 21.92 points (1.30%) last week. Uptrend was confirmed when the Index moved above 1,709.91 to an all-time high. The Index remains above its 20 and 50 day moving averages. Short term momentum indicators are overbought and showing early signs of rolling over.
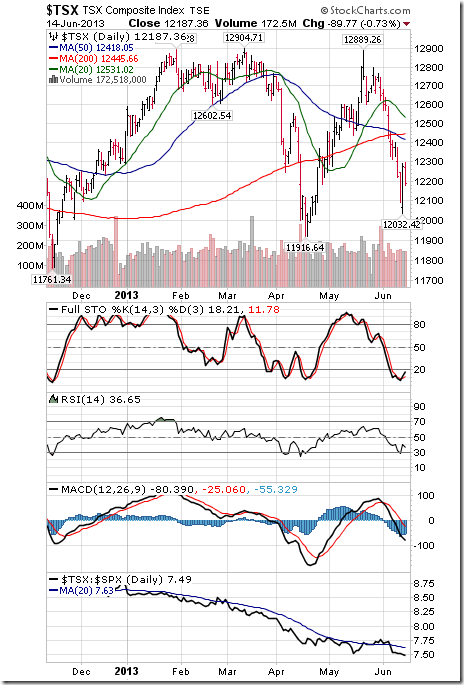
The TSX Composite Index added 83.07 points (0.65%) last week. Uptrend was confirmed on a move above 12,904.71 to reach a two year high. The Index remains above its 20 day moving average. Strength relative to the S&P 500 Index remained negative. Technical score remained at 2.0 out of 3.0. Short term momentum indicators are overbought and showing early signs of peaking.
The TSX Metals and Mining Index added 10.27 points (1.28%) last week. Trend remains up. The Index remains above its 20 day moving average. Strength relative to the S&P 500 Index remains neutral. Technical score remains at 2.5 out of 3.0. Short term momentum indicators are overbought.

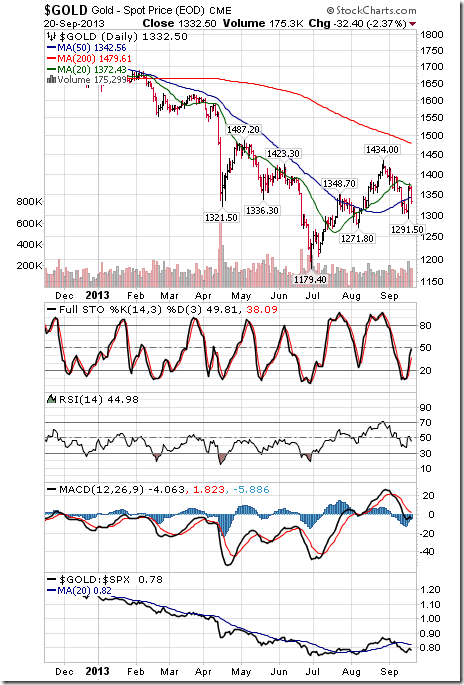
Gold added $23.90 per ounce (1.83%) last week. Trend remains up. Gold remains below its 20 and 50 day moving averages. Strength relative to the S&P 500 Index remains negative. Technical score remained at 1.0 out of 3.0. Short term momentum indicators are recovering from oversold levels.
….go HERE for 45 more charts on Interest Rates, Commodities, Stocks & Currencies
Special Free Services available through www.equityclock.com
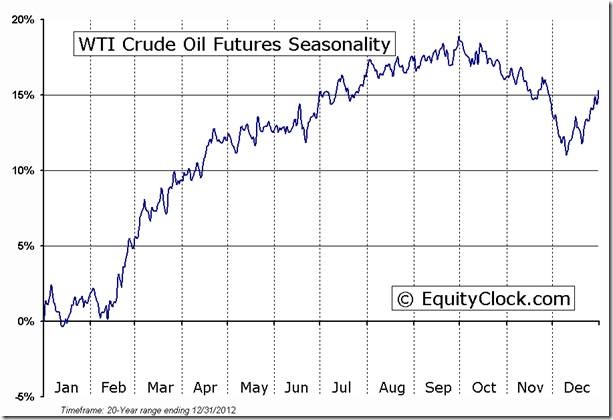
Equityclock.com is offering free access to a data base showing seasonal studies on individual stocks and sectors. The data base holds seasonality studies on over 1000 big and moderate cap securities and indices. Notice that most of the seasonality charts have been updated recently.
To login, simply go to http://www.equityclock.com/charts/
Following is an example: