
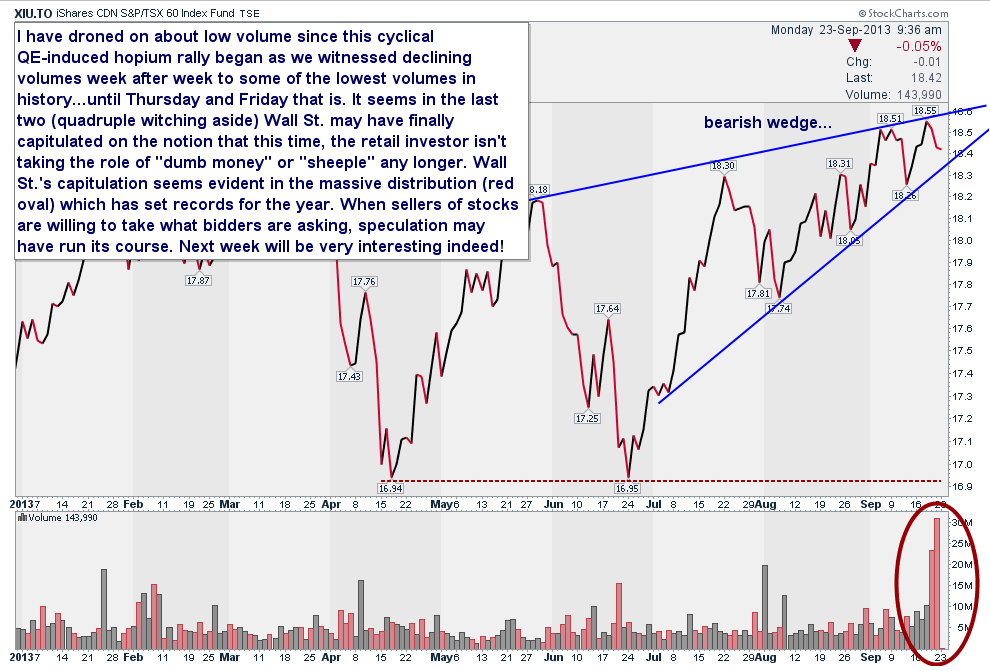
Markets that see volume of transactions evaporate on up days and surge on down days have traditionally offered a warning sign to invested capital. The price action on Friday for the Canadian TSX 60 (here captured in the XIU) is just one of several red flags to anyone who is paying attention to downside risk. Red bars at bottom of this chart (in red oval) denote selling pressure and should be compared with the grey bars of buying pressure shown here on the other trading days year to date.

Source: Cory Venable, CMT, Venable Park Investment Counsel Inc.
Ed Note: More from Danielle Park
How the economic machine works


