
Daily Updates
As for the equity market, we are at a critical juncture and it could break any day. After successfully testing support at the key Fibonacci retracement level of 1,040, the S&P 500 has since bounced up to the 200-day moving average of 1,115 – and this failed to hold. Resistance prevailed. My sense is that the market will break to the downside, and for three reasons:
1. Even if a double dip is avoided, the market is not priced for a growth relapse.
2. The intense volatility in the major averages over the past three months is consistent with the onset of a bear phase.
3. Bob Farrell believes a test of the March 2009 lows is likely. I don’t think anyone is in a position to debate five decades of experience, not to mention his track record. Louise Yamada, a legend in her own right, not to mention the likes of Bob Prechter and Richard Russell, are on this same page. Notice how none of them work at a Wall Street bank.
MARKET THOUGHTS
Well, well, so much for consensus views. Like the one we woke up to on Monday morning recommending that bonds be sold and equities be bought on the news of China’s “peg” decision. As we said on Monday, did the 20%-plus yuan appreciation from 2005 to 2008 really alter the investment landscape all that much? It looks like Mr. Market is coming around to the view that all China managed to really accomplish was to shift the focus away from its rigid FX policy to Germany’s rigid approach towards fiscal stimulus.
What is becoming clearer, especially after the latest reports on housing starts, permits, resales and builder sentiment surveys, is that housing is already double dipping in the U.S. The MBA statistics just came out for the week of June 18 and the new purchase index fell 1.2% – down 36.5% from year-ago levels and that year-ago level itself was down 22% from its year-ago level. Capish, paisan? So far, June is averaging 14.5% below May’s level and May was crushed 18% sequentially, so do not expect what is likely to be an ugly new home sales report for May today to be just a one-month wonder. Meanwhile, the widespread view out of the economics community is that we will see at least 3% growth in the second half of the year: fat chance of that.
What is fascinating is how the ECRI, which was celebrated by Wall Street research houses a year ago, is being maligned today for acting as an impostor — not the indicator it is advertised to be because it gets re-jigged to fit the cycle.
From our lens, there is nothing wrong in trying to improve the predictive abilities of these leading indicators. Still — it is a comment on how Wall Street researchers are incentivized to be bullish because nobody we know criticized the ECRI as it bounced off the lows (not least of which our debating pal, James Grant).
Also in Today’s Breakfast with Dave:
• While you were sleeping: a rough day for global equity markets; bonds retain their bid; the greenback is back in vogue
• True, North, Strong… And free. Canada has basically been re-rated coming out of the credit crisis as a bastion of stability in an increasingly unstable world
• The next best thing to having a bullish bond column published in the FT is to see an article about deflation. Indeed, deflation is the primary trend ahead
• Canadian inflation in-check: no big surprises in the latest CPI report; inflation remains below the BoC’s “operational target”
• More disappointing U.S. housing data: existing home sales fell 2.2% MoM in May
….read David’s summary version HERE
….Sign up for David’s Detailed version HERE
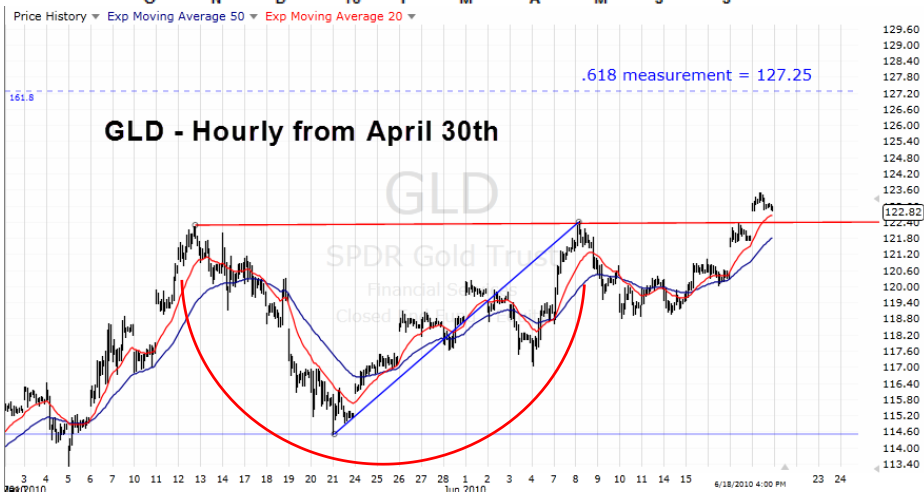
Gold and Gold Stock June 2010 Market Forecast HERE
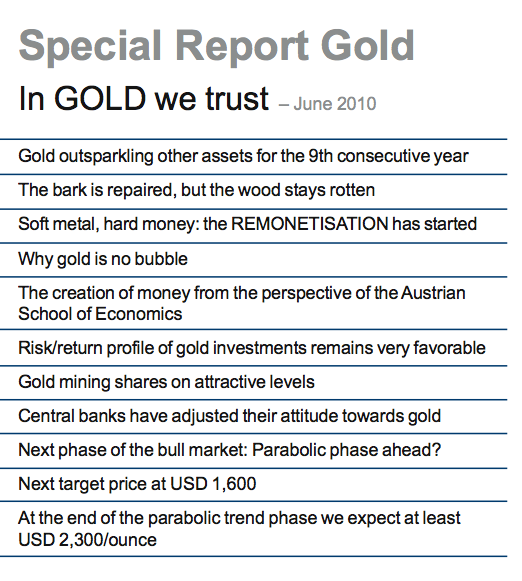
In GOLD we trust – June 2010
Table of contents
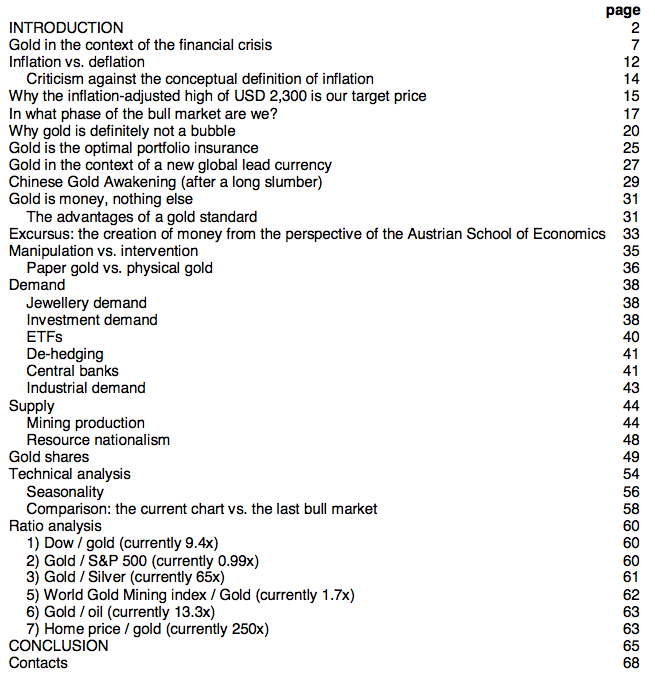
Special Report HERE
Introduction:
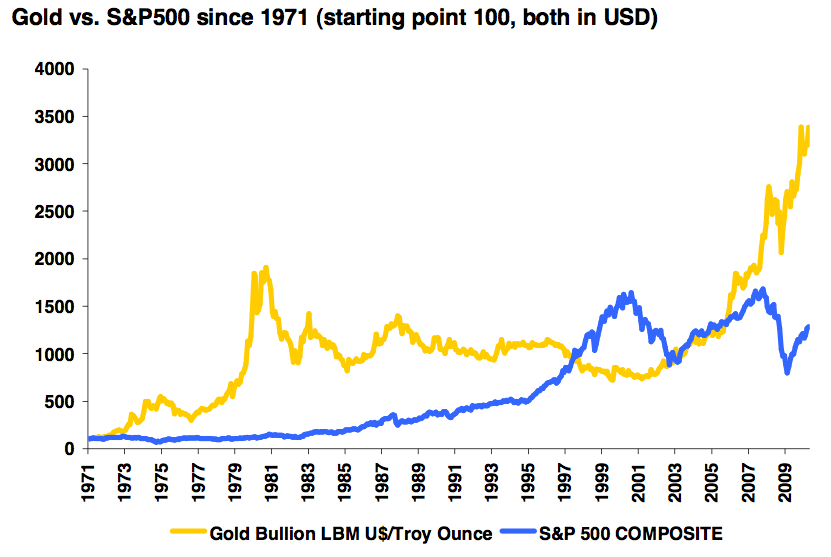
2009 was an exciting and lucrative year for gold investors. Our first target price of USD 1,300 was almost reached, but to reiterate an earlier statement – our actual target is USD 2,300/ounce. The gold price broke the USD 1,000 mark on a sustainable basis and increased by 24% y/y in USD terms and by 20.5% y/y in EUR terms. But 2010 and beyond should turn out even more interesting for gold – and we would like to discuss the reasons in our fourth annual Gold Report.
Conclusion:
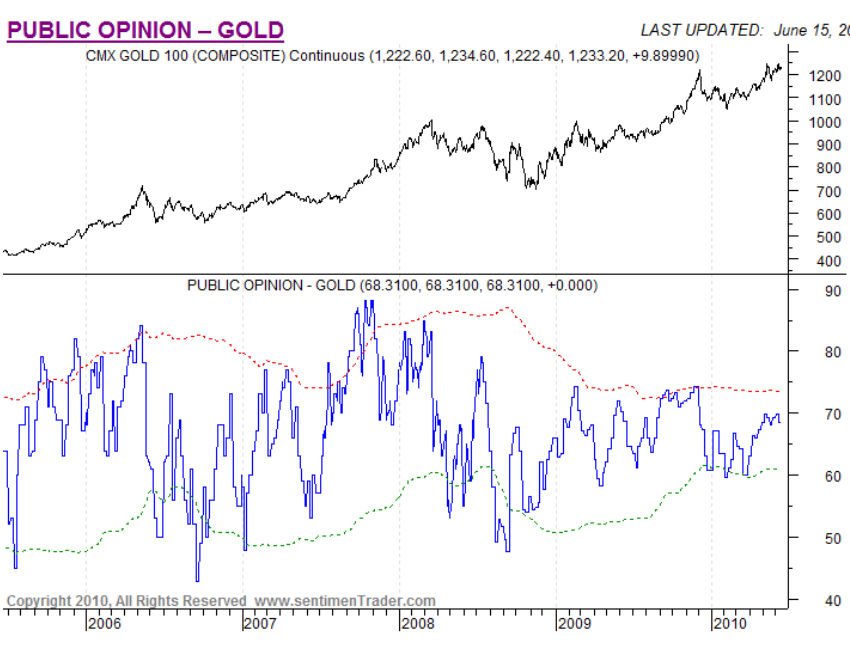
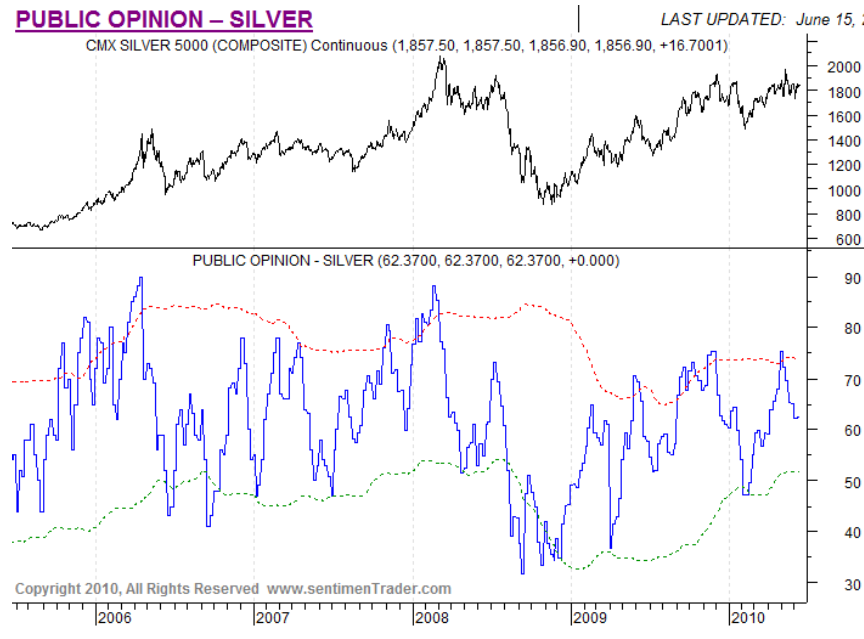
In the short run, the sentiment seems a bit overly optimistic, and also, the CoT positioning would suggest a correction. From the third and fourth quarter onwards, positive seasonals should be lending support. Our next 12-month target is USD 1,600. We expect the parabolic trend phase to still be ahead of us. At the end of this cycle the price should reach our target of USD 2,300.
Gold and Gold Stock June 2010 Market Forecast HERE
11 More Fascinating Charts below:


Gold and Gold Stock June 2010 Market Forecast HERE
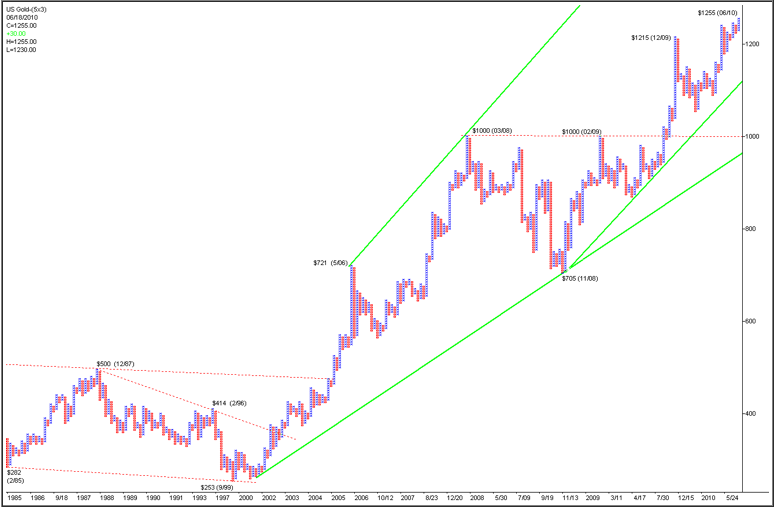
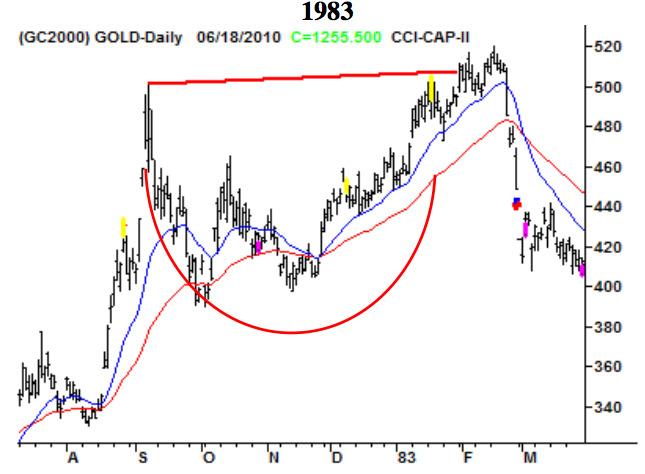
Click on Banner or HERE for larger view of this Chart from 1985
It’s been my opinion that gold has been in the “mother” of all secular bull markets and before it’s all said and done, it can have a 2 handle in its price ($2,000+).
While we have had in the past (and can expect more in the future) some short buy sharp corrections, I continue to remain firmly in the bullish camp for three key factors:
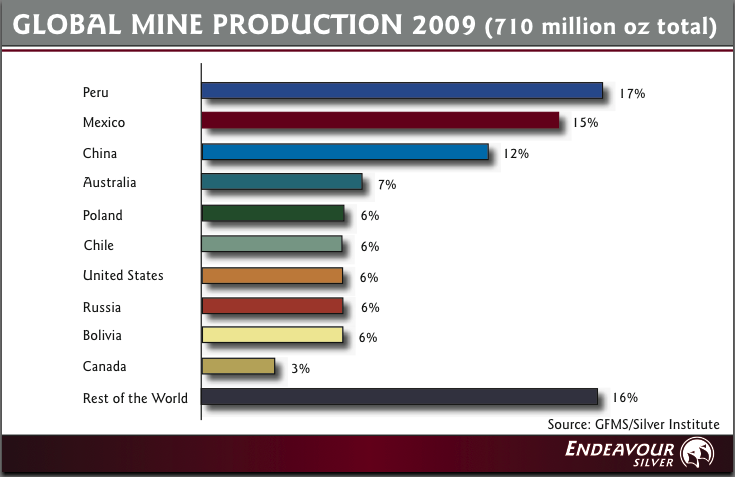
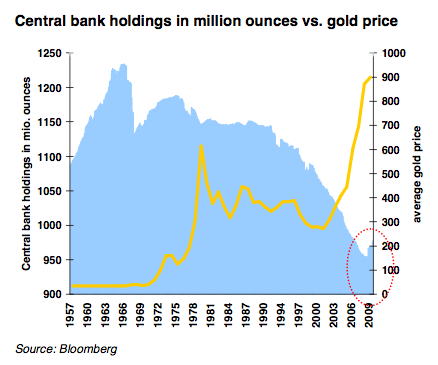
The biggest single holders of gold, Central Banks, have gone from major net sellers to either net neutral or net buyers.
Gold producers, who IMHO once cut off their noses to spite their faces by selling forward large quantities of future production, have come to realize hedging is a “four letter word” among their shareholders and potential investors.
Gold has rightfully taken its place as the only real currency by rising and setting records in most major currencies (this feat was not to be if one had listened to one of the most notorious gold perma-bears).
There are numerous other bullish factors including growing geopolitical concerns worldwide, but in my opinion, the above three are the driving forces. Until such time one or more of these factors change, I don’t see any major top possible.
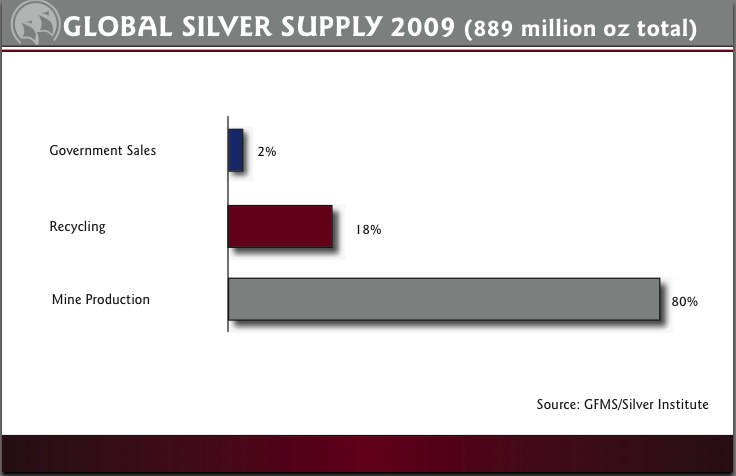
Silver, the poor man’s gold, should mainly play second fiddle to gold, but nevertheless should more than just tag along for the ride. I have for quite some time suggested being seriously over weighted in precious metals over base metals, but metals overall continue to be the primary place I suggest one look for long-term capital gains.
Yes, the easy money has been made but the fat lady hasn’t even gotten in the limo yet, let alone arrived in the building and is ready to sing.
Peter Grandich is the founder of Grandich.com and Grandich Publications, LLC, and is editor of The Grandich Letter which was first published in 1984. On his internationally followed blog he comments daily about the world’s economies and financial markets and posts his views on social and political topics. The result is an insightful and intuitive look at business, finances and the world, set in a vernacular that just about anyone can understand.
On Major Moves, Peter Grandich has been very right and not only saved many investors fortunes, but expanded them dramatically. On November 3, 2007 at the MoneyTalks Survival Conference, Peter Grandich of the Grandich Letter warned that “an unprecedented economic tsunami will hit American beginning in 2008”. Peter advised publicly to short the US market two days from the top in October, 2007 and stayed short until the last week of October, 2008. He began to buy stocks in March 7th, 2009. He also bought oil and oil related investments near the lows after the dive from $147.
….go to visit Peter’s Website
To HERE Peter speak and others speak on Trading go HERE:

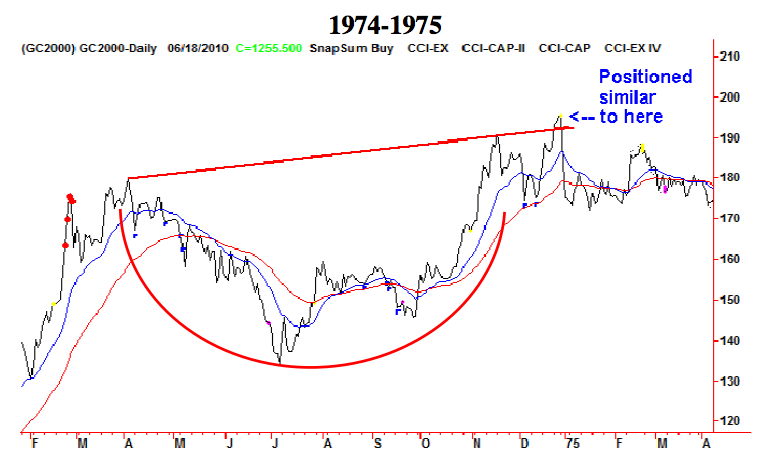
The March 2004 issue of The Elliott Wave Theorist postulated a 7-year crisis cycle going back to 1973 and used it to predict another crisis in 2008. Here are the table and the forecast from that issue:
—1973: Arab oil embargo, with spillover into 1974 stock market low of wave IV.
—1980: peak in the inflation rate; top in gold, silver and mining stocks, interest rate spike, stock-market “massacre” and low of wave 2 (circle).
—1987: stock market crash and low of wave 4 (circle).
—1994: “Republican Revolution;” suspicion of government due to Waco attack (1993), “black helicopters,” etc.; stock market breaks uptrend line at low.
—2001: successful terrorist attack on the World Trade Center; low of wave (3) of 1 (circle) [actually 3 (circle) of a].
Seven years after 2001 is 2008, so that is the next year to look for an extreme in social fear.
There was certainly a crisis and plenty of social fear in 2008, so this cycle performed as it should have. This rhythm prompted me to wonder if there might be a 7-year cycle in the stock market that would explain the regular appearance of these crises.
THE OUTLOOK FROM TIME CYCLES
Cycles can be quite useful for a time.
For some time, I had tracked a 3.3-year cycle, which was distinct from 1978 to 1997 and then disappeared. The venerable 4-year cycle was distinct from 1962 to 2002. There was a minor pullback into late 2006, and if the 4-year cycle were still operating, its next low would be due in late 2010. This is one reason why I expected a sharp rally off the 2009 low and then a crash. This rally has been sharp, but it has gone on too long to fit into a four-year cycle profile, so we have to treat the 4-year cycle as also gone. This outcome prompted me to go back to the charts to see if there have been any consistently reliable cycles since the beginning of Cycle wave V to now. I think I have found something very interesting.
The 7.25-Year Stock Market Cycle
I do not recall anyone talking about 7-year cycles in stock prices. I’ve heard about 3-, 4-, 6-, 8-, 9-, 10-, 11-, 12-year cycles and longer but not a 5- or 7-year cycle. As it turns out, seven years has been the most important cycle duration since Cycle wave V began. It marks the lows of 1980, 1987, 1994, 2001/2 and 2009.
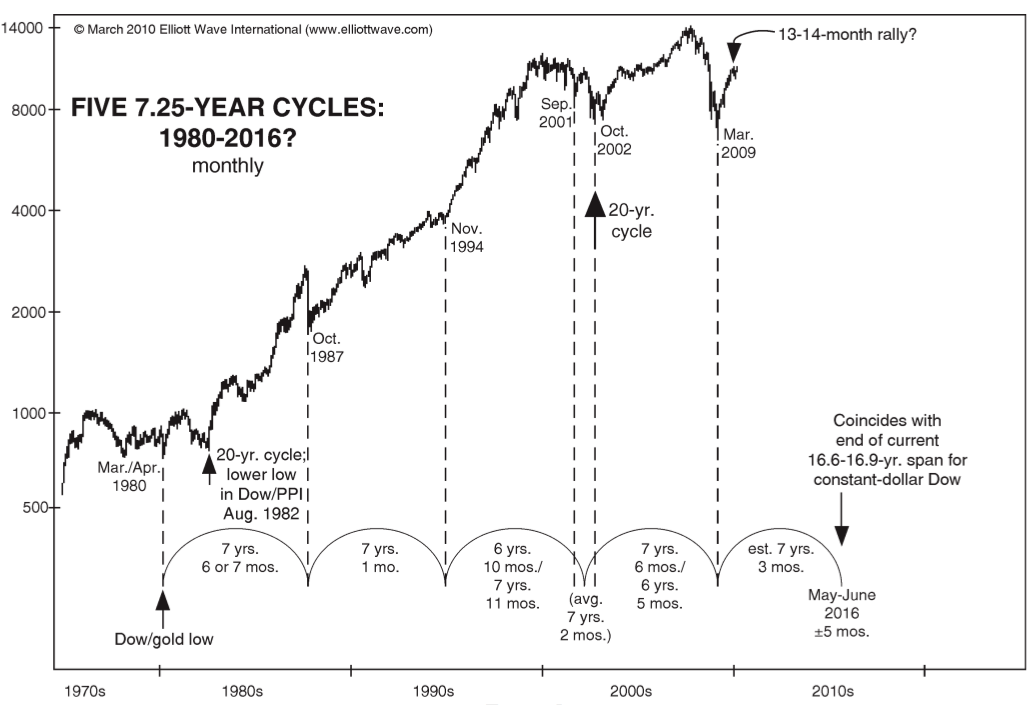
The average length of this cycle is very close to 7 years, 3 months. The next major bear market bottom is thereby due 7 years 3 months after the March 2009 low, i.e. in June 2016.
Ed Note: This commentary on cycles came from a 10 page Forecast titled published in April 2010 in which explains in detail Robert Prechter’s Market Forecast.

(June 22, 2010) The FOMC meets (yesterday) to discuss their record-low interest rate policy. The announcement of their decision will be released on Wednesday. While no increase in interest rates is expected, there is little doubt amongst investors that the future direction for the central bank’s target rate will be up. In fact, Kansas City Fed President Thomas Hoenig has repeatedly expressed his desire for an increase in overnight lending rates to 1 percent from the current zero-0.25 percent range by the end of summer.
However, recent economic data including; the Philly Fed Index, first time jobless claims, Non-farm payrolls and retail sales are already pointing to a probable double-dip recession. Therefore, the Fed’s next move is more likely an ease rather than a tightening of rates.
But the ease won’t come in any of the traditional forms. The Fed isn’t going to reduce rates to a negative level. Charging people to deposit their money into a bank just isn’t going to be politically palatable. Our central bank will also not seek to once again dramatically increase the size of the Fed’s balance sheet. Although the Fed bought another $7.34 billion in Mortgage Backed Securities last week, even Mr. Bernanke won’t be foolish enough to buy up another $1.5 trillion of assets that he will not be able to dispose of in the future.
The next ease from the Fed will most likely be in the form of ceasing to pay interest on excess reserves. Since October 2008, the Fed has been paying interest on commercial bank deposits held at the central bank. But because of Bernanke’s fears of deflation, he will do whatever it takes to get the money supply to increase. With rates being near zero and the Fed’s balance sheet already at an intractable level, the only viable solution to fight Ben’s phantom deflation fear is for him to remove the impetus on the part of banks to keep their excess reserves laying fallow at the Fed. If commercial banks stop being paid to keep their money dormant, they will find a way to get money out the door. They may even start shoving loans out through the drive-up window. Banks need to make money on their deposits (liabilities). If the don’t get paid by the Fed, they will be forced to take a chance on the consumer. After all, it has been made clear to them that the Fed and Treasury stand ready to bail out banks’ bad assets at any cost. So why not take the chance once again?
The statement from this month’s meeting of the FOMC will probably not indicate that interest will no longer be paid on deposits by the Fed to commercial banks. However, in the near future this strategy will be the most appealing method for the Fed to increase liquidity. Once Mr. Bernanke assents to the double-dip recession scenario, he will fight deflation by any means necessary.
Deflation is not a possible outcome if a central bank is willing to do whatever it takes to increase the money supply. The fed can buy every house on the market if it so desired and it could buy every dollar of our $13 trillion national debt. And while it is true Bernanke can’t force banks to lend, he can compel them to boost the money supply by removing any compensation involved from keeping the money multiplier in check. And even if there was no banking system or fractional reserve system in place, it would be a specious argument to make that inflation could not occur without having private banks involved.
According to Bernanke’s academic philosophy, expanding the money supply somehow equates to growing the economy. In order to grow the economy credit must be available, but much more importantly interest rates and the value of the dollar must be stable.
The current Federal Reserve Chairman is a student of the Great Depression. Although he will, unfortunately, most likely get a chance to study one first hand, this next one will be marked by inflation rather than deflation. Investors should be aware he will do whatever it takes to avoid a collapse of the money supply and a double dip in the economy. Part of his plan is to ensure there is not only plenty of money printedùthat much he has already accomplished in spades–but that banks are also well incentivized to loan it out.
June 22, 2010
Michael Pento
Delta Global Advisors, Inc.
19051 Goldenwest, #106-116, Huntington Beach, California
800-485-1225
www.deltaga.com
-
I know Mike is a very solid investor and respect his opinions very much. So if he says pay attention to this or that - I will.
~ Dale G.
-
I've started managing my own investments so view Michael's site as a one-stop shop from which to get information and perspectives.
~ Dave E.
-
Michael offers easy reading, honest, common sense information that anyone can use in a practical manner.
~ der_al.
-
A sane voice in a scrambled investment world.
~ Ed R.
Inside Edge Pro Contributors

Greg Weldon

Josef Schachter

Tyler Bollhorn

Ryan Irvine

Paul Beattie

Martin Straith

Patrick Ceresna

Mark Leibovit

James Thorne

Victor Adair