
Daily Updates
1. THE YUAN
We awake this morning to a new world. The Yuan has gone bid. Last week, in fact over the weekend, the Chinese quietly informed the U.S. and then the world that they would decouple the Yuan from its long-held US dollar moorings and allow it to trade within a “band.” As I write the Yuan has appreciated .4%. This may of course be a one–off. China has been under pressure from the U.S. Congress and the Europeans to meet an end of June deadline to decouple the Yuan…..
2. GOLD OR SILVER
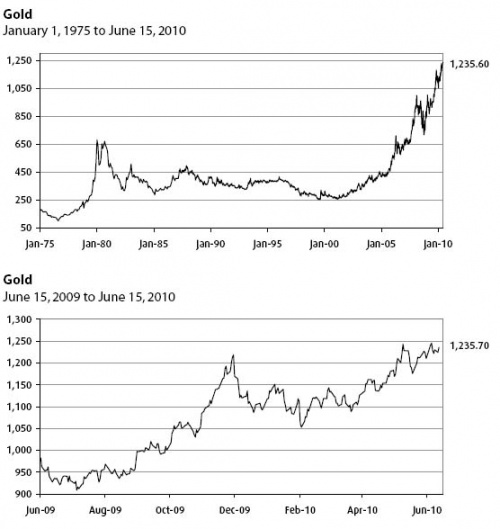
At this point gold has simply run away from silver. The gold to silver ratio is almost completely out of whack at 65.4 times. This is a sign that gold is now viewed as safe-store asset. In Greece gold is trading at U.S. $1700. We keep thinking that gold needs a correction. The following chart really doesn’t look much like a parabolic move in gold, does it? Gold will correct at some point because no “tree grows to the sky.”…..
….read “We awake this morning to a new world” + Gold vs Silver HERE
Market Buzz – Markets Range-Bound in Minimal Growth Environment – Seek Stable Growth
On Friday for first time in more than a month, Toronto’s main index saw action above the 12,000, peaking at 12,017.92 late in the morning. Late in the session and on the heels of six-straight days of gains, the TSX turned mildly negative and closed down 18.38 points, or 0.15 per cent, to 11,927.59. A positive Friday session would have made it the second-longest run of the year.
Gold was the story of the week, as the little yellow metal hit a new record on Friday as investors sought a safe haven outside of heavily indebted governments. Spot gold hit a high of $1,260.20 an ounce U.S. compared with $1,243.40 U.S. late on Thursday. The rise in the gold price helped buoy gold mining stocks on the Toronto Stock Exchange.
In the U.S., the Dow Jones industrial average ended the day slightly up, but posted its best two weeks since November.
The Dow’s modest Friday gains capped a surge of 5.2 per cent over the past two weeks, putting the average nearly halfway back to the high for the year that it reached on April 26.
U.S. equities had a longer winning streak earlier this year, an eight-week stretch that ended in late April, but those gains were more gradual. A sharp drop in May and early June brought the Dow down as much as 12.4 per cent below its 2010 high, a decline that most analysts call a “correction” (market decline of between 10-20 per cent).
The debate becomes whether that correction phase is over. The Dow has gained back 6.5 per cent from its lowest close of the year on June 7, but it’s still down 6.7 per cent from its 2010 high.
From our perspective, the gains (and declines) we have seen of late are typically of the type of uncertain and highly jittery market conditions we find ourselves in at present and is the type of action that will not likely abate in the near term. Both the bulls and bears have decent arguments for the markets next move, but until one out muscles the other, we will continue with a rather directionless market. In the end, valuations may just be fair on a broad basis at present and the current consolidation is a product of that conclusion. This type of consolidation, in a minimal growth environment, is something we have foreseen seen this past fall.
In times of uncertainty, it is great to get paid while you wait. Along those lines, this past week, one of our long-term favourites for stable growth in our Small-Cap Coverage Universe (www.keystocks.com), K-Bro Linen Income Fund (KBL.UN:TSX) declared its regular monthly cash distribution of 9.167 cents per unit for the period from June 1, 2010, to June 30, 2010, to be paid on July 15, 2010, to holders of record of units on June 30, 2010.
K-Bro Linen also recently announced that the fund’s operating subsidiary has signed 10-year contracts with Vancouver Coastal Health Authority, Fraser Health Authority, Provincial Health Services Authority, and Providence Health Care Society as a result of K-Bro being a successful proponent under a competitive request for proposal processes that begun last December. Service for the majority of the new volume is expected to commence in November 2010. The contracts are renewable for a further five years at the customer’s option. Certain existing contracts with VCH and FH were extended to November 2015, as part of this process.
Looniversity – Understand Your Tolerance for Risk
In the wonderful world of investing, there is a direct relationship between expected returns and risk – the higher the expected payback from your investment, the higher the risk. Before you can decide on a personal investment strategy, you must consider how much or how little risk you are prepared to take with your hard earned dollars.
Your risk tolerance can be affected by:
Time horizons
The amount of time you have to meet your financial goals and to make up for any losses you might experience. People with long-term horizons may be more willing to endure periodic fluctuations in the value of their investments.
Cash requirements
The extent you depend on your investments to meet daily expenses. Investors who rely on their investments to meet daily living expenses will be much less comfortable with the risk of losses.
Emotional factors
Your emotional response to risk and to changes in the value of your investments. Some people are quite comfortable with the ups and downs of the market, while others find it difficult to sleep at night when their investments fluctuate in value.
There is no ‘right’ answer to the question “How much risk should I take?” Risk tolerance is a personal issue. You should never feel obliged or pressured to take more investment risk than you are comfortable with. Remember, though, that there is no such thing as a high-return, risk-free investment. You cannot expect to be rewarded with high returns on your investments if you are not prepared to accept the risks that go with them.
Put it to Us?
Q. What is a company’s “current ratio”?
– Harry Miller, Toronto, Ontario
A. The current ratio compares all of a company’s current assets to its current liabilities. In the financial world, the term “current” means less than one year. So, current assets include cash, accounts receivable, inventory, prepaid expenses, and other assets that can be converted to cash within one year. Current liabilities include short-term debt, interest, accounts payable, and any other outstanding liabilities that are due within a year’s time.
When calculating this ratio, you are essentially trying to determine whether a company can meet its short-term obligations. It will likely be able to do so if the ratio is above 1; if the ratio is less than 1, the company may fall short, so some alarm bells are raised. For industries that generally have a large portion of current assets tied up in inventory, a ratio of 1.5 (or even 2) might be a better standard. When analyzing the current ratio, as when looking at any ratio, an investor should make comparisons between companies that operate in the same industry. Different industries have different dynamics and cross comparisons can be somewhat meaningless.
KeyStone’s Latest Reports Section
-
- Under Appreciated Cash Rich Gold Producer Transitions from a Single to Multi-Mine Producer of Gold & Copper – Continue Buy Rating (Flash Update)
- IP Company’s Q4 EPS Exceed Expectations, Solid Fundamentals, Strong Cash Position & Yields 4.6% – Near-term Rating Upgrade (Flash Update)
- Western Based Financial Service Provider Posts Solid Start to 2010 – Near Term HOLD (Flash Update)
- Pure Play Chinese Construction Company Reports Strong Q3 2010, Solid Backlog, PE of under 6, Yet Shares Drop? – Update Rating (Flash Update)
- Canadian Rare Earth & Magnetic Powder Processor Posts Strong Q1 from Pent-up Demand, Cash Rich ($0.55 per share), Strong EPS Growth Long term (New Buy Report)
Stockscores.com Perspectives for the week ending June 20, 2010
Why Not to Take a Trade
In this week’s issue:
Weekly Commentary
Strategy of the Week
Stocks That Meet The Featured Strategy
![]()
As investors, our natural inclination is to seek out stocks that have good qualities. We look for reasons to buy the stocks we are considering and often forget to look for the negatives. Since there are thousands of stocks to consider and almost all of them can have some reason for buying them, it may be better to reverse how we approach the analysis of stocks. Looking for reasons not to buy a stock will emphasize a higher standard for the stocks you do buy and will help to improve your overall market performance.
Here is a list of common reasons I use to throw a stock out of consideration:
Too Much Volatility
Volatility is uncertainty. Virtually every good chart pattern that I use to find winners demonstrates a break out from low volatility. The narrower the range before the breakout, the more important the breakout becomes. If the stock’s price is moving all over the place before it makes a break through resistance then there is a much greater chance that the breakout is false and will likely fall back. Ignore stocks that have a lot of price volatility before the break out.
Not Enough Reward for the Risk
A stock can go two ways, up or down, after you buy it. If the upside potential is not enough to justify the downside risk, then you should ignore the opportunity. I like stocks to have at least double the upside potential for the downside risk. That way, you don’t have to be right even half of the time to make money, provided you are disciplined of course.
Lack of Optimism
Fundamentals do not matter. It is the perception of Fundamentals that matter. If investors are not showing some optimism about a company’s prospects then it is likely that they are not paying any attention to the company’s fundamentals. Look for rising bottoms on the chart as an indication that investors are optimistic, if there aren’t any, leave the stock alone.
No Abnormal Behavior
The stock market is efficient most of the time. That means that you can not expect to consistently beat the stock market because all available information is priced in to the stock and your success at predicting new information can only be random. To beat the market, we have to look for break downs in market efficiency. I find that the best way to do this is look for abnormal behavior in the trading of a stock because it implies that there is significant new information playing a role in the stock’s performance. I don’t consider any stock that lacks abnormal behavior in its recent trading.
Too Far Up
The higher a stock goes, the riskier it becomes. I don’t like to chase stocks higher. If I look at a 6 month chart of a stock and it has made more than two steps up, I don’t consider it. A one day run of substantial gains is not a concern; I want to ignore stocks that have been in upward trends for some time. Look for stocks that are breaking from periods of sideways trading, not up trends.
Lack of Liquidity
The more often a stock trades, the easier it is to get in and out of it. Stocks that are not actively traded tend to have wider spreads between their bids and asks and it can be difficult to move in and out of the stock. Don’t consider stocks that don’t trade every day and they should trade at least 100 times a day but more is better.
Mixed Messages
I always try to look at a stock’s chart on more than one time frame. If the message is not the same on both charts, I leave them alone. When day trading, look at the daily and intraday charts. When position trading, look at the daily and weekly charts.
Any time you think a stock has great potential, give this list a look and see if any of these factors show up. If so, it may be a good idea to move on and look for something else.
….Strategy of the Week Featured below…..
- Get the StockSchool Pro Free

Open and Fund a brokerage account with DisnatDirect and receive the StockSchool Pro home study course free, including special Pro level access through the DisnatDirect client website. Offer only available to Canadian residents. For information, click HERE
![]()
The Canadian market appears to be one of the strongest globally, so this week I focused my Market Scan on Canada using the Stockscores Simple Strategy. Strength in the Canadian dollar and Gold has some of the commodity based stocks looking good, here are two to consider for swing trades next week.
![]()
1. T.TNX
Over the eight months, T.TNX has been in a good upward trend. However, for the past six weeks, the stock has been working through a pull back to the upward trend line. On Friday, the stock broke to the upside and through the resistance formed by the pull back. It looks like this stock should now continue its upward trend.

2. T.GSC
T.GSC broke to the upside on Friday from a falling wedge pattern, it now looks like this stock will continue its long term upward trend. Support at $4.05.

References
Get the Stockscore on any of over 20,000 North American stocks.
Background on the theories used by Stockscores.
Strategies that can help you find new opportunities.
Scan the market using extensive filter criteria.
Build a portfolio of stocks and view a slide show of their charts.
See which sectors are leading the market, and their components.
Click HERE for the Speaker Lineup and to Purchase the video if you want to learn from some of the worlds best traders including Tyler Bollhorn.

Tyler Bollhorn started trading the stock market with $3,000 in capital, some borrowed from his credit card, when he was just 19 years old. As he worked through the Business program at the University of Calgary, he constantly followed the market and traded stocks. Upon graduation, he could not shake his addiction to the market, and so he continued to trade and study the market by day, while working as a DJ at night. From his 600 square foot basement suite that he shared with his brother, Mr. Bollhorn pursued his dream of making his living buying and selling stocks.
Slowly, he began to learn how the market works, and more importantly, how to consistently make money from it. He realized that the stock market is not fair, and that a small group of people make most of the money while the general public suffers. Eventually, he found some of the key ingredients to success, and turned $30,000 in to half a million dollars in only 3 months. His career as a stock trader had finally flourished.
Much of Mr Bollhorn’s work was pioneering, so he had to create his own tools to identify opportunities. With a vision of making the research process simpler and more effective, he created the Stockscores Approach to trading, and partnered with Stockgroup in the creation of the Stockscores.com web site. He found that he enjoyed teaching others how the market works almost as much as trading it, and he has since taught hundreds of traders how to apply the Stockscores Approach to the market.
Disclaimer
This is not an investment advisory, and should not be used to make investment decisions. Information in Stockscores Perspectives is often opinionated and should be considered for information purposes only. No stock exchange anywhere has approved or disapproved of the information contained herein. There is no express or implied solicitation to buy or sell securities. The writers and editors of Perspectives may have positions in the stocks discussed above and may trade in the stocks mentioned. Don’t consider buying or selling any stock without conducting your own due diligence.
The Oldest-Established Store of Value Moves to Center Stage
Who needs gold?
Over the decade that we have been advocating exposure to gold and gold mining stocks, we have been routinely subjected to basic skepticism: why gold? Isn’t it irrelevant?
If the yen looks bad, I can buy the euro.
Besides, what good is gold? Other commodities are useful and, in most cases, absolutely necessary.
But gold hasn’t been needed for central banking for nearly a century, and, apart from jewelry or for providing Mafiosi with a convenient vehicle for storing their wealth, it doesn’t fulfill any purpose that sound paper money can’t do better. (This, of course, assumes the availability of sound paper money.)
In answering a question about gold’s rather dramatic return to store of value status with the portfolio managers of one of Canada’s largest public sector pension plans, we took a new tack:
“The longest-established text-based religion in the West is about the God of Jacob—His works and His worship. For roughly five thousand years, a believer summed up his credo by saying, ‘I believe in God.’
“But when this credo arrived, it had to share space with an alternative belief system that was around for thousands of years before the Judaeo-Christian era began. A believer in this system summed it up, ‘I believe in Gold.’”
Two systems—similar professions of faith. Neither could prove to a skeptical rationalist why its tenet was valid.
As we have thought about this space-sharing and competition between spiritual and temporal beliefs, we have mused that large-scale skepticism about both of them occurred only recently. Darwinism, paleontology, and astrophysics combined to drive the Old Testament explanation of history out of the temples of scientific learning. Keynesianism came along to drive gold from the temples of the central bank money-changers in favor of the printed paper promises of politicians.
Why is gold back among serious, respectable investors?
Why is it now available through ATMs in the gold market of Abu Dhabi?
Is it a return of inflation?
How could that be, when, as the wise David Rosenberg routinely scoffs, “What inflation?”
Indeed, Canada reported its first negative CPI in 44 years, the US, its biggest decline in 18 months, and across the OECD there is, (at least for now), more fear of deflation than inflation. Despite astonishingly high housing subsidies that are swelling the already-bloated US national debt, US home prices remain soft, and foreclosure is not only no longer a disgrace—it threatens to become almost chic. (A recent poll of homeowners disclosed that 55% of those with mortgaged homes believed their house was worth less than their mortgage.) Not all the news is bad: The cost of TARP has turned out to be far less than feared: the cost of saving the US from house price collapses on a scale that would unleash a Depression—including the mind-boggling costs for keeping
Fannie, Freddie and the Federal Home Loan Bank alive and lending, and the various cash subsidies to buyers—is many orders of magnitude above the Wall Street bailouts.
If the only thing keeping house prices from collapse is a boost in the national debt bigger than the total cost of all the US’s foreign wars since World War II, then how can inflation be a threat?
Yes, some industrial and food commodity prices have shown some inflationary tendencies, but, with the exception of coffee, cocoa, iron ore and metallurgical coal, prices have been sagging recently—although remaining far above Lehman lows.
Interest rates remain in the zero range, which would be a sure sign of inflation on the horizon if there were projected increases for anything significant other than wages and benefits for government employees.
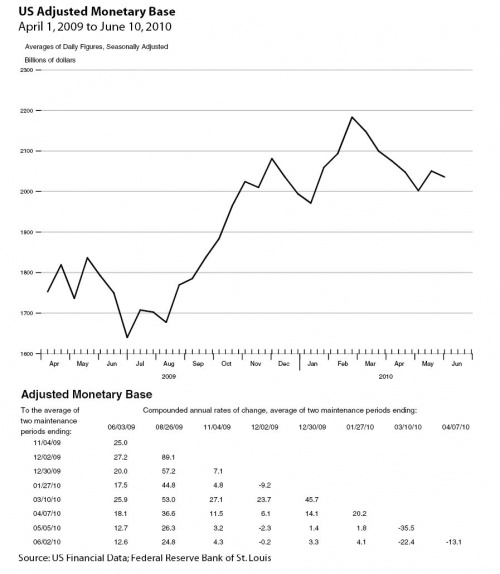
Although the Fed’s response to the Crash was the greatest goosing of its asset base in history, raising fears among the putatively paranoid that a new Weimar was being born, in recent months the Fed seems dedicated to proving that its previous promises of piety were sincere. Based solely on the numbers, Bernanke almost seems to be willing to risk outright deflation:
So what makes gold so attractive now?
And who is buying it.
…..read more Gold – The Oldest-Established Store of Value Moves to Center Stage
Summer is here. The markets are still undecided on whether to climb
Equedia is a strong performing investment newsletter network and a social network aimed at the financial community, with many advanced social networking features. The equedia platform caters to companies who want to communicate with stakeholders via video content, as well as through blogs, shared calendars, and other features.
In addition, we have a strong following through our Equedia Weekly Investment Newsletter aimed at mining and resource stocks with a strong focus on the top Canadian stocks in the industry. Our newsletter features investment ideas and content from our strong performing and respected partners including N. America’s leading analysts and investment personalities.
Equedia is also a community site for media, analysts and investors, who can participate with various online publishing and rating features. Equedia also boasts a best-of-breed video transcoding and streaming architecture, and has a growing and loyal user base.
The new world of finance through Equedia’s web portal is no longer a one way street. It’s about connecting information across social networks, the people looking for it, as well as the conversations that connect them. Equedia helps the investment community by giving it a single resource that provides them with everything they need – an informative social media experience dedicated to the investment community.
, fall, or sit still. So while the market takes its vacation, both gold and silver haven’t taken a break. Gold is now on a nine-week win streak and silver is up over $19.
If prices continue to hold at these levels for another year, many of us who are invested in precious metals miners and explorers may finally reap the rewards we were looking for.
The prices of gold and silver have yet to translate into a fair share price increase for many of the precious metals juniors – including our recent investments into Minco Silver (TSX: MSV) and United Mining Group (CNSX: UMG).
Neither Minco Silver or United Mining Group are producing – but both are very close.
Minco Silver has delineated over 158 Moz of silver, which at today’s prices are worth over $3 billion. Their 2009 feasibility show reserves of 55 Moz, using only $13.57/oz silver – add another $5 to that number and those reserves alone are worth another $275M in revenue. The Company currently has a market cap of $130M – but it was just $110M when our Special Edition Report on Minco was released last week (see The Brink of Milestone) and shares prices of Minco Silver shares were trading at $2.56 (June 11, 2010). Minco Silver is currently trading at $3.05, nearing Raymond James’ target price of $3.35. (see The Brink of Milestone)
United Mining Group currently has a market cap of under $31 million, but had revenues nearing $16 million last year, and a 10Moz silver resource scheduled to go into production within a year. Not only that, their Crescent Mine project sits between two of the world’s largest-ever silver mines and is a potential takeover target given its untapped resource and location. They also have over $6 million in the bank and is fully permitted and financed to go into production. The math is pretty simple – they are extremely undervalued when stacked against comparable companies. (see The Secret Battle)
The biggest difference in valuating juniors is how close they are to actually producing. Having ounces in the ground is one thing, but to actually get it out is a different story. Minco Silver is as close as ever to becoming the largest pure silver play in China. United Mining Group is fully permitted and financed to go into production in less than a year, in one of the largest silver districts in the world.
We’re sure many of you who have invested in precious metals juniors may be scratching your head at the current valuation of your investments based on resource in the ground. The average consensus by institutions is around $80-90 of market valuation for every ounce a gold company has in the ground, but we have seen companies with over 3Moz of gold valued at less than $20 million.
Look at United Mining Group – its trading with the same market cap as its own 2011 projected revenues.
Mining Takes Time – But It’s Worth Every Penny
We have to remember that mining is a time intensive process and look at share prices the same way. The juniors are lagging the rise in precious metals for one major reason: fear.
When the market crashed, many junior explorers were forced to raise money at significantly discounted prices. They issued millions of shares and warrants far below market value and we’re still seeing some of that overhang in the markets.
The economic problems that are driving gold and silver prices will affect the junior markets. The problem lies in the fact that investors fearful of the market implications of a Euro collapse due to Greece will retreat to areas of safety such as gold and the U.S. dollar, leaving the market for capital bone-dry.
There is a very real possibility that risk aversion will outweigh any positive sentiments from a rise in gold prices, putting junior companies with exposure to precious metals under significant downside pressure.
Strike While the Irons Hot
Right now, retail traders have an advantage: risk.
Institutions are still weary of the markets and there hasn’t been a propensity by the larger institutional funds to buy into the resource sector yet. Institutions have a lot less room for errors and thus, have to mitigate their risks. This gives retail investors the advantage to enter into the resource markets before the institutions.
When things settle down and precious metals stay above current prices, perhaps a year from now, these institutional investors will return to the Venture Exchange. When they do, look out. All of that patience could be rewarded and we could see the Venture exchange above 4000.
Right now, the summer has arrived early for traders and we`re starting to see thinner trades and lighter volumes – including that of gold, which is rising despite very low average volumes. If you can stomach investing during the summer, it can be a great time to pick up some cheap shares of juniors.
For now, we continue to look toward companies such as Minco Silver and United Mining Group. They both have lots of cash in the bank to survive a downturn in the markets, and both are near term producers.
Keep your eyes on the juniors during the summer – there will always be garage sales with bargain prices on a nice sunny day.
-
I know Mike is a very solid investor and respect his opinions very much. So if he says pay attention to this or that - I will.
~ Dale G.
-
I've started managing my own investments so view Michael's site as a one-stop shop from which to get information and perspectives.
~ Dave E.
-
Michael offers easy reading, honest, common sense information that anyone can use in a practical manner.
~ der_al.
-
A sane voice in a scrambled investment world.
~ Ed R.
Inside Edge Pro Contributors

Greg Weldon

Josef Schachter

Tyler Bollhorn

Ryan Irvine

Paul Beattie

Martin Straith

Patrick Ceresna

Mark Leibovit

James Thorne

Victor Adair