Stocks & Equities

3D – The Next Trillion Dollar Industry Set To Transform The World Overnight

The U.S. military sees it as the key to future victories.

NASA thinks it’s the key to reducing space exploration costs.

And universities in several states believe it could end the suffering caused by the world’s most terrible diseases.

Boeing’s bought one. So has Rolls-Royce. And every new company that buys one drives another nail into the Chinese manufacturing coffin.

It’s a homegrown technology many say could be bigger than the Internet.

Business Insider is convinced it’s the next “trillion-dollar industry”…

It’s rare that a truly new technology comes along, promising to revolutionise the world. Just as the printing press and spinning jenny empowered cottage industries with the ability to spread knowledge and manufacture goods, 3D printers promise to enable a next-generation industrial revolution of home-made and customised products.

And not in 25 or 50 years’ time…

This is happening now.

The industry — and the stocks behind it — will literally grow thousands of percentage points over the next few years.

When you see it for yourself, you can’t help but understand why…

In no time at all, this technology could cause the collapse of millions of Chinese manufacturing jobs and send them back to America.

But it’s only going to happen once. And you’ll never see anything like it again.

That’s why I personally oversaw the creation of sensational new video showing you exactly how it works and how to profit from it.

3d-click-to-play-2

Call it like you see it,

Nick Hodge Signature

Nick Hodge
Editor, Early Advantage


Initial Sell Signal Approaches

All of a sudden volatility has come back. Over the last several weeks we have seen sharp one day selloffs that has sent the media into an absolute frenzy followed by large surges the next day with the media telling you now is the time to jump in. For the average investor it has been more than just a little confusing as to what should be done with portfolios.

Just A Pullback For Now

It is sometimes very confusing for investors to discern what they should be doing because of the day to day noise from the media. As I stated above; the media attributes whatever is happening during a particular trading session to the news item of the moment – whether it is relevant or not.

This presents a real difficulty for investors to navigate the management of their portfolio – which is why most individuals simply don’t. This is why we encourage you to step back from the day to day “noise” to see the bigger picture. It is much like art – take a look at a very famous work of art below.

Screen shot 2013-06-17 at 6.54.07 PM

When you stand too close to the painting you lose perspective, detail and the connectivity of the overall painting. However, if you step back you see Claude Monet’s “Sunrise.”

Screen shot 2013-06-17 at 6.54.17 PM

This is the primary problem for fundamental investors. The focus on financial ratios, historical comparisons and valuations keeps analysts, and portfolio managers, standing too close to the market. This is why they consistently miss the detail and connectivity of the overall environment.

This is also the same problem that individuals face daily when reading the latest headlines or listening to the financial media. Daily headlines rarely have anything to do with market action in the short term. However, each day, we are inundated with the details of some economic, or corporate, report that is responsible for moving the entire market. Even though this is absolutely not the case; individuals, and professionals, continue to stand too close to the painting and miss the broader detail.

Take a look at the chart below.

…..read the whole 17 page report HERE


Rest assured, a major tipping point is coming soon

Ruhland Andrew - compressed tie horzThere are certain times – like now – when investment markets appear to be in a state of “suspended animation.” And it’s extreme times like these when the disconnection of markets from common sense, logic and rational valuation puts our Patience and Discipline to the test in an almost overwhelming way. Rest assured, a major tipping point is coming soon, perhaps even before the next edition of this newsletter.

Since the equity markets hit their crisis bottom in early March 2009, many investors have been waiting for the second half of the global debt hurricane to hit. This bias, based on then-recent experience, makes it difficult for many to ride an uptrend with patience…after having been burned significantly by market declines that mainstream “experts” said were simply not possible. It’s also incredibly difficult to forget the emotional and financial pain caused by the 2008-9 financial crises.

This memory of fear and loss has caused many investors to be more cautious than they otherwise would have been. If one looks at rise in the U.S. or Japanese equity markets, frustration can rise pretty quickly…no one likes to “miss out” on gains after experiencing major declines.

This is especially true when U.S. markets continue grinding higher without even a normal 8-12% seasonal pullback. Japan’s markets have now corrected more than 20% from their May 22nd peaks, and the question many are asking is whether or not the U.S. and Europe will follows suit. Only time will tell.

For now, U.S. equity markets appear to have some more upside potential, based on pure momentum of the major uptrend, juiced by bullish rhetoric from the Wall Street mavens. There’s nothing rational, logical or fundamental about it. It’s just a trend in motion, which continues until it actually changes.

Experienced investors understand that the more that markets stretch to the upside beyond a sustainable level, the further and faster they drop. Anyone who has ever played with an elastic band understands this same concept – and the snap-back is always painful.

As surprising as this may sound, I actually expect that U.S. equity AND bond markets will yield average to above average returns over the next 25-27 months. This is not based on the excellent health of the U.S. economy, consumers, demographics or the sustainability of its massive personal and public over-spending. It’s based upon how much worse Europe and Japan are in these and other matters.

In all situations, it’s fundamentally about CAPITAL FLOWS. Investment capital always moves to where it perceives it will be treated best. Capital (money) is merely one form of energy, and when massive amounts of energy flow from one area to another, it causes massive changes in price. Departing capital leaves behind chaotic price declines. Arriving capital creates massive rises in prices. Think of how tides affect boats of differing quality and size.

This prediction of positive returns in U.S. based investments – including the $US – over the next couple years does not mean we’ve seen the end of market volatility because we’ve returned to “normal times” again. On the contrary, these massive shifts in institutional investment capital will serve to significantly increase volatility for short periods. This volatility will scare away even more retail investors near bottoms, leaving the gains there for disciplined big-money investors, whom I refer to as “the elephants.” Always follow the elephants, but don’t try to anticipate their movements – one misstep can be disastrous.

If things play out as our research sources have predicted, we’ll first see European bond and stock markets roll over and tumble, causing short term shocks everywhere else. Perhaps this starts in early August, with rising resistance by German citizens in respect of supporting their less-disciplined Euro comrades? Angela Merkel tries for re-election on September 22, and European banks are woefully vulnerable to the potential write-downs of the European bonds which they hold as Tier 1 Capital.

In 2014, perhaps it will then be Japan’s turn to implode, triggering a financial tsunami of fleeing capital to U.S. markets? The Japanese government and central bankers are showing their desperation with extreme forms of Quantitative Easing/Currency Devaluation intended to re-inflate their flat-lined economy. Not surprisingly, they’ve created a bubble in their equity markets, with little effect on their real economy.

In the meantime, both Gold and Silver remain near their April 15th lows, with little upward strength. As this is written, we are rapidly approaching major cycle bottoms according to the work of several of our trusted research analysts. Will we hold support around the low-mid $1,300’s or will that support break and we see a test to lower levels such as $1285 (Charles Nenner) or even $1,158 (Martin Armstrong)? If precious metals do sell-off in a big way we’ll avoid that sector until it shows signs of massive panic and major capitulation. We’ll know within a few short weeks…simply “follow the elephants” with risk controls in place.

In the meantime, the U.S. government is now being revealed – not just suspected – of being an intrusive predator upon the privacy of its own citizens. Ironically, the U.S. security agencies are re-enforcing the fears that led their country’s Founding Fathers to create the Second Amendment – the right to keep and bear arms. The sophistication and pervasiveness of their surveillance is mind-boggling and frightening, and that’s just what we know about so far.

When Republicans, Democrats and the mainstream media ALL AGREE that this level of intrusion is justified in the name of “homeland security,” and actively engage in character assassination of whistleblowers like Edward Snowden…there is a BIG problem. Is it any wonder that sales of George Orwell’s classic “1984” have sky-rocketed recently?

And over in the Middle East, the “justification” for the U.S. getting more actively involved in Syria’s revolutionary conflict is building. Could a full-out war against the Assad regime and its allies Russia and Iran (the latter of which just sent in 4,000 troops to support Assad) be a convenient distraction from all the scandals plaguing the Obama Administration and the hollowing out of Main Street courtesy of Wall Street? Wars are never entered without careful calculation, but only when public support has been raised to necessary levels. In my opinion, this one is only a matter of time.

Everything unfolds with time, so we remain vigilant for both danger and opportunity. Patience and Discipline are accretive to your wealth, health and happiness; Fear and Greed are destructive.

Andrew Ruhland of Integrated Wealth Management in Calgary

The Bottom Line -Use Strength to Reduce Exposure

The intermediate corrective phase in North American equity markets remains intact. Short term strength provides an opportunity to reduce equity exposure, particularly in sectors that have a history of moving lower during a summer corrective phase. These sectors included industrials, consumer discretionary, materials and financials.

Selected sectors are setting up for seasonal trades this summer including fertilizers, energy and gold. They already are showing signs of outperformance relative to the S&P 500 Index and the TSX Composite Index. Stay tuned for special sector opportunities as the summer progresses.

Equity Trends

The S&P 500 Index fell 16.65 points (1.01%) last week. Trend remains up. Resistance is at its May 22nd high at 1,687.18. Support is at 1,598.23. The Index remains below its 20 day moving average, but bounced once again from near its 50 day moving average. Short term momentum indicators have declined to neutral levels.

clip image001 thumb10

The TSX Composite Index fell 185.94 points (1.50%) last week. Trend remains down. The Index remains below its 20 day moving average and completed a “Death Cross” when its 50 day moving average fell below its 200 day moving average. Tech Talk is not a believer in the Death Cross indicators, but other technical analysts are talking about it. Strength relative to the S&P 500 Index changed from neutral to negative. Technical score based on the above indicators changed from 0.5 to 0.0 out of 3.0. Short term momentum indicators are oversold, but have yet to show signs of bottoming.

clip image006 thumb10

Percent of S&P 500 stocks trading above their 50 day moving average fell last week to 59.60% from 67.80%. Percent remains in a downtrend from an intermediate overbought level.

clip image004 thumb9

Percent of S&P 500 stock trading above their 200 day moving average slipped last week to 88.20% from 90.60%. Percent remains in a downtrend from an intermediate overbought level.

clip image003 thumb10

Bullish Percent Index for S&P 500 stocks slipped last week to 81.20% from 82.00% and remained below its 15 day moving average. The Index continues to trend down from an intermediate overbought level.

clip image004 thumb9

Bullish Percent Index for TSX Composite stocks fell last week to 59.41% from 62.76% and dropped below its 15 day moving average. The Index has resumed an intermediate downtrend.

clip image005 thumb9

Percent of TSX stocks trading above their 50 day moving average fell last week to 31.80% after briefly reaching a low of 24.69%. Historic data shows that the TSX Composite Index frequently bottoms on a recovery by Percent from below the 25% level.

clip image007 thumb9

Percent of TSX stocks trading above their 200 day moving average fell last week to 42.68% from 46.86%. Percent continues in an intermediate downtrend.

clip image008 thumb7

……read so much more HERE including 44 more charts. 


Soros Joins Ballanger on the Goldbug Side of the Market

In his 36-year career, Michael Ballanger, director of wealth management at Richardson GMP, has seen good markets and bad. As a true contrarian, he sees opportunity in the undervalued precious metals assets and lauds George Soros’ recently reported large gold-related positions. In this interview with The Gold Report,Ballanger discusses market sentiment and some companies that he expects to take off when the market turns.

The Gold Report: A news story in mid-May reported that billionaire hedge fund manager George Soros had almost $240 million ($240M) in gold-related positions. Moreover, on May 16 he had purchased $25M in call options on the Market Vectors Junior Gold Miners ETF (GDXJ). What are your thoughts on that move?

sc

Michael Ballanger: All one needs to look at is the historical relationship between gold and gold shares to see the logic behind such a move. With every market on every continent now surging to record high levels in response to central bank stimuli, it would be reasonable to manage risk by owning one of the most beaten-down sectors I can ever recall.

TGR: Why does someone like Soros buy gold-related instruments and not equities, even the large caps?

MB: In the case of the GDXJ, he is actually buying a “basket” of equities related to gold/silver mining and exploration. By doing this, he spreads his risk over a large population of companies in the same space. Picking individual companies in this space invites execution risk because as we have seen in numerous cases in the past decade, a one-off event such as politics or natural disasters can undermine a correct call on the sector as a whole.

TGR: Are you aware of other big-time players that are making similar moves?

MB: Not specifically and certainly no one as notable as Mr. Soros. It is interesting that the managers who were early in the gold trade such as Eric Sprott are more bullish today than ever and that is noteworthy given gold’s performance since 2000; despite this current correction and in my view, it is a correction rather than a secular bear.

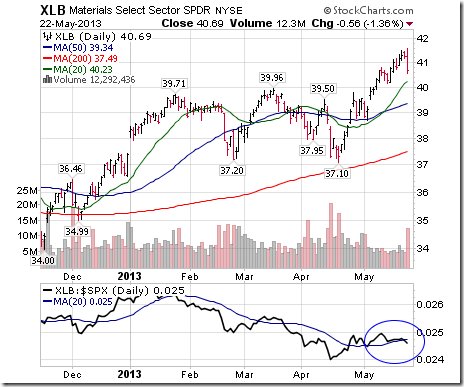
TGR: When last we spoke you were convinced the market had found a psychological bottom. You noted that at the end of 2012, the TSX Venture Exchange (TSX.V)—acting as a proxy for the junior mining sector—was trading at 0.71 times the gold price. As of May 31, it was 0.69 times the gold price. Do you see the TSX.V-gold price ratio moving further sideways for the foreseeable future?

sc-1

MB: I based my “bottom call” on sentiment. The sentiment in the junior space in January was abysmal and it is just as abysmal today. However, weak sentiment numbers, while historically reliable, do not tell you that the price has stopped declining. In that context, I was early because not only has the Venture Exchange dropped to new lows under 1,000, the TSX.V-gold ratio has recently hit .66 versus the bull market high over 5.0, which is actually quite remarkable.

TGR: What’s your thesis for investing in mining equities (large, mid and small cap)? Precious metals investors want to know what they should do over the course of the summer months. What’s your advice?

MB: There is always a degree of seasonality to the mining sector and the numbers dictate that one should wait until mid-August to begin initiating positions but I suspect that may be too “cute” because of the severity of the valuation compression we are witnessing in the juniors. Companies that were considered good value at $75/ounce (Measured) are now trading at under $20/ounce and so these prices may not wait for mid-August if gold decides to reverse or if sentiment shifts early back to the bull camp.

TGR: In our last interview you discussed “well incubated” junior mining companies, ones with a core of investors that understand how the game is played and have the long play in mind. Where are those companies?

MB: In a nutshell, some have done quite well but most have been disappointing. Despite either positive earnings reports or new discoveries, each time they try to lift off the bottom, they have been sold as a liquidity event. It is almost a Pavlovian reaction; they sell off because they have sold off in the past and until new volumes come in to relieve the supply that will not change until sentiment changes.

TGR: In January, you told our readers about Tinka Resources Ltd. (TK:TSX.V; TLD:FSE; TKRFF:OTCPK). What’s happening with Tinka now?

MB: Since the January interview, Tinka has continued to execute its corporate strategy of upgrading the Peruvian silver resource to Measured from Inferred while adding more ounces, but the big event was the recent A13-05 drill result, which was arguably one of the best massive sulphide intercepts in at least my time in this space. Sixty meters of 7.75% zinc with the total section of mineralized envelope running north of 200 meters is a very encouraging, if not spectacular, intercept. The company completed a financing in May (full disclosure: RichardsonGMP participated in that funding) and is now poised to recommence with further exploration on Ayawilca (the zinc) while finishing off the redefinition of Colquipucro (the silver). The share price has retrenched from the all-time high of $1.25 in March to the current $.75–.80 range.

TGR: Would you like to give any other updates on companies you’ve mentioned in previous interviews? At the moment, are there any other companies you’re closely following?

MB: Bitterroot Resources Ltd. (BTT:TSX.V) is another name in the unloved category. When I met its president, Michael Carr, he showed me the geophysics on his project in northern Michigan, just south of the White Pine mine. Within the exploration sector, this is a compelling story that speculators could sink their teeth into at $0.09 or $0.10/share. It is an exploration play so it may not be suitable for all investors but for those that can bear the risk, it is an interesting speculation.

MB: Another Peruvian junior I have been dabbling in is Darwin Resources Corp. (DAR:TSX.V). The company has a gold property in northern Peru, sandwiched by Rio Alto Mining Ltd. (RIO:TSX.V; RIO:BVL; RIOAF:OTCQX) and Barrick Gold Corp. (ABX:TSX; ABC:NYSE). Darwin trades around the $0.12 range on the TSX Venture Exchange. Darwin was a spinout of Mawson Resources Ltd. (MAW:TSX; MWSNF:OTCPK; MRY:FSE). Early geochemical results have been very interesting, to say the least.

TGR: Before we let you go, please give our readers something to ponder.

MB: Whenever I am interviewed for my comments on the precious metals sector, I am usually addressing an audience that is predisposed to understanding the value of holding gold or silver bullion or equities in their portfolios, but what is rarely addressed is the correct allocation. There are some who believe that it is the ONLY asset that one should own and there are others that believe that it should be used as a balancing tool within a larger mix of assets.

No greater example of the need for a correct mix of assets could have been more obvious than the behavior of gold versus the S&P 500 since mid-2011. While bullion has dramatically outperformed the S&P 500 since 2000, the S&P 500 has been a superstar versus gold for the past 18 months. For this reason, it is critical to be flexible in your allocations because while I am certainly one of the most fervent believers in the importance of gold in protecting the purchasing power of portfolios, as a wealth manager I have to maintain a balance and that is something everyone must remember.

TGR: Thank you for your time.

Originally trained during the inflationary 1970s, Michael Ballanger, director of wealth management at Richardson GMP, is a graduate of Saint Louis University where he earned a Bachelor of Science in finance and a Bachelor of Art in marketing before completing post-graduate work at the Wharton School of the University of Pennsylvania. With more than 30 years of experience as a junior mining and exploration specialist, as well as a solid background in corporate finance, Ballanger’s adherence to the concept of “Hard Assets” allows him to focus the practice on selecting opportunities in the global resource sector with emphasis on the precious metals exploration and development sector. Ballanger takes great pleasure in visiting mineral properties around the globe in the never-ending hunt for early-stage opportunities.

Want to read more Gold Report interviews like this? Sign up for our free e-newsletter, and you’ll learn when new articles have been published. To see a list of recent interviews with industry analysts and commentators, visit our Streetwise Interviews page.

DISCLOSURE: 
1) Brian Sylvester conducted this interview for The Gold Report and provides services to The Gold Reportas an independent contractor. He or his family own shares of the following companies mentioned in this interview: None.
2) The following companies mentioned in the interview are sponsors of The Gold Report: Tinka Resources Ltd. Streetwise Reports does not accept stock in exchange for its services or as sponsorship payment.
3) Michael Ballanger: I or my family own shares of the following companies mentioned in this interview: Tinka Resources Ltd. and Bitterroot Resources Ltd. I personally am or my family is paid by the following companies mentioned in this interview: None. My company has a financial relationship with the following companies mentioned in this interview: Tinka Resources Ltd. I was not paid by Streetwise Reports for participating in this interview. Comments and opinions expressed are my own comments and opinions. I had the opportunity to review the interview for accuracy as of the date of the interview and am responsible for the content of the interview. 
4) Interviews are edited for clarity. Streetwise Reports does not make editorial comments or change experts’ statements without their consent. 
5) The interview does not constitute investment advice. Each reader is encouraged to consult with his or her individual financial professional and any action a reader takes as a result of information presented here is his or her own responsibility. By opening this page, each reader accepts and agrees to Streetwise Reports’ terms of use and full legal disclaimer. 
6) From time to time, Streetwise Reports LLC and its directors, officers, employees or members of their families, as well as persons interviewed for articles and interviews on the site, may have a long or short position in securities mentioned and may make purchases and/or sales of those securities in the open market or otherwise.