
Stocks & Equities
Millions of investors are soon going to learn about the financial markets the hard way — through giant losses.
Why? Because they’re confusing normal times with abnormal times.
Let me explain. In normal times, rapidly rising interest rates and Fed credit tightening would typically be bearish for commodities and stocks.
But these aren’t normal times. We’re coming out of a period with the lowest interest rates in the history of the country. A period that was fraught with financial failures, even the near-total collapse of the monetary system. And a period when the Fed deliberately kept interest rates at record lows.
Thing is, most investors aren’t making the appropriate distinction. They’re reacting in a knee-jerk fashion to the recent rise in interest rates. So they’re dumping gold and other commodities, and unloading stocks as if a giant bear is back on the scene.
But based on all of my research and long-term indicators, I’ve concluded that those same investors are going to be very sorry.
Why? Because this rise in interest rates, occurring during abnormal times, is going to have precisely the opposite effect. Instead of being bearish, it’s going to be resoundingly bullish for a lot of markets.
Simple logic explains why.
 First, rates were at record lows because almost nobody wanted to borrow. The demand for credit simply wasn’t there.
So as rates and the cost of money and credit rises, guess what happens? Demand goes up too. Potential homeowners and businesses will want to suddenly borrow again before interest rates go any higher. And that, in turn, will stoke all sorts of demand, from housing, to commodities, juicing corporate earnings and the stock market.
Second, interest rates are way below the true rate of inflation, which is running north of about 8%. In other words, we would need rates to move higher than the true rate of inflation ? higher than 8% ? to negatively impact any markets. Until that point comes, if at all, rising interest rates will actually become fuel for higher prices, once the knee-jerk selling has passed.
Third, there will come a time in the not-too-distant future when our foreign creditors start to sell U.S. sovereign debt as they lose confidence in our government’s ability to manage its affairs.
The resulting rise in interest rates will be very bullish for most markets, as money leaves the bond market in droves and seeks out alternative investments for appreciation and safety.
So you see, right now millions of investors are selling everything from gold to stocks because they think we’re in normal times, or approaching normal times.
But these are abnormal times. So you simply can’t apply the old rules.
You have to think out of the box, or you’re going to get buried in the box with a whole lot of losses and missed opportunities. And that’s not what I want for you.
Instead, I believe what’s going on now in the markets is a huge gift for savvy investors. For the following reasons:
- It’s helping gold slide into what should prove to be a major low. Ditto for silver. .
- It’s helping the dollar rally. A rally that will, in turn, be aided by Europe’s coming demise. That, in turn, will eventually lead to a huge opportunity to short the dollar, because, ultimately, its long-term bear market will resume, offering you enormous profit opportunities.
- It will eventually drive huge amounts of money into gold. Other commodities as well.
Right now, though, the selling can continue. So don’t be afraid to make hay with it in the short-term.
For instance, if you’ve followed my suggestions in this column, then you’re short stocks via the ProShares UltraPro Short S&P 500 (SPXU) and you’re long the dollar via the PowerShares DB US Dollar Bull (UUP). Hold those positions.
As to gold and silver, I’m loving that they are falling now. Why? Because the declines are setting up one of the greatest buying opportunities of all time.
Best wishes,
Larry

 i see further downside not because of the fed statements, but because like always they hedged their bets in the sense that the tapering off would not necessarily stop mr. bernanke said if the economy does not improve along the lines that we expect, we will provide additional support. so i think the markets are worried about something else. first of all, interest rates have been rising now for a year. the ten-year treasury note and 30-year treasury bond yield bottomed out last july. so we’ve been in an uptrend in interest rates. then, as i maintained for a long time, the chinese economy is much weaker than the official statistics suggest. my view would be that at the present time the chinese economy at the very best, the very best, is growing at something like four percent per an um and without a huge cred expansion there would be no growth at all. the other emerging economies are essential flat.

Global financial markets are now in a very perilous state, and there is a much higher than normal chance of a crash. Bernanke’s recent statement revealed just how large a role speculation had played in the prices of nearly everything, and now there is a mad dash for cash taking place all over the world.
After years of cramming liquidity into the markets, creating massive imbalances such as stock markets hitting new highs even as economic fundamentals deteriorated (Germany) or were lackluster (U.S.), junk bonds hitting all-time-record highs, and sovereign bond yields steadily falling even as the macro economics of various countries worsened markedly (Spain, Italy, Greece, and Portugal), all of this was steadily building up pressures that were going to be relieved someday. Just over a month ago, Japan lit the fuse by destabilizing its domestic market, which sent ripples throughout the world.
The Dash for Cash
The early stage of any liquidity crisis is a mad dash for cash, especially by all of the leveraged speculators. Anything that can be sold is sold. As I scan the various markets, all I can find is selling. Stocks, commodities, and equities are all being shed at a rapid pace, and that’s the first clue that we are not experiencing sector rotation or other artful portfolio-dodging designed to move out of one asset class into another (say, from equities into bonds).
Here’s the data. Let’s begin with the place that the most trouble potentially lurks – bonds – and here we have to start with the U.S. Treasury 10-year note, as that is the benchmark for so many other interest-rate-sensitive items, such as mortgage bonds.
Here there’s been a very interesting story that predates the recent Fed announcement by nearly two months. This chart of the price of 10-year Treasurys tells us much (remember, price and yield are exact opposites for bonds; as one moves up, the other moves down):
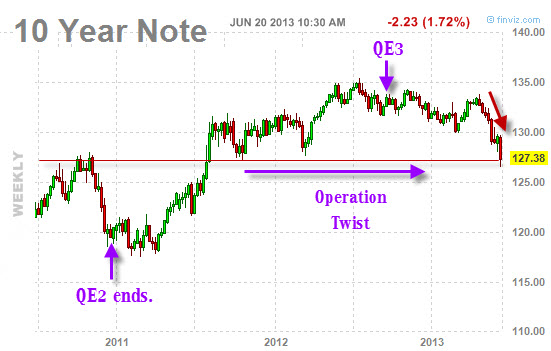
The first take-away is that the current price of 10-year Treasurys is now lower that at any time since late 2011. The second take-away is that this has happened despite both Operation Twist and QE3.
That is, after all the hundreds and hundreds of billions of dollars of thin-air money-printing and bond-buying, Treasurys are now lower in price than when the Fed initiated Operation Twist and QE3.
And it’s not just 10-year rates; the entire yield curve from 5-year to 30-year debt is now higher than it was a month ago:
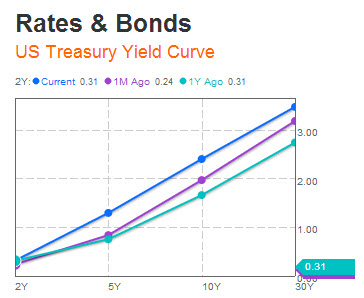
This is very, very important. On the one hand, it tells us that the Fed may not be omnipotent after all, because you can bet your bottom dollar that the Fed simply does not want long rates to rise and that this was an unplanned and unwelcome move. On the other hand, rising rates will do much to a fragile economy and over-leveraged speculators and institutions.
I may need more hands here, because there are other undesirable effects of rising rates, including falling equities (we’ll get to that in a minute), fiscal difficulties for heavy borrowers (many sovereign entities belong to this club), and mortgages becoming increasingly expensive.
An early casualty of rising U.S. interest rates, of course, was mortgage rates, which have climbed approximately 40 basis points (0.40%) over the past month:
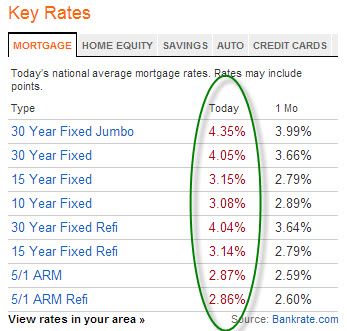
Obviously, anything that will impact the housing market at this point is entirely unwelcome by the Fed, which has openly stated that it wants people buying homes – and for a variety of reasons, people tend to take out fewer mortgages when rates rise. This is especially true for refinancing mortgages, an important source of revenue for financial institutions.
If it were just U.S. rates that were rising, that would be one thing, but rates have been on the move in Europe and Japan. In this next table, you can see two things: (1) much of the one-month rise in rates can be attributed to the past 24 hours (red arrows), and (2) quite a number of the most problematic nations have bond yields that are below their recent highs (as seen in the green circle).
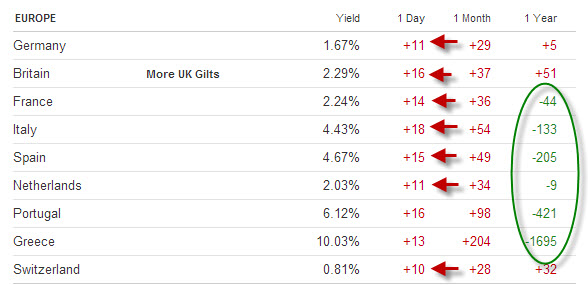
What I gather from this is that countries like Spain, Portugal, Greece, and Italy do not deserve the ridiculously low rates they now enjoy, and that those old highs in yield will be revisited.
Where the U.S. had a change in yield trend in mid-May 2013, Spain was leading the charge by reversing course in early May:
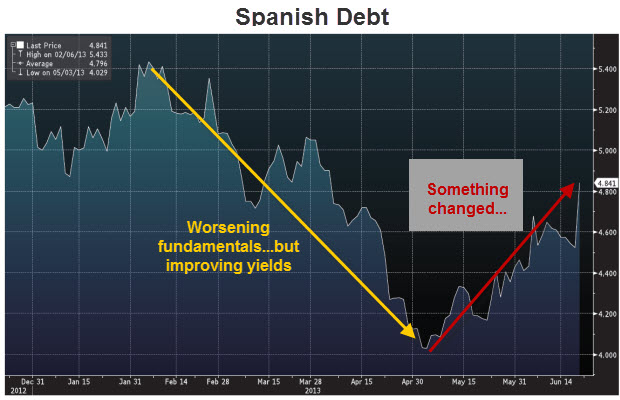
Who was buying all that junky sovereign debt at inflated prices as Spanish yields fell? Institutions and speculators. The institutions were entities like Spanish banks and the Spain pension system, buying Spanish debt for reasons that seem far more political than financially prudent. For a while, that strategy worked, as rising bond prices delivered both nice yields and capital gains, but now pretty much anybody who bought those bonds in 2013 is (at best) roughly even for the year, leaving plenty who are nursing losses.
The speculators in this story represented the hottest of the hot money, involving hedge funds jumping on any trades that seemed to be headed in the right direction and/or offered useful yields for spread trades, both of which conditions were met by southern European sovereign debt. But that hot money is best described by the phrase easy come, easy go. It arrives fast and leaves even faster.
Okay, so what we can say at this point is that bonds are being sold off around the world. This is very bad for equities, because there’s a connection between falling yields and rising equities. As yields fall, the risk-appetite of investors climbs because they need returns, and so they put more money into equities and real estate. This is especially true when interest rates are negative, meaning that they yield less than the rate of inflation, and that is precisely what the Fed engineered. On purpose.
However, this coin has two sides, and the less virtuous face combines rising bond yields with falling equities. It is simply the reverse of the Fed’s desired and manufactured outcome of the prior several years.
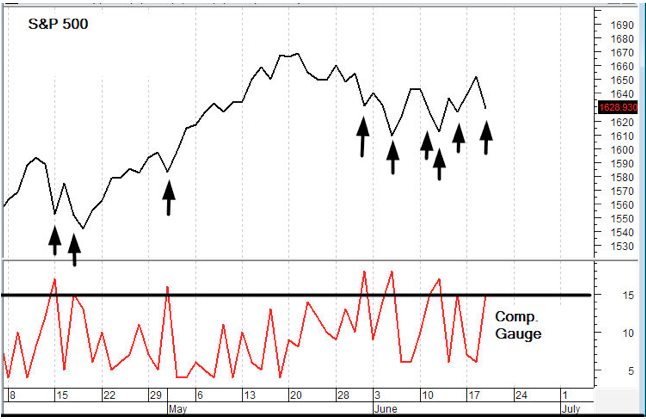
If we look at the U.S. stock market, as typified by the S&P 500, we see that it peaked in May (to no one’s surprise, I hope) and has been steadily falling over the same period that interest rates have been rising.
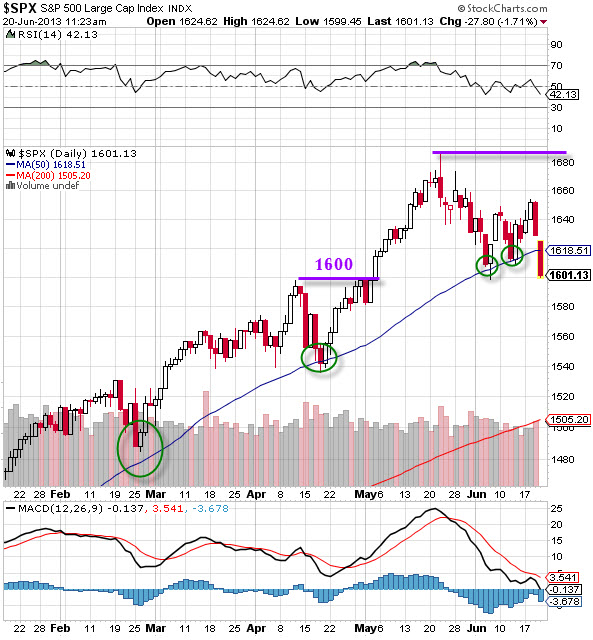
1600 is now the magic ’round number’ for the market to break through if it is heading lower, which I think it is. We’ll also note that the 50-day moving average (the rising blue line) has been critical support for the S&P 500 throughout the entire advance (green circles), and that it has been soundly violated on this drop.
Commodities have been heading down, too, but seemingly as a part of a larger move that’s been underway for a couple of years:
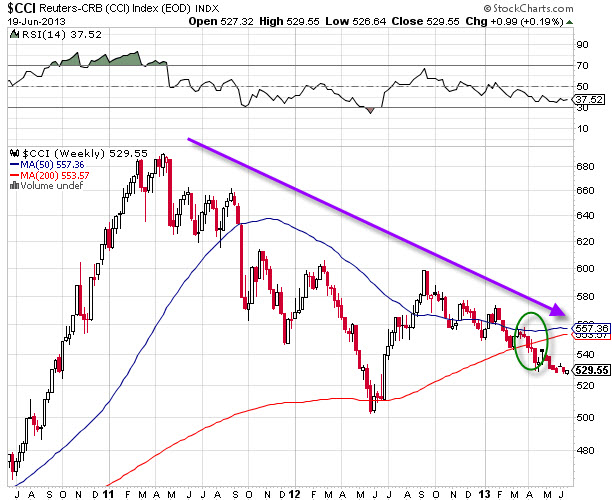
Note that commodities are now beneath their 200-week moving average, which is a very bearish indicator (green circle).
Collectively, the move away from commodities, bonds, and equities in all markets globally tells us that there’s nowhere to hide and that this is a 2008-style dash for cash. Everything is being sold, as it must, to meet margin calls, pay down leverage, and get out of positions; all are signs of the end of a speculative phase.
I know it’s a lot to claim that we are at that turning point, but the evidence that we are there is now more than a month old, and it’s time to consider that we are entering the next phase of our date with destiny.
What’s Coming Next
In Part II: The Ride Down from Here, we look at the increasing number of flashing indicators warning that a 2008-style – but worse – sell-off is arriving. We say “worse” because this time it looks like it will be accompanied by a vicious cycle of rising interest rates. Plus, governments and central banks have used up all of their major options already. There are no more white knights to hope for.
We examine the likeliest course from here for asset prices and what to expect from the central planners as desperation increasingly drives the decision-making. We also look at what defensive steps individual investors should be considering. Because, as we’ve been advising for months, now is a time for safety.
Buckle up. It’s going to be a bumpy summer.
Click here to read Part II of this report (free executive summary; enrollment required for full access).
About the Author
 Executive summary: Father of three young children; author; obsessive financial observer; trained as a scientist; experienced in business; has made profound changes in his lifestyle because of what he sees coming.
First of all, I am not an economist. I am trained as a scientist, having completed both a PhD and a post-doctoral program at Duke University, where I specialized in neurotoxicology. I tell you this because my extensive training as a scientist informs and guides how I think. I gather data, I develop hypotheses, and I continually seek to accept or reject my hypotheses based on the evidence at hand. I let the data tell me the story.
It is also important for you to know that I entered the profession of science with the intention of teaching at the college level. I love teaching, and I especially enjoy the challenge of explaining difficult or complicated subjects to people with limited or no background in those subjects. Over the years I’ve gotten pretty good at it.
Once I figured out that most of the (so-called) better colleges place “effective teacher” pretty much near the bottom of their list of characteristics that factor into tenure review, I switched gears, obtained an MBA from Cornell (in Finance), and spent the next ten years working my way through positions in both corporate finance and strategic consulting. From these experiences I gather my comfort with numbers and finance.
With the US equity markets only 2 to 3% off their highs, we thought it appropriate to look around the world at where the leveraged equity unwinds so far. There remain a select few nation’s equity markets that are positive year-to-date.
Year-to-Date, the deleveraging point is clear… (but US equities – for now – remain clean) – ZeroHedge
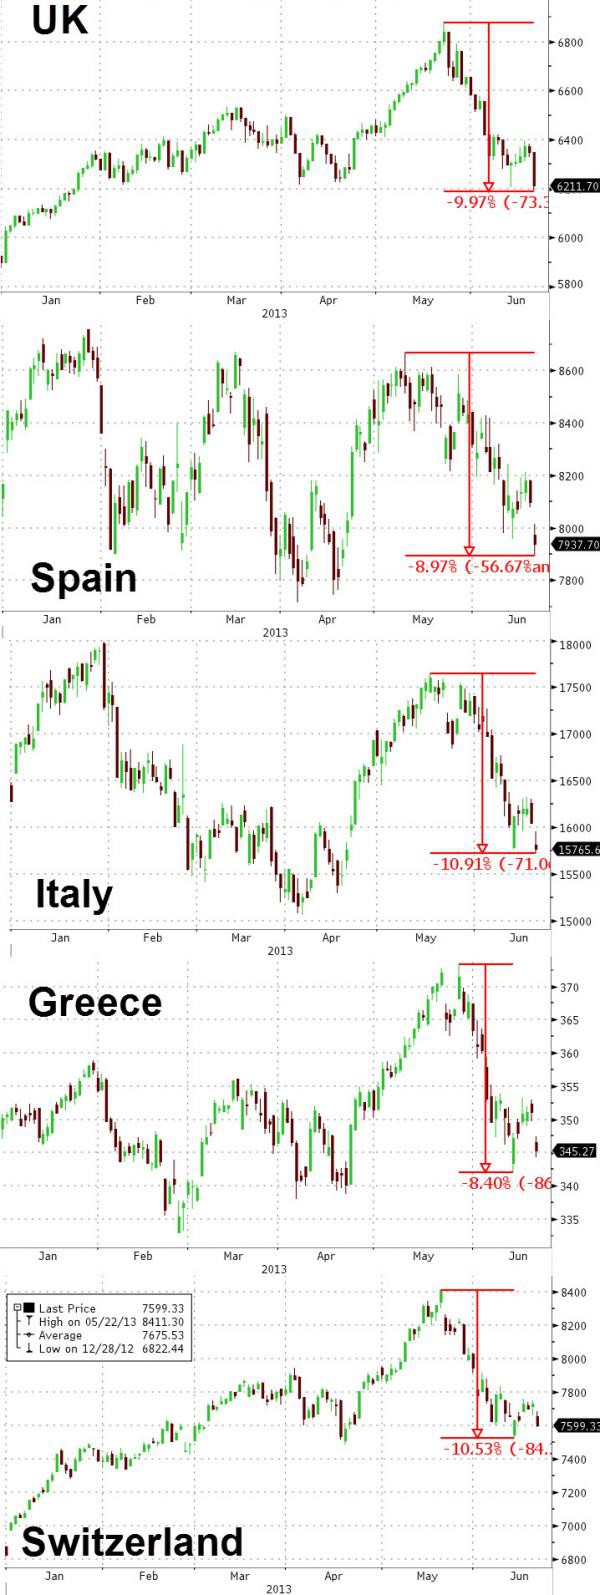
Ed Note: the above is just a fraction of the Global Markets you can view all in one chart HERE
Todd Market Forecast for Wednesday June 19, 2013
Available Mon- Friday after 6:00 P.M. Eastern, 3:00 Pacific.
DOW – 206 on 2000 net declines
NASDAQ COMP – 39 on 1000 net declines
SHORT TERM TREND Bullish
INTERMEDIATE TERM TREND Bearish
CHART: We report the single day reading of the Composite Gauge on this hotline. When it is 15 or above, the next day or two tends to be higher. That’s one of the elements of our system 2 signal which did give us a buy today.
TORONTO EXCHANGE: Toronto was down 99.
S&P\TSX Venture Comp: The Venture Comp was lower by 64.
BONDS: Bonds were hit pretty good.
THE REST: The dollar surged up. Silver, copper and crude oil were lower.
Our intermediate term systems are on a sell signal as of June 4, 2013.
System 2 traders We had another signal. ddddddddddddddddddddddddddddddddddddd
System 7 traders We are in cash. Stay there on Thursday.
Stock investors We are long Intel from 21.61 with a stop at 22.50.
We’ve discussed the FOMC. On Thursday we get initial claims, PMI Mfg. Ind. Flash, existing home sales and the Philadelphia Fed Survey.
————————————————————————————
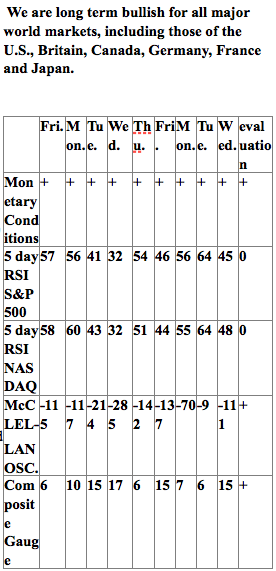 INDICATOR PARAMETERS
Monetary conditions (+2 means the Fed is actively dropping rates; +1 means a bias toward easing. 0 means neutral, -1 means a bias toward tightening, -2 means actively raising rates). RSI (30 or below is oversold, 80 or above is overbought). McClellan Oscillator ( minus 100 is oversold. Plus 100 is overbought). Composite Gauge (5 or below is negative, 13 or above is positive). Composite Gauge five day m.a. (8.0 or below is overbought. 13.0 or above is oversold). CBOE Put Call Ratio ( Below .80 is a negative. Above 1.00 is a positive). Volatility Index, VIX (low teens bearish, high twenties bullish), VIX % single day change. + 5 or greater bullish. -5 or less, bearish. VIX % change 5 day m.a. +3.0 or above bullish, -3.0 or below, bearish. Advances minus declines three day m.a.( +500 is bearish. – 500 is bullish). Supply Demand 5 day m.a. (.45 or below is a positive. .80 or above is a negative).
No guarantees are made. Traders can and do lose money. The publisher may take positions in recommended securities.
RANKED # 1 BY TIMER DIGEST
Timer Digest of Greenwich, CT monitors and ranks over 100 of the nation’s best known stock market advisory services.
Once per year in January, Timer Digest publishes the rankings of all services monitored for multiple time frames.
For the years 2003, 2004 and 2005, The Todd Market Forecast was rated # 1 for the preceding ten years. For the year 2006, we slipped to # 3 and in 2007, we were ranked # 5.
Our bond timing was rated # 1 for the years 1997, 2007 and 2008.
Gold timing was rated # 1 for 1997 and # 2 for 2006. Late word! We were rated # 1 for 2011.
We were # 1 in long term stock market timing for the years 1998 and 2004 and # 4 in 2010.
To subscribe go to Contact Us.

-
I know Mike is a very solid investor and respect his opinions very much. So if he says pay attention to this or that - I will.
~ Dale G.
-
I've started managing my own investments so view Michael's site as a one-stop shop from which to get information and perspectives.
~ Dave E.
-
Michael offers easy reading, honest, common sense information that anyone can use in a practical manner.
~ der_al.
-
A sane voice in a scrambled investment world.
~ Ed R.
Inside Edge Pro Contributors

Greg Weldon

Josef Schachter

Tyler Bollhorn

Ryan Irvine

Paul Beattie

Martin Straith

Patrick Ceresna

Mark Leibovit

James Thorne

Victor Adair