
Stocks & Equities
Short term strength in most equity markets and sectors will provide an additional opportunity to reduce equity exposure. Equity markets around the world effectively peaked on May 22nd. Now they are short term oversold and showing signs of

In last weekend’s missive I discussed, at length, the initial “sell” signal that was triggered by the markets decline. I also specifically stated that:
“[The] initial ‘Sell Signal’ is a warning that a further correction is likely to come. This is a wakeup call to pay attention to your portfolio. However, this is not a signal to ‘panic sell’ and make emotional based investment mistakes. When all of these signals align it is always in conjunction with a more significant market correction. Currently, the indicators are issuing a very strong ‘warning’ and it is likely that within the next couple of weeks we will see a deeper correction occur.”
However, this past week the market rallied strongly mid-week to push the market higher by .87% for the week. As I stated last week it would take a VERY strong rally to keep the secondary sell signal from being triggered.
 This week’s missive will cover “how bonds really work” in your portfolio, as well as, update our sell signals and portfolio instructions and recommendations.
If you missed last week’s missive I wanted to repeat last week’s updates:
– “Streettalklive.com” is merging into “STAWealth.com.” Only the look is changing – all the great features will remain the same.
– This weekly newsletter will actually become (3) different HTML documents that you will be able to print, read on your tablet and phone, share with friends and post to your social network.
-
- Portfolio Management: Market analysis & Investing Strategy
- Market/Sector Analysis: Analysis of 15 major sectors /markets
- 401k Plan Manager: Expanded and improved model/analysis
– Also, more frequent postings to the daily blog that are short reads, quick analysis or video/audio analysis of investing ideas, economics, strategies or tips.
…….read pages 2-17 HERE

- As of Wednesday, June 26th, the Elbow and Bow rivers are still three times higher than usual.
- Nearly 100,000 Calgarians were displaced due to flooding in homes and businesses.
- State of emergency declared on Thursday, June 20th It remains in place until July 4th.
- Four deaths have been reported due to the floods: three in High RIver and one in Calgary.
- Initial estimates peg the flooding damage between $3 billion and $5 billion.
- 25 per cent of flood damage will likely not be covered by insurance.
- High River has been especially hard hit and as of June 27th residents were not able to return home.
- Earlier this week Alison Redford announced that displaced residents will be provided with pre-loaded debit cards to help them with their immediate housing needs and day-to-day purchases. Those who qualify will receive $1,250 per adult and $500 per child.
- About 1,000 of Siksikaʼs 6,000 people have been forced out of their homes. Itʼs estimated that the flood damaged about 250 houses, and some of them will likely not be saved. Pre-loaded debit cards will be provided to First Nations members, as well as temporary foreign workers in the province.
Helping Out:
Peterʼs Drive is has been giving free meals to all volunteers and emergency workers
Tim Hortonʼs has an Alberta wild rose donut; proceeds to flood relief
Staff from the Purple Perk in Mission have been giving out free coffee and food to evacuees
The Calgary Stampeders will give proceeds of Fridayʼs 50/50 to the Red Cross.
Volunteers will be at the game to take monetary donations to same
The Calgary Stampede is selling “Hell or High Water” t shirts to raise money for flood relief
Volunteering:
http://www.volunteercalgary.ab.ca/

 Please Note: KeyStone’s Senior Income/Dividend Stock Analyst, Aaron Dunn will be speaking on Money Talks with Michael Campbell on Saturday June 29, 2013 at 9:00 a.m. (see below)
The Canadian dollar was lower Friday amid new figures that showed that the economy grew modestly during April.
The Loonie fell $0.39 to $0.9508 US as Statistics Canada reported that gross domestic product grew by 0.1%, in line with expectations.
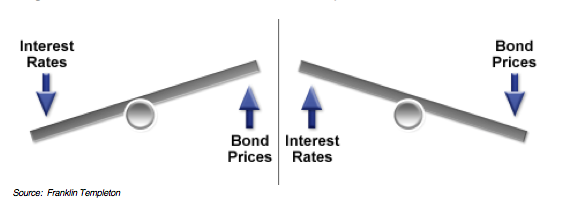
Fed chairman Ben Bernanke rattled markets on June 19 when he indicated that the central bank could start tapering its bond purchases and the Canadian currency has been volatile ever since, sinking as low as $0.9475 US earlier this week, its lowest level since October 2011.
Chairman Bernake’s statement sent interest rate sensitive stocks (many dividend payers) lower. Higher bond yields have been the major culprit amid speculation the U.S. Federal Reserve could be close to starting to wind up one of its key stimulus measures, the purchase of US$85 billion of bonds every month.
While most commentaries expect Canadian economic growth to pick up in the second half of the year, year-over-year, the Canadian economy grew at an annualized rate of 1.4% — slightly below the Bank of Canada’s most recent estimate for the full year and well short of some private sector estimates for 2013 growth. This should hardly be a rate that instills fear of sharply rising interest rates.
It is true that some yield stocks had been pushed to unattractive levels near term, but to paint all dividend stocks with one brush is symptomatic of how myopic the market has become. Today it seems tech stocks are either good or bad, REITs are either good or bad, or in this case, dividend stocks are either good or bad. There is no middle ground, everything is an absolute. I thought “only the Sith (Star Wars reference) deal in absolutes” – you are either with me or against me – and how did that work out for them (not good for those not following).
This type of one size fits all investing is nonsense. It is entirely short sighted as well. Fortunately it provides us long-term buying opportunities.
It is true that in a desperate search for yield, some dividend stocks were likely pushed too high near term. But those who argue against dividend paying stocks as a general rule in this market sound ridiculous. Are we actually to believe that a stock that trades below its growth rate, generates strong cash, pays us between 3-10% annually and holds a strong business is somehow unattractive because interest rates will eventually move higher? That is absurd. This is precisely the type of investment any true investor should be looking at in ANY investment environment.
But don’t take our word for it. According to a Ned Davis Research firm, over a 35 year time horizon (1970-2005), dividend stocks on the S&P 500 generated a total return of 10.19% per year compared to the 4.39% generated from non-dividend stocks – nearly 6% annual outperformance! Similar research can be sighted back 60 years plus.
That fact is investing in high quality-cash producing dividend stock is no “Johnny-come-lately” strategy. It is simple tried & true and has been used by some of the world’s most successful investors for over a century.
It is one of your best chances at beating the market long term.
However, it can be hard to figure out which dividend stocks to invest in – after all, not all dividend stock are created equal. It is critical to remember that just because a stock has an attractive dividend or yield of say 5, 8, 10 or even 15% – there is by no means a guarantee that it is sustainable at that level or at all.
Dividend stocks are not bonds and if you invest in low quality dividend stocks and chase unsustainable yields, you can find yourself loosing 40%-50% or more of your principal value. The media is full of headlines like “The only 5 dividend stocks you need for a successful retirement” or “Retirement strategy: Buy any dips in dividend winning stocks.”
Do yourself a favour and avoid these short-term fixes and start using our simple proven strategy to uncover profitable dividend paying stocks through intense research.
We specialize in indentifying dividend stocks with;
– Strong sustainable cash flow.
– Reasonable payout ratios.
– Solid balance sheets.
– Strong management teams with strong ownership positions.
– Trading at attractive fundamental valuations.
– Growing businesses.
– A history of dividend growth.
– And in a diverse degree of industries.
Over the past 3-years, KeyStone’s Income Stock service’s average gain (Conservative. Moderate, & Growth portfolios) combined have posted gains of 55.1%, which is more than triple the 16.1% gains the TSX-Composite index posted over that same period. In fact, each year since inception our Income/Dividend Stock Research has substantially bested the TSX benchmark in up and down markets, consistently posting very strong gains.
Last year (2012), Keystone’s Dividend Stock “Hybrid Portfolio” (our favourite 10-12 income stocks) posted a 24.1% gain versus the TSX-Composite, which managed a 7.2% gain including dividends.
——————————————————————————————
KeyStone’s Senior Income/Dividend Stock Analyst, Aaron Dunn will be speaking on Money Talks with Michael Campbell on Saturday June 29, 2013 at 9:00 a.m.
KeyStone’s Income Stock Report
Special Annual Membership Offer
One Year Special VIP Offer (12 Editions)
Regular Price: $599
You Save: $200
Your Price: $399
Real Time Dividend Stock Research Includes (each month):
· Individual BUY/SELL/HOLD Income Stock Report
· 3-6 Updated BUY/SELL/HOLD Reports on Previously Recommended Companies
· New Strategies – “How to Simply Create Your Own TFSA Income Producing Portfolio!”
· Cutting Edge Market Commentary
Plus
· 3 Model Income Portfolios (divided into risk categories – up to 8 stocks per portfolio)
· Monthly Updated Ratings on our Aggressive, Moderate, and Conservative Income Producing Portfolios
· Access to Our Analyst Team Via Our Email Information Service
SPECIAL RATE CODE: ISR9
To Subscribe, you can visit our website: http://www.keystocks.com, click the subscription link (located on the top left side of the web page) and choose the BUY Annual Subscription – $599.00/year. Once you have confirmed your information, on the next page there will be a box where you can apply rate code: ISR9 and click submit. The price will adjust accordingly and then you may click proceed, located at the bottom of the webpage.
As long-time readers know, I have a very eclectic group of friends and associates. Colorful, opinionated, generally both fun and funny, they make for interesting times and discussions wherever I go. I am not certain why they associate with such a mild-mannered, soft-spoken, Muddle-Through Texan like me, but most agree that I am at least good for comic relief. Next week I will be in the midst of some unabashed bulls, but today I offer up for your reading pleasure a note from a friend who is on the Dark Side of the fence, though he is hardly what you could call a conventional bear. He is Rich Yamarone, Chief Economist for Bloomberg. – John Mauldin
A Message from Lord Vader
by Rich Yamarone
“There is no dark side of the moon really. Matter of fact, it’s all dark.”
Pink Floyd
A recent gut feeling about a global unraveling has forced the Prince of Darkness to issue the following statement regarding the economic climate (as well as provide an open invite to the annual Dark Side summer soiree): Emerging markets are in turmoil, Europe is spiraling deeper into recession and finance ministers in the region are scrambling to fix the seemingly never ending banking crisis. Turkey is the new hotbed of civil unrest, and central banks and sovereign nations are providing extreme monetary policy accommodation and engaging in currency wars to maintain some sense of stabilization. The World Bank reduced its global economic forecast to 2.2 percent in 2013 – lower than the 2.3 percent performance in 2012.
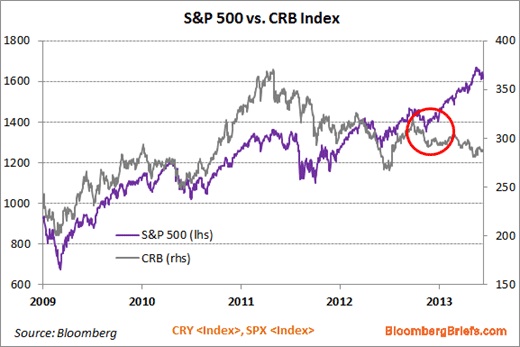
It was just a matter of time before the conditions started to break down. If you see a 500 lb. man eating a donut and smoking a cigarette, you needn’t be a genius to know the situation isn’t going to end well. Similarly, blistering gains in the equity indexes to record highs amid a sluggish economic performance are simply unsustainable. Look at the bifurcation between the CRB index and the S&P 500; that solid relationship between the market and economy broke down in December of last year, and it now looks as if the S&P will rejoin the commodity benchmark in its tailspin.
GDP advanced by a seasonally adjusted annual rate of 2.4 percent in the first quarter, resulting in a 1.8 percent increase over the previous year – which is usually a recession indicator. For now it’s likely that the economy continues to plod along at this subdued level until one of the many obstacles send it south.
We recently saw of a number of possible signals of a downturn.
The ISM’s PMI fell to 49 in May from 50.7 in April, the first sub-50 reading in the barometer since November (49.9) and the lowest level since Jun 2009 (45.8) when the U.S. economy was emerging from depression. Along the same lines, the key subcomponents of New Orders and Production fell to 48.8 and 48.6 respectively – indicating a contraction in business conditions. This slump doesn’t appear to be solely an American condition.
The difference between the New Orders Index (a proxy for future demand) and the level of existing inventories (expectations by businesses of future demand) was -0.2 in May. Historically a negative reading has been a recession indicator. This isn’t foolproof – there have been several negative postings with a downturn surfacing – but there have been six negative readings since the end of the 2007-2009 depression, which supports a somewhat tepid situation.
The other ISM indicator is the Price Index, which slipped below 50 to 49.5 in May. Below-50 readings are always experienced during recessions. The inability of businesses to raise prices in a challenging economic environment, in combination with a sub-50 reading in the headline PMI and a negative New Orders less Inventories index suggests a notable curtailment in economic growth.
Industrial production has peaked (8.5 percent) in mid-2010 to 1.95 percent today (another indicator that has fallen below that magical 2.0 percent recession level), and manufacturers are slashing jobs again. The regional Fed manufacturing indices are all lingering in crummy territory – at best. Electricity output has fallen in each of the last five weeks (on a year-over-year basis), and shipments of nondefense capital goods excluding aircraft plunged 1.5 percent in April – a messy beginning of the second quarter.
The average length of the last ten expansions is 60.5 months, and we are currently 47 months into the most recent recovery. It isn’t inconceivable that the economy contracts at this point, especially since it has been operating at a pace that has historically suggested recession.
If the global equity market sell-off is not a “Sell in May” event, but rather the beginning of the great unwinding then the economy, already skating on thin ice, is even more susceptible to a downturn.
There is something to consider with respect to the sluggish second quarter start: data revisions have an incredible ability to change the economic landscape and the determination of business cycle strengths and turning points. In 2008, the fourth quarter GDP was initial reported to have declined by 3.8 percent…nine revisions later the actual level stands at -8.9 percent. [Hat tip to my friends at Chilton Capital for bringing it to my attention.]
On July 31, the Bureau of Economic Analysis will revise the National Income Product Accounts (including the GDP report). What happens – pure speculation, but not entirely outrageous – if the final quarter 2012 GDP increase is downwardly revised from its current 0.4 gain to a 0.5 percent decline. And the first quarter 2013 increase of 2.4 is shaved a few basis points to a 1.8 percent increase, and the current quarter comes in negative? Will the chatter pick up about recession? Will a recession be declared? Will those folks at the ECRI be heralded as heroes? Will the Street flock to the Dark Side, and will everyone will want in on our glorious Dark Side picnic. Do we have enough chairs? Stay tuned, its less than two months away…
According to (82) economists polled by Bloomberg, U.S. GDP is expected to increase 1.9% in 2013, following a 2.2% gain in 2012. This is extremely weak by historical standards, and with the exception of one event, has resulted in recession every time since 1948.
This said, we are anticipating the addition of several Street economists to come over and join us here on the Dark Side as well as the annual picnic – we are fully prepared as we asked Beelzebub’s Catering and Party Tent Rentals to provide us with a few hundred extra chairs and tables. (Thanks guys.)
This year’s party might not be as exciting or entertaining as in previous confabs. Just as Fed Chairman Ben Bernanke will not be attending the annual central bank conference in Jackson Hole, Wyoming, we are afraid that a long-time Dark Side headliner (and a dear friend) Dave Rosenberg of Gluskin-Sheff, might not be partying with our Doom and Gloom set. This is a mighty blow – you’ll remember the 2004 and 2005 soirees when Mr. Rosenberg was undoubtedly the life of the Dark Side parties, forewarning all that would listen of the pending housing crisis and subsequent economic doom.
To date, the labor market recovery has been unimpressive. The number of Americans on nonfarm payrolls totaled 135 million in April, the same level as in late 2005. On this basis one can claim the U.S. has “turned Japanese” with a near lost decade of job creation. We should expect results that are similarly poor as in Japan in coming decades: we use the same policy prescription for the same ailment, why wouldn’t we have the same result? If you wrap avocado, cucumber, and rice in Nori with sesame seeds, it’s a California roll. Why would you think it’s something else? [For the record, there is no sushi in the Dark Side.]
It looks like 96,300 of the 175,000 new nonfarm jobs created last month were in very low wage industries (retail, 27,000), temporary, (25,600), leisure and hospitality (43,000). The industries with the two lowest hourly wages are leisure and hospitality ($11.76) and retail ($13.92). It isn’t clear how the world’s largest economy gets back on its feet with so many receiving such low incomes.
In the Dark Side wages don’t matter, everything here is free – it’s not that dark! The single greatest hurdle for the recognized U.S. economy however, is flat-to-declining wages. To some this may sound a tad like a broken record [Apparently vinyl records are more popular than cds right now see: http://bit.ly/1aWrtW3 ] but the only thing that matters to the economic recovery is incomes.
Real disposable personal incomes – the amount that consumers have to spend once adjusted for inflation and taxes – increased 0.1 percent in April, a mere 1.0 percent higher than year ago levels. Similarly, the amount of spending that Americans facilitated with that lowly income inched up 0.1 percent, or 2.1 percent from April 2012. Real disposable personal incomes had a history of advancing at 3.75 percent, which would boost spending by a similarly robust pace. As long as income growth is staid as it is, the economy will continue to spin its wheels in a sideways movement, and subsequently keep a lid on job creation.
Grab some food stamps…they don’t cost nothing. Some things don’t need to be examined to know what kind of an effect they will have on consumer psyches, spending habits, and ultimately aggregate demand. According to the USDA, there are more than 47 million Americans on the Supplemental Nutrition Assistance Program, more commonly known as food stamps. Since the end of the depression in June 2009, food stamp assistance has accelerated by 30.8 percent, dwarfing job creation of 3.8 percent during the same period. This said, it should come as no surprise grocery and health and wellness in aggregate make up about 66 percent of Wal-Mart’s revenues. More stores are adjusting space for the inclusion of groceries.
Anecdotes from the Bloomberg Orange Book – admittedly a far too bright colour for those residing here in the place of torment – point to a number of headwinds.
The Bloomberg Orange Book Sentiment Index has been below 50 (a reading of contraction) for eighteen consecutive weeks. Comments continue to paint a picture of souring business conditions.
Consumer companies complain:
Church & Dwight: “I have been a long-term pessimist about the business environment. The latest forecast of weak GDP growth, continuing high unemployment and weak same-sale stores (sic) [same-store sales] (10:30) growth by our major retailers provides little hope for near-term improvement in the U.S. economy.” “2013 is shaping up to be another very challenging year due to the weak consumer demand.”
Denny’s: “We faced significant headwinds in this quarter, as we lapped our strongest quarter of last year. And our customers felt the impact of higher payroll taxes, gas prices and delayed income tax refunds. As a result, we ended up with our first quarter of negative system-wide same-store sales in almost two years.”
Shoe Carnival: “The government’s delay to act on tax policy and their subsequent decision to raise payroll tax withholding rates had an immediate impact on our consumer. The decision the IRS made to delay accepting tax returns until January 30 also had an immediate and calculable impact on our sales results for the last 10 days of the quarter.”
Express Inc.: “At the same time, traffic is down noticeably compared to last year. Consumers appeared cautious due to the macroeconomic environment and uncertainty around budget cuts and also the impact of higher payroll taxes.”
Kona Grill: “During the quarter, the restaurant industry in general experienced a pullback in consumer spending due to the payroll tax increase, delays in income tax reform, and spiking gas prices, which impacted guest traffic and we were no exception.”
The catatonic state of affairs in Washington, DC is really upending many companies – kind of shocking that in the aftermath of depression, fiscal policy is so incredibly restrictive. Sequestration is on the minds of many companies, and it is not limited to the aerospace and defense industry:
Kelly Services: “We expect the current pace of growth will continue as the U.S. labor market remains fragile and unpredictable with no clear signs of momentum. Add to that there is ongoing uncertainty about the effects of sequestration and rising anxieties surrounding the impending Affordable Care Act, which is one of the most significant issues facing our industry today.”
Armstrong Worldwide: “On the commercial front, in the U.S., we anticipate a continuation of flat to slightly down commercial volumes, with ongoing weakness in education and, to a lesser extent, healthcare.”
Hertz Global Holdings: “In April, we experienced some softness in both the car and equipment rental businesses in the U.S. due to the holiday shift and the initial impact of the sequester. Volumes in our government businesses were down double digits this month, and our commercial accounts with exposure to government customers also cut back on travel.”
UPS: “Although the U.S. economy is poised for growth, it is being restrained somewhat by the tax increases and sequestration implemented during the first quarter. This will be a drag on 2013 GDP expansion with current expectations for about 2% growth.”
Lockheed Martin: “I think as we looked forward for the next three quarters, we do expect to see some pressures from sequestration. They’ve not played out at this point, but we do expect them to happen in the next three quarters.”
Internationally, Bloomberg Orange Book anecdotes have highlighted great concern:
Sealed Air: “As a Frenchman, I can tell you I’m very concerned about the French economy. It’s been moving towards Spain and Italy instead of moving towards Germany. And it shows in our equipment business, equipment and tools business.”
Air Products & Chemicals: “In North America we experienced modest growth; Europe sunk deeper into recession, with Southern Europe remaining particularly weak while the Northern Continent and Central Europe worsened; and in Asia there was a slower-than-expected ramp-up after the Lunar New Year holiday.”
Cooper Tire & Rubber: “China’s economy continues to grow at a slower pace than recent historical rates and Europe’s economy remains stalled. Combined, all of these challenges resulted in Cooper’s shipping volumes being 8% lower than the prior-year first quarter…”
Avis Budget: “Interestingly the markets that were weak last year Italy and Spain seemed to have stabilized thus far in 2013, while France and the UK continued to show some signs of weakness. Germany, which was the lone moderately strong performer last year, has softened this year in line with its softening economy.”
McDonald’s: “Japan’s performance for the quarter was negatively impacted by the difficult economy, a declining IEO industry, and ongoing consumer sensitivity to prices and promotions. Japan continues to evaluate and adjust its plans to complement existing value initiatives with new product news that drives long-term profitable sales and guest counts.”
Central banks all over the world are singing the song of unconventional monetary policy. Now we are all lead to believe that the Bank of Japan’s most recent announcement to adopt a $1.4 trillion quantitative easing program will be the magical elixir to its multi-decade ailments. This seems a little doubtful; as Tanya Tucker sang, “It’s a little too late to do the right thing now.”
The incomes and wage channel hold the answers to countless economic issues. Other than the obvious influences on confidence, spending, corporate profits, and hiring, there is the impact on policy prescriptions. As long as there is disinflation or deflation in average hourly earnings, the Fed should be expected to its foot on the accelerator, and refrain from tapering in the near term.
Many pundits are pointing to geopolitical uprisings as cause for concern to the U.S. economic recovery efforts. Economically speaking, the American consumer – the ultimate driver of aggregate demand – cares little about the goings on overseas. You’ll never overhear Mom pushing junior in a Wal-Mart or Target saying, “We’re not buying any toys today, there’s civil unrest in Turkey.” Investors should expect any meaningful impact from the strife in Cyprus, Syria, or any other nation that is not economically influential.
Our friend Lucifer of Lucifer’s Econometric Forecasting & Astrology informed us that this year might not be something to get excited over. Earlier this year, the Chinese zodiac welcomed the Year of the Snake. Previous “snake years” haven’t been kind to the U.S. economy; of the last ten (1893, 1905, 1917, 1929, 1941, 1953, 1965, 1977, 1989, and 2001), the U.S economy had experienced two recessions (1953, 2001) and two depressions (1893, 1929). Other years experienced similarly profound bouts of calamity, i.e.; in 1917 the U.S. entered WW-I, and in 1941 entered WW-II. Snakes are seldom overlooked and have a tendency to strike sharply when ignored.
So while you are making your plans for this summer and the early fall, remember: here in the Dark Side there’s an open invite for the excellent assortment of dark beers for your consumption – they are warm. After all, this is the Dark Side. There’s a wonderful dark chocolate cake for dessert, and Marilyn Manson is scheduled to be the warm-up band for Alice Cooper on Laborless Day, who will be performing at 5:00 pm in the Satan’s Den. Thanks again for considering, your table is ready.
Lord Vader
Richard Yamarone is an economist who focuses on monetary and fiscal policy, economic indicators, fixed-income, commodities, and general macroeconomic conditions for Bloomberg Brief: Economics, a daily newsletter that features analysis, data and news on the forces shaping the global economy. Mr. Yamarone and the Bloomberg Brief economics team provide in-depth analysis of macroeconomic data, policy, and trends and how they will impact financial markets.
You can download a sample issue of Bloomberg Brief: Economics here. Subscribers get Rich’s Orange Book as part of the deal.
John Mauldin is president of Millennium Wave Advisors, LLC, a registered investment advisor. All material presented herein is believed to be reliable but we cannot attest to its accuracy. Investment recommendations may change and readers are urged to check with their investment counselors before making any investment decisions.
Opinions expressed in these reports may change without prior notice. John Mauldin and/or the staffs at Millennium Wave Advisors, LLC and InvestorsInsight Publishing, Inc. (InvestorsInsight) may or may not have investments in any funds, programs or companies cited above.
PAST RESULTS ARE NOT INDICATIVE OF FUTURE RESULTS. THERE IS RISK OF LOSS AS WELL AS THE OPPORTUNITY FOR GAIN WHEN INVESTING IN MANAGED FUNDS. WHEN CONSIDERING ALTERNATIVE INVESTMENTS, INCLUDING HEDGE FUNDS, YOU SHOULD CONSIDER VARIOUS RISKS INCLUDING THE FACT THAT SOME PRODUCTS: OFTEN ENGAGE IN LEVERAGING AND OTHER SPECULATIVE INVESTMENT PRACTICES THAT MAY INCREASE THE RISK OF INVESTMENT LOSS, CAN BE ILLIQUID, ARE NOT REQUIRED TO PROVIDE PERIODIC PRICING OR VALUATION INFORMATION TO INVESTORS, MAY INVOLVE COMPLEX TAX STRUCTURES AND DELAYS IN DISTRIBUTING IMPORTANT TAX INFORMATION, ARE NOT SUBJECT TO THE SAME REGULATORY REQUIREMENTS AS MUTUAL FUNDS, OFTEN CHARGE HIGH FEES, AND IN MANY CASES THE UNDERLYING INVESTMENTS ARE NOT TRANSPARENT AND ARE KNOWN ONLY TO THE INVESTMENT MANAGER.
Communications from InvestorsInsight are intended solely for informational purposes. Statements made by various authors, advertisers, sponsors and other contributors do not necessarily reflect the opinions of InvestorsInsight, and should not be construed as an endorsement by InvestorsInsight, either expressed or implied. InvestorsInsight is not responsible for typographic errors or other inaccuracies in the content. We believe the information contained herein to be accurate and reliable. However, errors may occasionally occur. Therefore, all information and materials are provided “AS IS” without any warranty of any kind. Past results are not indicative of future results.

-
I know Mike is a very solid investor and respect his opinions very much. So if he says pay attention to this or that - I will.
~ Dale G.
-
I've started managing my own investments so view Michael's site as a one-stop shop from which to get information and perspectives.
~ Dave E.
-
Michael offers easy reading, honest, common sense information that anyone can use in a practical manner.
~ der_al.
-
A sane voice in a scrambled investment world.
~ Ed R.
Inside Edge Pro Contributors

Greg Weldon

Josef Schachter

Tyler Bollhorn

Ryan Irvine

Paul Beattie

Martin Straith

Patrick Ceresna

Mark Leibovit

James Thorne

Victor Adair