…practically no matter what Bernanke and his minions do to further screw up the markets.
Check out these 5 factors from Keith that lead to investing success.

In last week’s update on the gold sector, we neglected to point out that gold stocks actually reached all time record oversold levels before reversing on Thursday.
As Steve Saville points out here, the gold sector has indeed never before traded this far below its 200 day moving average. Mr. Saville employs the BGMI (Barron’s Gold Mining Index) in his analysis, as it is the oldest gold mining stock index – in fact, the BGMI allows us to look as far back as the 1940s. The historical record is actually quite clear with regard to what tends to happen after such ‘oversold’ extremes are recorded.
Gold stocks produce an ‘oversold’ record amid price/momentum divergences – (click HERE or click on image to enlarge.)

Mr. Saville writes:
“It turned out that almost anything was possible, because at last week’s low the HUI was 55.9% below its 200-week MA. Therefore, using either the BGMI or the XAU as a sector proxy up to and including 2000 and the HUI as a sector proxy thereafter, at last week’s low the gold-mining sector of the stock market was further below its 200-week moving average (MA) than it had ever been.
We know from painful experience that there are no absolute benchmarks when it comes to sentiment and ‘oversold’ extremes, so the current extreme does not provide buyers with a guarantee of success. However, it isn’t every day that you get the opportunity to buy an investment at its most ‘oversold’ level in history.”
.…to read more & get short term Outlook go HERE & scroll down

DOW + 56 on 750 net declines
NASDAQ COMP + 10 on 300 net advances
SHORT TERM TREND Bullish
INTERMEDIATE TERM TREND Bearish
STOCKS: In the early going, foreign markets were down sharply. The London FISE, our closest relative, was down 100. The reasons were turmoil in Portugal, Brazil and especially Egypt.
We followed suit initially. The Dow was down 74. But, then it turned and was up as much as 93 before settling back. We think the reason had to do with reports that Morsi in Egypt was about to be deposed. Personally, I hope so.
Why is Egypt important? Just think Suez Canal and oil shipments. But, this was a very light volume partial trading day so a lot of things can happen. Breadth was horrendous, but again, this was a very short trading day and a lot of participants may have taken the day off.
Ed Note: Michael Campbell will interview Stephen Todd on Money Talks this Saturday @ 9am
GOLD: Gold managed to move up $8.
TORONTO EXCHANGE: Toronto lost 73.
S&P\TSX Venture Comp: The Venture Comp was up by 1.
BONDS: Bonds lost some ground.
THE REST: The dollar Rose. Silver, copper and crude moved higher.
NEWS AND FUNDAMENTALS: The trade deficit $45.08 Billion, more than the expected $40 billion. Initial jobless claims came in at 343,000, less than the expected 345,000. and the ISM non mfg index was 52.3, less than the consensus 54.5. On Friday we get the dreaded non farm payrolls.
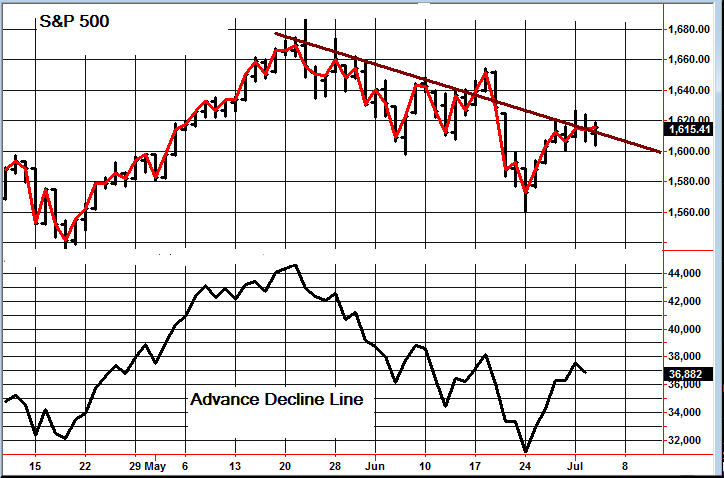
CHART: Interesting. Exactly one day after I praised the advance decline line for outperforming the S&P 500, it does just the opposite. The S&P 500 is still fighting the downtrend line shown.
Timer Digest of Greenwich, CT monitors and ranks over 100 of the nation’s best known stock market advisory services.
Once per year in January, Timer Digest publishes the rankings of all services monitored for multiple time frames.
For the years 2003, 2004 and 2005, The Todd Market Forecast was rated # 1 for the preceding ten years. For the year 2006, we slipped to # 3 and in 2007, we were ranked # 5.
Our bond timing was rated # 1 for the years 1997, 2007 and 2008.
Gold timing was rated # 1 for 1997 and # 2 for 2006. Late word! We were rated # 1 for 2011.
We were # 1 in long term stock market timing for the years 1998 and 2004 and # 4 in 2010.
To subscribe go to Contact Us.

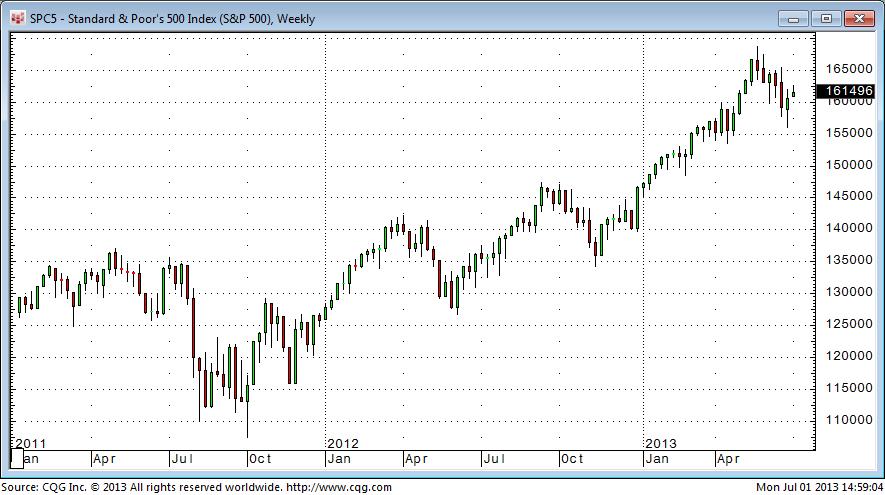
The stock market made a low early last week and then rallied on the idea that Market Psychology had “over-reacted” to Bernanke’s June 19 message. Stocks, Bonds and Crude Oil all had a similar trading pattern from Wednesday June 19 through Friday June 28. The S+P, which had fallen nearly 8% from the May 22 All Time Highs to the June 24 lows, bounced back ~3% by last Friday’s close. My trading theme has been that Market Psychology across asset classes registered a Major Key Turn Date on May 22…so, has the sell-off from the May 22 highs just been a correction in the bull market that started in March 2009…or is there more to go on the downside? Well, that depends on your time frame…and two key chart levels…see the Charts section below.
In this July market update Brooke describes specifically how conditions differ this particular July from those of years previous. Indeed the period July 19th – July 27 has produced an average loss of .4% in the time span from to1950 to 2012.
Further examination of the data shows that August also tends not to be a good month and that from 1950 to 2011 September has not only been the worst month of the year, producing an average loss of .6%, but has also only been positive 44% of the time.
While the market can rally during this time period, there has been 1 of 3 causes of a strong rally present when it has:
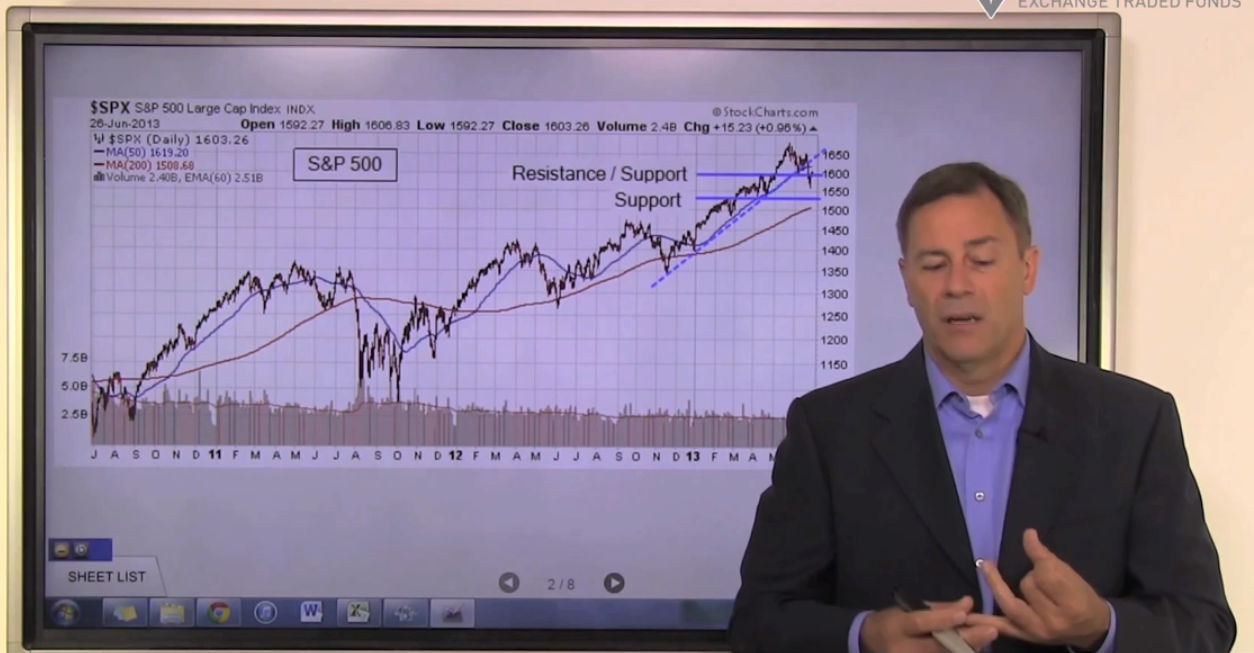
More on the Market as well as a Sector Update in the 2 videos below:
Many investors are understandably nervous when it comes to what the markets will do this week. Some are downright agitated.
My take? Keep calm.
The markets are doing what they need to be doing right now. The big swings we’re experiencing lately are not a sign that the markets are broken. Far from it.
On the heels of a 137.43% run off March 2009 lows, the pullback we experienced last week was absolutely normal. Long overdue, in fact.
I’m actually glad to see the volatility because it means the markets are working normally. A little give and take is absolutely essential when it comes to bigger gains and better returns.
Hard to stomach with everything that’s going on? Yup…which is why It’s worth noting that the markets have posted positive second half gains 26 of 26 times since WWII when the S&P 500 has turned in positive January and February returns. Those aren’t bad odds.
So now on with the show…what is the biggest mistake you can make right now?
Let me put it this way – it’s something locked in our brains. And it loses investors more money than every other investment “problem” combined. Let me show you something:
The probability of correctly timing the stock market just 50% of the time is a mere:
0.000000000000000000000000000000000000000000000000
000000000000000000000000000000000000000000000000
000000000000000000000000000000000000000000000000
000000000000000000000000000000000000000000000000
000000000000000000000000000000000000000000000000
000000000000000000000000000000000000000000000000
00000022883557%.
Jamie Dimon has higher odds of being the next Fed Chairman.
Why are we so incredibly bad at something that seems so basic? Like I said, it’s a “brain thing.” Let me explain…
You hear a lot about the term volatility when the markets jump like this. But most people don’t really understand what it means. Volatility is simply a measure of the variation in price of any financial instrument over time. Unfortunately, the news has preconditioned investors to understand it as a negative influence because volatility rises when the markets drop.
In fact, quite the opposite is true. Volatility is really an expression of both up and down market movement. The key is in learning how to manage it so that your portfolio is not disproportionately impacted by either big down days or lost opportunity that comes from massive upswings.
Take the DOW, for instance. Over the past 110 years we’ve experienced two World Wars, multiple currency defaults, the Korean Conflict, Vietnam, the Gulf Wars, terrorism, presidential assassination, inflation, deflation, the Financial Crisis…and the index still rose 35,174%.
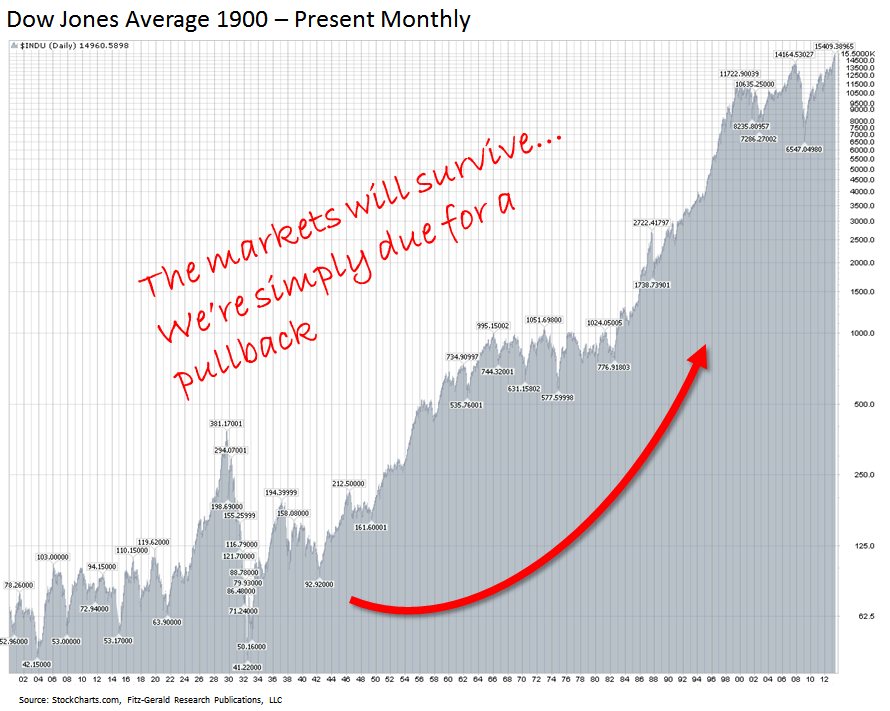
The markets have endured plenty of “volatility” over the years. In fact, if you look far enough back, you find that the markets actually do a pretty good job under conditions that should have killed them.
What makes short-term volatility so dangerous is the impact it has on your mind and specifically on yourdecision making.
I’ve written about this before but it bears repeating:Investors systematically deviate from otherwise rational decision making when the markets drop.
Scientists think this is because of decisions that get made under duress when the primary concern is losing money are made using reactionary segments of the brain rather than those that are anticipatory.
Whether Bernanke cuts QE has nothing to do with it. He and his central banking buddies are sideshow inputs at best. So is the notion of a Chinese credit crunch, a European meltdown or any of half a dozen other things investors are worried about at the moment.
That’s both good news and bad news.
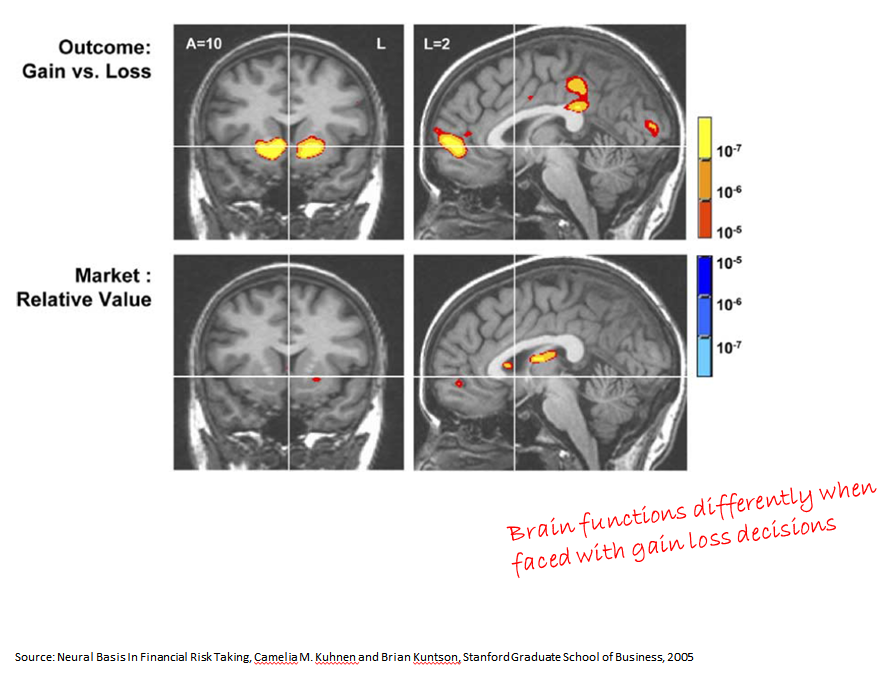
Bad news first…there’s nothing you can do about this. Our brains are hardwired to do different thinking when forced to decide between decisions that result in a “gain or loss” and “relative value.”
Not only that, but we literally use different sections of our brain – the NAcc and the Anterior Insula – to process what’s happening in the markets depending on whether they are rising or falling and how they relate to the two decisions I’ve just mentioned.
You can see this quite clearly in MRI imagery.
In this shot for example, you can see that the top two images show marked activity in the Nucleus Accumbens or NAcc under conditions focused on the anticipation of gains.
The bottom two images reflect a brain that is anticipating more subjective incentives correlated to risk aversion and feelings.
As you can see, the difference is quite pronounced which is why the two Stanford scientists who conducted this study, Camelia M. Kuhnen and Brian Knutson, believe that activation of one of these two regions can actually lead to a shift in risk preferences.
Having spent 33 years in the markets, I agree. I’ve seen more than my share of people “wig out” when conditions get choppy. You probably have too and now you understand quite literally why.
This is why casinos concentrate the visitor experience around “perks” and creature comforts like free drinks, jackpots, great food and fun – because they know that doing so is more likely to activate the reward seeking anticipatory NAcc portion of the brain.
Wall Street operates in much the same way but with a subtle refinement. Their advertising is geared towards total wealth management, confidence and control. They know that big down days engage the anterior insula, so it’s in their interest to communicate with potential clients after experiencing the fear of loss or, in some cases, actual losses. If you’ve ever heard Wall Street insiders talking about “feeding the greed gland,” this is what they’re talking about.
Traders take this a step further. There is no subtlety about it. The more panic and fear you feel and the more irrational your decision making becomes, the more likely you are to play into their neural network which is, not by accident, completely wired toward profits.
That’s why it’s not uncommon for the big trading firms to engage in serious psychological testing to determine exactly which people they want on the trading desks. And let me tell you that it’s NOT people who react to fear; it’s those who remain focused with laser-like intensity on profits and potential and who are able to control the NAcc portion of their brain.
It’s not that they don’t feel the fear that paralyzes many investors; they’ve just learned to override it. This, in turn, keeps them in the right neural circuits when they are needed most.
Speaking of which, under normal circumstances investors “get it right” about between 50%-70% on average when they’re focused on opportunity. That’s according to Boston-based DALBAR which tracks investor behavior over time using something called the “Guess Right Ratio.”
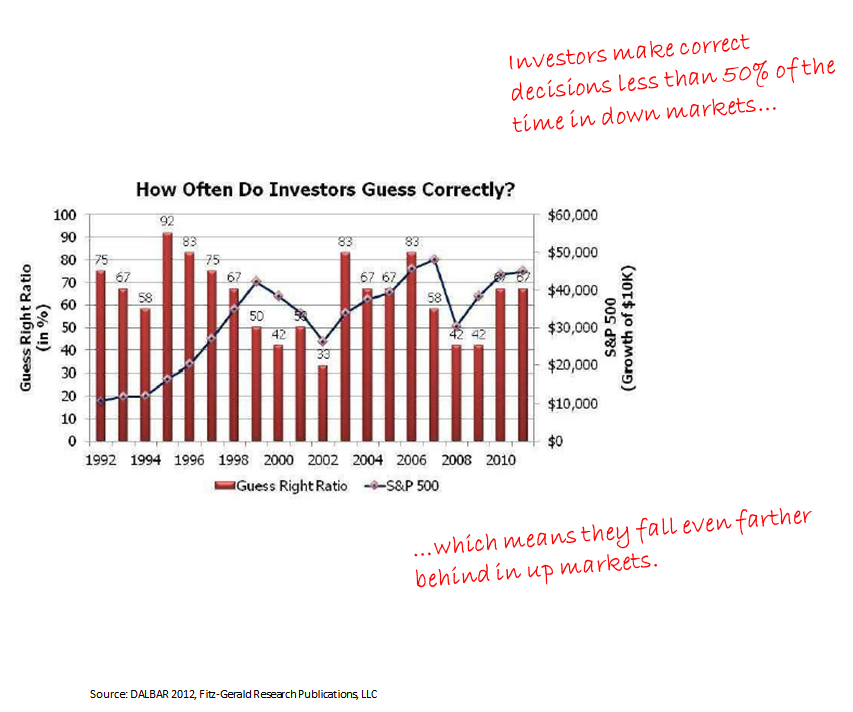
You can see very clearly that the higher percentage scores are during periods when the markets are trending like they were in the late 1990s, off the post 2002 bottom and off the March 2009 lows.
But when the markets really let loose or are reaching major inflation points like they appear to be now, that figure drops to less than 50% as fear of loss becomes the primary driver. Sometimes far less.
That’s why at those points in time, investors have a less than random probability of making a sound investment choice when the markets drop.
Now for the good news.
You can absolutely overcome the negative impact of bad decision making using a few simple tricks to override the very dangerous neural programming we are born with.
First, keep history in mind. The markets have a defined upward bias. Therefore, investing profitability is more a function of identifying periods when the markets favor upward movement and buying in. I know that sounds like timing but it isn’t; it’s more like identifying probable behavior. Generally speaking, big down days are best because of the principle of mean reversion (which is a subject that I’ll be writing about in an upcoming “Marketology” column).
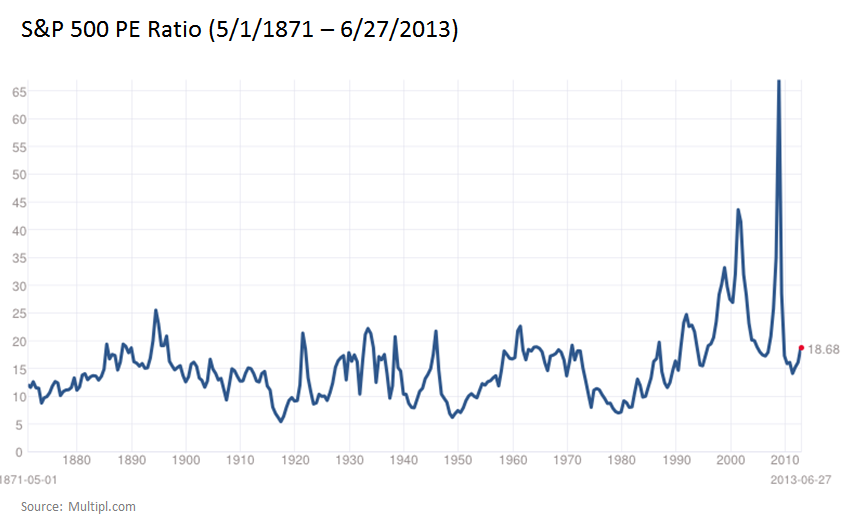
My favorite means of doing this is simple valuation. During the dot.bomb era, we saw valuations run so high that the PE ratios as measured by the S&P 500 shot over 60 times earnings. History shows that serious rallies begin when PEs are in the single digits.
Right now, the average PE for the S&P 500 is 18.68 according to Multpl.com, which is a little higher than I’d like to see but not so high as to defy putting new money to work, particularly if Team Bernanke remains accommodative.
Second, always use trailing stops to protect your capital and harvest gains. If you’re a more sophisticated investor, consider put options or even specialized inverse funds to do the same thing.
Trailing stops allow you to firmly engage the opportunity circuit of the NAcc and, in doing so, substantially diminish Wall Street’s ability to play you for a pasty by forcing you to make fear based decisions.
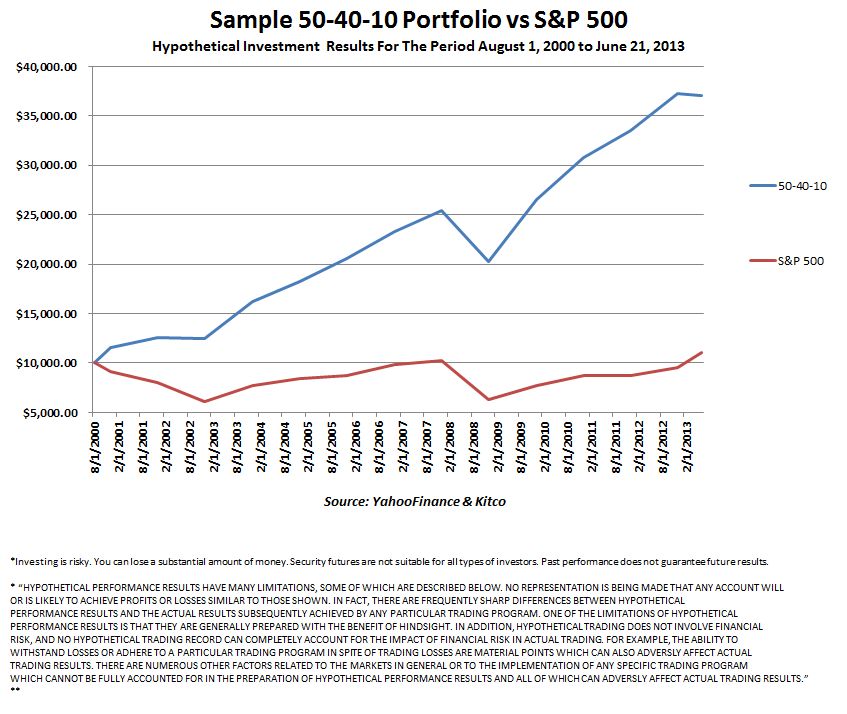
Third, develop and stick to a carefully structured, risk averse portfolio like the 50-40-10 I advocate in the Money Map Report. With its emphasis on risk averse choices, high income and rebalancing, it’s a simple very powerful tool that keeps you in the hunt for upside. This is especially true during down markets because it keeps you from disproportionately weighing the possibility of losses over gains of the same size, which is what most people do and make costly decisions.
Over time, this can really “add up” by helping you tap into profit oriented neural circuits you need to be successful…
About the Author
Keith Fitz-Gerald has been the Chief Investment Strategist for the Money Morning team since 2008. He’s a seasoned market analyst with decades of experience, and a highly accurate track record. Keith regularly travels the world in search of investment opportunities others don’t yet see or understand. In addition to heading The Money Map Report, Keith runs The Geiger Index, a reliable, emotion-free guide to making big money and avoiding losses, and Strike Force, which aims to get in, target gains, and get out clean.

I know Mike is a very solid investor and respect his opinions very much. So if he says pay attention to this or that - I will.
~ Dale G.
I've started managing my own investments so view Michael's site as a one-stop shop from which to get information and perspectives.
~ Dave E.
Michael offers easy reading, honest, common sense information that anyone can use in a practical manner.
~ der_al.
A sane voice in a scrambled investment world.
~ Ed R.

Greg Weldon

Josef Schachter

Tyler Bollhorn

Ryan Irvine

Paul Beattie

Martin Straith

Patrick Ceresna

Mark Leibovit

James Thorne

Victor Adair