

The intermediate corrective phase in North American equity markets remains intact. Short term strength provides an opportunity to reduce equity exposure, particularly in sectors that have a history of moving lower during a summer corrective phase. These sectors included industrials, consumer discretionary, materials and financials.
Selected sectors are setting up for seasonal trades this summer including fertilizers, energy and gold. They already are showing signs of outperformance relative to the S&P 500 Index and the TSX Composite Index. Stay tuned for special sector opportunities as the summer progresses.
Equity Trends
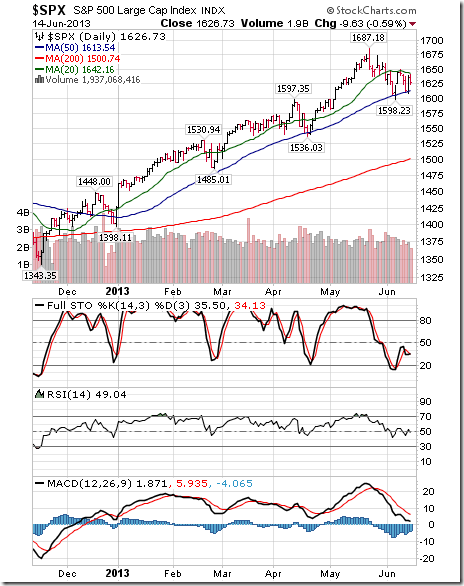
The S&P 500 Index fell 16.65 points (1.01%) last week. Trend remains up. Resistance is at its May 22nd high at 1,687.18. Support is at 1,598.23. The Index remains below its 20 day moving average, but bounced once again from near its 50 day moving average. Short term momentum indicators have declined to neutral levels.
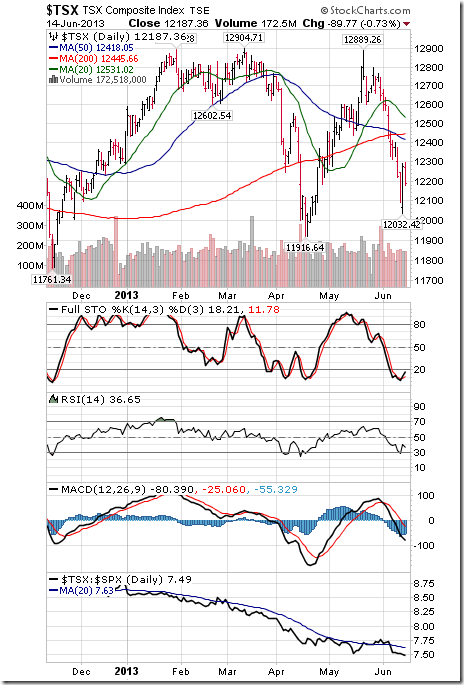
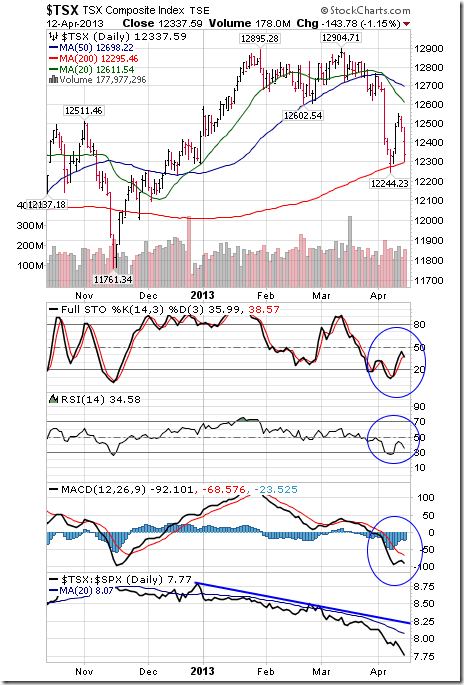
The TSX Composite Index fell 185.94 points (1.50%) last week. Trend remains down. The Index remains below its 20 day moving average and completed a “Death Cross” when its 50 day moving average fell below its 200 day moving average. Tech Talk is not a believer in the Death Cross indicators, but other technical analysts are talking about it. Strength relative to the S&P 500 Index changed from neutral to negative. Technical score based on the above indicators changed from 0.5 to 0.0 out of 3.0. Short term momentum indicators are oversold, but have yet to show signs of bottoming.
Percent of S&P 500 stocks trading above their 50 day moving average fell last week to 59.60% from 67.80%. Percent remains in a downtrend from an intermediate overbought level.
Percent of S&P 500 stock trading above their 200 day moving average slipped last week to 88.20% from 90.60%. Percent remains in a downtrend from an intermediate overbought level.
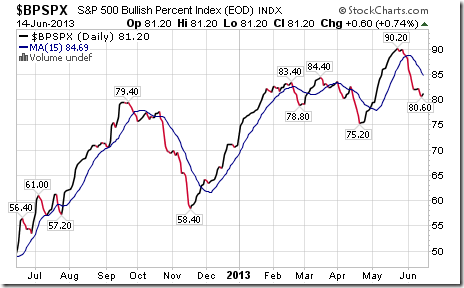
Bullish Percent Index for S&P 500 stocks slipped last week to 81.20% from 82.00% and remained below its 15 day moving average. The Index continues to trend down from an intermediate overbought level.
Bullish Percent Index for TSX Composite stocks fell last week to 59.41% from 62.76% and dropped below its 15 day moving average. The Index has resumed an intermediate downtrend.
Percent of TSX stocks trading above their 50 day moving average fell last week to 31.80% after briefly reaching a low of 24.69%. Historic data shows that the TSX Composite Index frequently bottoms on a recovery by Percent from below the 25% level.
Percent of TSX stocks trading above their 200 day moving average fell last week to 42.68% from 46.86%. Percent continues in an intermediate downtrend.
……read so much more HERE including 44 more charts.


