
Stocks & Equities
Earnings news this week is not an influencing factor on equity markets
Economic news this week is expected to confirm that U.S. economic growth continues to limp along.
Extreme inter-day fluctuations in currencies last week triggered extreme inter-day fluctuations in the Treasury and U.S. equity markets. Look for more of the same this week.
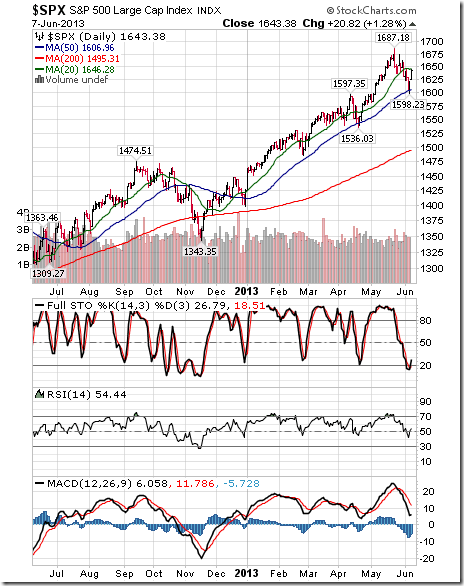
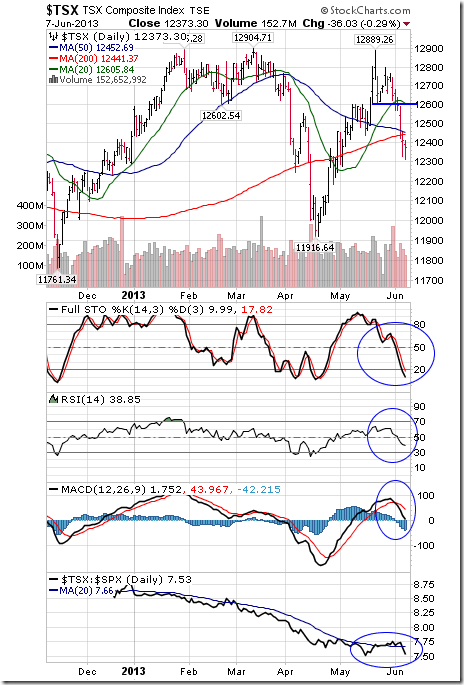
Despite gains by U.S. equity markets on Friday, short and intermediate technical signs show that U.S. equity markets (as well as equity markets in developed markets around the world) reached an intermediate peak on May 22nd. From peak to trough from May 22nd to June 6th, the S&P 500 Index dropped 5.3%, the Dow Jones Industrial Average fell 4.5% and the Dow Jones Transportation Average plunged 6.9% (The TSX Composite Index was down 4.5% during that period). Significant technical signs of a short or intermediate bottom have yet to appear.
Beyond the first couple of trading days, seasonal performance by North American equity indices in the month of June is negative. June is the second weakest month of the year for the Dow Jones Industrial Average and TSX Composite Index and third weakest month of the year for the S&P 500 Index.
The media “buzz word” is “tapering”. When will the Federal Reserve move to slow its $85 billion per month Treasury and Mortgage Backed securities purchases. When it happens, equity markets are vulnerable. Media discussion prior to the event will not help.
The Bottom Line
The intermediate corrective phase in North American equity markets remains intact. Short term strength provides an opportunity to reduce equity exposure, particularly in sectors that have a history of moving lower during a summer corrective phase. These sectors included industrials, consumer discretionary, materials and financials.
Selected sectors are setting up for seasonal trades this summer including fertilizers and gold. They already are showing signs of outperformance relative to the S&P 500 Index and the TSX Composite Index. Stay tuned for special sector opportunities as the summer progresses.
The S&P 500 Index gained 12.64 points (0.78%) last week. Trend remains up. Resistance has formed at its May 22nd high at 1,687.18. The Index remains below its 20 day moving average and bounced from near its 50 day moving average. Short term momentum indicators continue to trend down despite gains recorded on Friday.
The TSX Composite Index dropped 277.12 points (2.19%) last week. Trend changed from up to down on a move below 12,439.13. The Index fell below its 20, 50 and 200 day moving averages. Strength relative to the S&P 500 Index changed from positive to at least neutral. Technical score changed from 3.0 to 0.5 out of 3.0. Short term momentum indicators continue to trend down.
…..45 more charts and commentary HERE

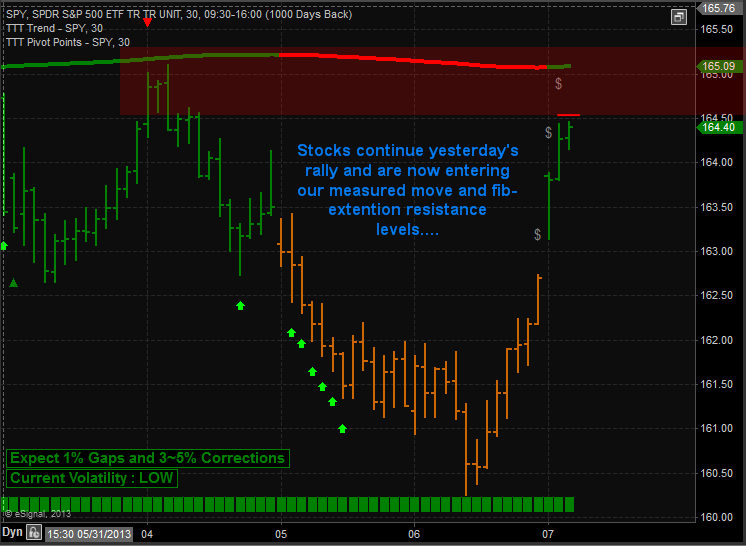
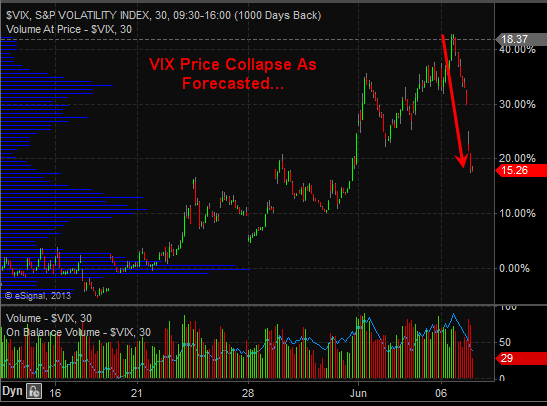
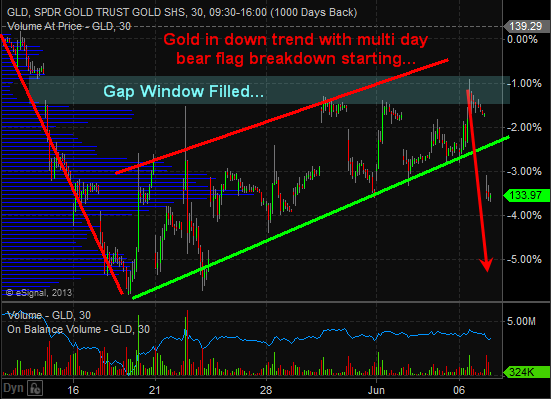
This week has played out perfectly thus far. The expected volatility of intraday price swings and lower prices for stocks has happened. The Vix has collapsed the 15% which I mentioned would happen just 2 days ago and money is flowing out of precious metals and miners today in a big way as that risk off money is now moving into Risk-On Stocks.
My partner who focuses exclusively on Small Cap Stocks and 3X Leveraged ETF’s have been cleaning up this week also. Take a look at how he How We Nailed The Market Low for 4.6% in 24 hours
I just want to mention that all markets are connected (intermarket analysis) We are long the SP500 which is how I want to play this move because it carries the least amount of risk and volatility then other investments. That being said a trade could instead short gold or short the vix. Many ways to play moves like this in the market. One thing to remember though is that each of these moves are the same trade. so buying a position in each is just multiplying your exposure and if this bottom in stocks didn’t take place you would get your head handed to you on a silver platter. Again I am here for market guidance and to share low risk setups as I see fit. You can trade all you want around analysis as many of you do on your own.
Charts Show it all in Detail below:
WATCH TODAY’S VIDEO FOR FULL EXPLANATION: HTTP://YOUTU.BE/PRLXPTFDWXI
GET THIS TYPE OF ANALYSIS MULTIPLE TIMER EACH TRADING DAY DELIVERED TO YOUR INBOX!
Chris Vermeulen

The average stock in the S&P 500 is down 4.34% since the index made an all-time closing high on May 21st. Typically during market pullbacks, the stocks that went up the most during the preceding rally end up getting hit the hardest. That hasn’t been the case during this pullback, however. We broke the S&P 500 into deciles (10 groups of 50 stocks each) based on 2013 YTD stock performance through 5/21. We then calculated the average performance of the stocks in each decile since the 5/21 market peak. As shown in the chart below, the 50 stocks in decile 1, which is made up of the stocks that were up the most YTD through 5/21, are only down an average of 3.5% since then. That makes it the best performing decile of the group during this pullback, so 2013’s big winners have not gotten hit as hard as other stocks in the index.
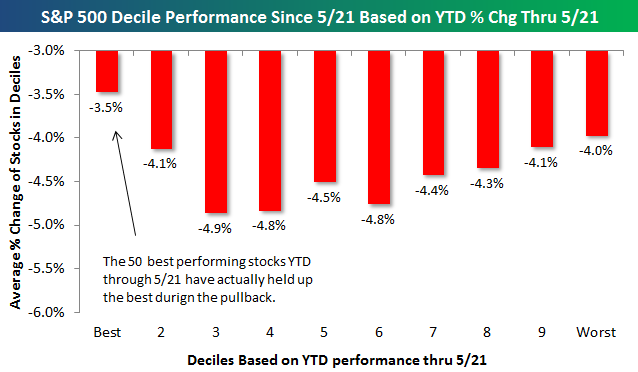
So if it’s not a “sell the winners” pullback, which stock characteristics are leading the market lower? Over at Bespoke Premium, we just published a report answering this question. To view the full report, sign up for a 5-day free trial today!
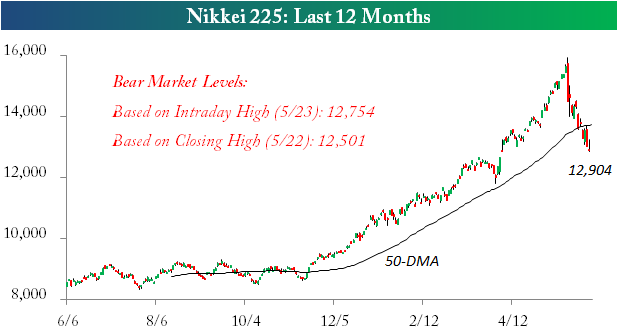
Nikkei Nears Bear Market Territory
While it was the world’s best performing equity benchmark just over two weeks ago, Japan’s Nikkei 225 has quickly moved into the doghouse of investors. In fact, with average daily moves of just under 3% since 5/23, the Nikkei is just one bad day away from moving into bear market territory.
The chart below shows the levels the Nikkei would need to trade at in order to move officially into bear market territory. Based on the intraday high from 5/23, the index is just 1.2% above the 12,754 bear market threshold. Using closing prices (our preferred method), the Nikkei has more of a cushion. In order to reach bear market territory based on closing prices, the Nikkei needs to drop 3.1% to 12,501.8. Even here, though, all it will take is one bad day before the Nikkei closes out the week in bear market territory.
It all seems so surreal. After being mesmerized by the Fed’s hallucinogenic “Quantitative Easing,” (QE) drug, and seduced by the Fed’s Zero Interest Rate Policy (ZIRP), and rescued by the Fed’s clandestine intervention in the stock index futures market, for the past 4-½-years, it’s easy to forget that there was once a time when the Fed’s main policy tool was simply adjusting the federal funds rate. It’s even harder to recall that two decades ago, the Fed’s raison d’être was combating inflation, whereas today, the Fed’s main mission is rigging the stock market, and inflating the fortunes of the wealthiest 10% of Americans.
“The central bank’s purpose is to get ahead of the inflation curve,” declared Wayne Angell, one of the seven governors of the Federal Reserve on June 1st, 1993. Angell had a reputation as a Fed hawk, and he was pushing for a tighter monetary policy, even before an uptick in the inflation rate showed-up in the government’s statistics. “If we’re ahead of the curve, our credibility and the value of our money is maintained. Some of my economist friends tell me, ‘We don’t feel much inflation out there, but we feel better knowing that you’re worried about it.” Thus, there was a time when savers received a positive rate of return on their money.
Two decades ago, the Greenspan Fed was stacked with hawkish money men. And because their tenures lasted for 14-years, they felt immune to the winds of politics. Thus, if the Fed governors were to make unpopular decisions to hike interest rates, in order to bring inflation under control, or burst asset bubbles, so be it. Of course, it’s much different today – the Fed is stacked with addicted money printers that are beholden to the demands of their political masters at the Treasury and the White House. How did Fed policy swing so radically from Angell’s day – when Fed tightening meant lifting the federal funds rate and draining excess liquidity, to today’s markets, – where a small reduction in the size of the Fed’s massive QE injections is considered to be a tighter money policy?
The Treasury Bond Vigilantes, – is a nickname that was used to refer to a legendary band of renegade bond traders, who used to fire-off warning shots to Washington, by aggressively selling T-bonds in order to protest any monetary or fiscal policies they considered inflationary. The jargon refers to the bond market’s ability to serve as a brake on reckless government spending and borrowing. The last major sighting of the bond vigilantes was in Europe, as they wrecked havoc upon the debt markets of Greece, Ireland, Italy, Portugal, and Spain.
James Carville, a former political adviser to President Clinton famously remarked at the time that “I used to think that if there was reincarnation, I wanted to come back as the president or the pope or as a .400 baseball hitter. But now I would like to come back as the bond market. You can intimidate everybody,” he remarked. However, the so-called T-bond vigilantes appeared to be dead and buried over the past few years, as the US-Treasury was able to borrow trillions of dollars, largely financed by the Fed at the lowest interest rates in history. Keeping the T-bond vigilantes on ice, is a key linchpin of the Fed’s Ponzi scheme, that’s used to inflate the value of the US-stock market and keep it perched in the stratosphere.
However, last month, (May ’13), something very strange began to happen. It looked as though the long dormant T-bond vigilantes were suddenly beginning to awaken from their slumber. Indeed, – the long-end of the US Treasury bond market suffered its worst monthly decline in 2-½-years, as yields jumped to their highest levels in 13-months. Ticker symbol TLT.N, – the iShares Barclays 20+ Year Treasury Bond fund lost -7% of its market value. It looked as though Wall Street’s bond dealers were whittling down their holdings of T-bonds, – acting upon insider information from the New York Fed, – that the biggest buyer in the T-bond market could soon reduce the size of its monthly purchases and thereby cause T-bond prices to fall. Interestingly enough, T-bond yields jumped +50-bps higher even though US-government apparatchiks said inflation was only +1% higher than a year ago.
During Greenspan’s tenure, the Fed would try to push T-bond yields higher, by lifting the overnight federal funds rate. But in today’s hallucinogenic world of QE, – near zero-percent short-term T-bill rates, and historically low bond yields, – if the Fed begins to reduce the monthly size of its T-bond purchases in the months ahead, – it could have the same effect as a quasi tightening. That’s because the Fed has so badly distorted and inflated market prices over the last few years. If the heavy hand of the Fed is gradually withdrawn from the marketplace, the big question is: what would it mean for the $21-trillion US-equity market?

The Bernanke Fed is coming under increasing criticism. On May 29th, the 85-year old icon of central banking, – the greatest warrior against inflation in US-history, – former Fed chief Paul Volcker waded into the debate over when the Fed should start unwinding its radical QE operation, arguing that the “benefits of bond-buying are limited and is like pushing on a string.” Volcker launched a scathing critique of the Bernanke Fed, inferring the central bank had become a serial bubble blower. “The Fed is effectively acting as the world’s largest financial inter-mediator. The risks of encouraging speculative distortions and the inflationary potential of the current approach plainly deserve attention,” he warned.
Volcker reminded the new breed of Fed lackeys that the central bank’s basic responsibility is to maintain a “stable currency,” and that it should unwind its reckless scheme of massively increasing the US-money supply and blowing bubbles in the stock market. “Credibility is an enormous asset. Once earned, it must not be frittered away by yielding to the notion that a little inflation right now is a good a thing, a good thing to release animal spirits and to pep up investment. The implicit assumption behind that siren call must be that the inflation rate can be manipulated to reach economic objectives. Up today, maybe a little more tomorrow and then pulled back on command. Good luck in that. All experience demonstrates that inflation, when fairly and deliberately started, is hard to control and reverse,” Volcker warned.
Last week, the Treasury’s 10-year yield climbed above the 2%-level, following Volcker’s remarks. The 85-year old Fed hawk still commands a lot of respect on Wall Street and his voice is not easy for the Fed’s rookies to tune out. The recent plunge in T-bond prices did trigger a knee-jerk sell-off in the stock market, that briefly knocked the Dow Industrials lower to the 15,100-level. But in a June 3rd note, Goldman Sachs (GS) released a message to the financial media, telling investors to remain calm amid the bond market sell-off. GS reiterated its Bullish stance on the US-stock market, – saying further gains lie ahead, and that S&P-500 companies have plenty of cash on hand, that can be deployed to offset the negative effect of higher interest rates, – by increase their dividends +11% this year and +10% in 2014. If correct, that would lift the S&P-500’s dividend yield to a meager 2.3-percent.
Still, yields on 10-year T-Notes increased by a half-percent in the month of May, including a jump of +16-bps on May 28th, – seen as a signal that the Fed’s would scale back its QE-injections. “A slowing in the pace of purchases could be viewed as applying less pressure to the gas pedal, rather than stepping on the brake,” said Kansas City Fed chief Esther George on June 4th. “It would importantly begin to lay the groundwork for a period when markets can prepare to function in a way that is far less dependent on central bank actions and allow them to resume their most essential roles of price discovery and resource allocation. I support slowing the pace of asset purchases as an appropriate next step for monetary policy. Waiting too long to prepare markets for more-normal policy settings carries no less risk than tightening too soon,” Ms George added. The Kansas City Fed chief cited signs of overheating markets, including margin loans at broker-dealers at a record $384-billion in April.
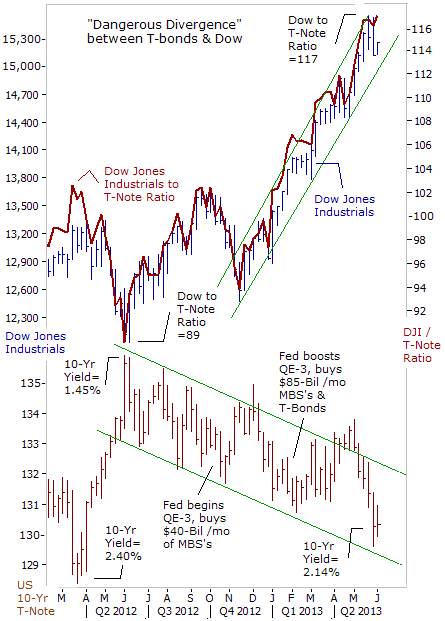
“We cannot live in fear that gee whiz the stock market is going to be unhappy that we are not giving them more monetary cocaine,” added Dallas Fed chief, Richard Fisher on June 4th. Still, many traders don’t believe that the Bernanke Fed could ever kick the QE-habit and act to tighten the money spigots. Since May ’12, traders have played the “Great Rotation” – shifting out of bonds and moving into stocks, seen as the best way to profit from the Fed’s radical schemes. However, there’s a good chance that going forward – the “Great Rotation” could morph into the “Dangerous Divergence.” If left unchecked, an extended slide in the T-bond market could trigger an upward spiral in the 10-year yield towards 3-percent, which in turn, would threaten to blow up the Fed’s Ponzi scheme.
Already, the ratio between the value of the Dow Industrials and 10-year T-note futures has reached the 116-level, – doubling from the 58-level – where it bottomed out in March ’09, and is within striking distance of its 2007 high. A last gasp rally in the US-stock market could be the catalyst that triggers a sharp sell-off in T-notes. At that point, the “Dangerous Divergence” could reach the breaking point, leaving the bond vigilantes to do their dirty work.
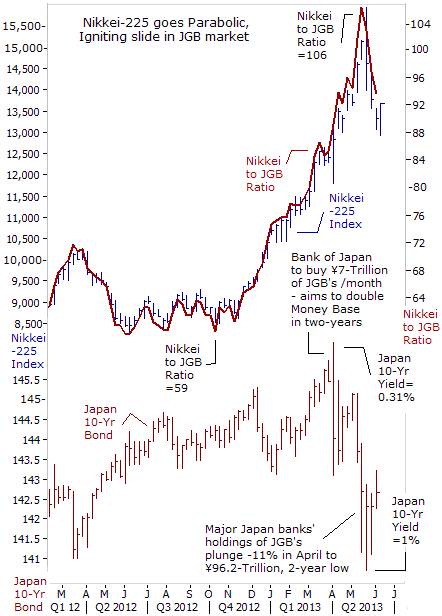
Minor Earthquake in Tokyo Bond market, – The recent sharp slide in US T-Notes was preceded by a tremor in the world’s second largest bond market in Tokyo. On April 4th, the Bank of Japan’s (BoJ) new governor, Haruhiko Kuroda, unveiled the most radical scheme ever, – designed to “shock and awe” Japanese bond traders into complete submission. The BoJ said it would double the amount of yen in circulation over the next two years, in order to whip-up inflation in the world’s third largest economy. The BoJ said it would trump the Fed, by printing ¥7-trillion each month, to be used to buy Japanese government bonds (JGB’s).
The BoJ was certain that it could continue to arm-wrestle Japanese banks and persuade its loyal citizens into buying 10-year JGB’s at yields of less than 1%, even as the BoJ says its aim is weaken the value of the Japanese yen, increase the costs of imports, and increase the consumer inflation rate to +2%. In other words, the BoJ expects investors to lock in negative yields for the next ten years. However, the gambit began to backfire, when yields on 10-year JGB’s rebounded from a historic low of 0.315% and surged to as high as 1% on May 23rd, – triggering a -7.3% crash in the Nikkei stock index. It was the Nikkei’s biggest one-day fall in 2-years, and kicked off an extended -17.5% slide to 13,050 by June 3rd.

It was later revealed on May 30th, that Japan’s biggest banks decided to slash their holdings of JGB’s to ¥96.3-Trillion, in the month of April, – a sign that their selling played a major role in pushing up yields to 1%. Japanese banks were unusually rebellious, and dumped 11% of their JGB’s holding onto the BoJ’s balance sheet, fearing a major rout in the future. For the BoJ, trying to force JGB yields lower, when its trying to weaken the value of the yen and whip-up inflation, – is like trying to submerge a helium balloon under water.
If this exodus from the JGB market continues, it could blow apart the BoJ’s Ponzi scheme. Japan’s outstanding debt is equivalent to 245% of its annual economic output, and 92% of the debt has been financed by domestic savings. But this may not continue. A government panel’s draft report has reportedly warned that there is “absolutely no guarantee” that domestic investors will keep financing government debt. The BoJ has calculated that a rise in JGB yields of just 1% would lead to market losses equivalent to 10% of the core capital for the top Japanese banks, and 20% losses for the smaller regional banks.
So far, the immediate impact of the BoJ’s Big-bang QE scheme has been a rapid and parabolic rise in Tokyo stock prices. These increases were fuelled by a frenzy of speculation by foreign traders. But rather than reflecting an economic recovery, the booming share markets are indicative of what the former-CEO of Citigroup, Chuck Prince, famously noted in July 2007, “As long as the music is playing, – you’ve got to get up and dance.” Nikkei Bulls are hopeful that the BoJ can keep the music playing, by boosting the size of its monthly JGB purchases if necessary. However, Tokyo cannot act in a vacuum – it would have to receive permission for an expanded QE scheme from its “Group-of-Seven” co-conspirators. And that’s unlikely.
“Stock markets are under the spell of QE,” In fact, both the BoJ and the Fed are in the crosshairs of the Bank for International Settlements (BIS), which warned on June 2nd, about the dangers of their ultra-cheap money policies that are driving up stock prices, despite worsening economic news. “Investors have ignored poor economic news as stocks have risen, leaving markets vulnerable to unsettling volatility and potential losses. Excessive monetary easing helped market participants to tune out signs of a global growth slowdown. But the rapid gains left equity valuations vulnerable to changes in sentiment, as witnessed in the recent bout of volatility in Japan,” the BIS warned.
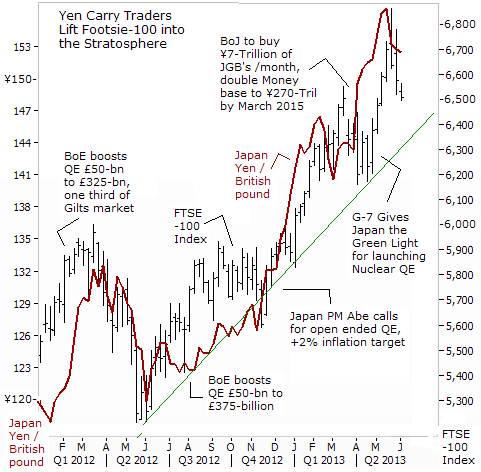
“Yen Carry” Trade lifts London Stock Exchange, “With yields in core bond markets at record lows, investors turned to lower-rated European bonds, emerging market paper and corporate debt to obtain yield. Abundant liquidity and low volatility fostered an environment favoring risk-taking and yen carry trade activity,” the BIS noted. Whether by extraordinary good luck, or by clever design, the FTSE-100 index didn’t need the help of the Bank of England’s (BoE) money printing machine, in order to climb sharply higher to the 6,800-level this year. Instead, the Footsie hitched a ride to the rising tide of liquidity flowing from Tokyo, – via the “yen carry” trade. It was a smart move by the BoE to kick the QE-habit back in November. The maneuver provided a solid foundation for the British pound to rally strongly against the Japanese yen, thereby encouraging carry traders to borrow cheaply in yen, and plow the cash in high yielding Footsie blue chips.
In its report, the BIS went on to say that stock markets “are under the spell of monetary easing to the point where negative news such as downbeat economic data doesn’t stop stocks from going up. Every time an economic indicator disappointed, traders simply took that as confirmation that central banks would continue to provide stimulus,” such as near zero percent interest rates or QE schemes that increase the supply of money in the economy.
Such was the case on June 3rd – when the ISM’s index of US-factory activity fell to a reading of 49 in the month of May, down from 50.7 in April. That’s the lowest level in nearly four years and the reading under 50 indicates contraction. The unexpected drop in the headline figure reflected contractions in both the new orders index which fell to 48.8 in May from 52.3 in April, while the production index plunged to 48.6 from 53.5. Europe remains mired in recession and is buying fewer US-goods. In the first three months of this year, US- exports to Europe fell -8% compared with the same period a year ago. Despite the negative news, the Dow Jones Industrials soared to the 15,300-level, as traders reckoned the Fed would utilize it as an excuse to continue to print $85-billion per month of high octane liquidity.
BIS warns Bondholders – prepare for further losses, – However,Stephen Cecchetti, head of the BIS monetary and economic department, issued a warning to bankers and wealthy investors to prepare for an eventual normalization of interest rates that would cause additional losses for bond holders. “The losses, when they do occur, will be spread across banks, households and industrial firms.” He stressed it’s important that banks make sure their finances are strong enough before central banks end their QE programs and start raising interest rates. “Robust balance sheets with high capital buffers are the best ways to guard against the possible disruptions that this can bring,” he said.
On May 22nd, Bank of Korea Governor Kim Choong Soo also warned that when the Fed pullbacks from QE, it would spur risks worldwide from rising bond yields. “If the Fed begins to exit from quantitative easing policies, the world will be facing interest-rate risks, in terms of how much would bond yields rise,” he said. Also, IMF economists warned in May that a “potential sharp rise in long-term interest rates could prove difficult to control.”
Thus, while Goldman Sachs might be proven correct, and that another upward leg for the 51-month old Bull market still lies ahead, in the humble opinion of the Global Money Trends newsletter, it’s best to heed the advice of the legendary trader, Bernard Baruch, “I’ll give you the bottom 10% and the top 10% of any move, if I get to keep the middle 80%.” In other words, for “Buy-and-Hold” investors, it’s a better strategy is to take advantage of any possible rally in the US-stock market to lighten up on long positions, rather than to add any new long positions at the tail end of a bubble.
———————————————————————————
This article is just the Tip of the Iceberg of what’s available in the Global Money Trends newsletter. Global Money Trends filters important news and information into (1) bullet-point, easy to understand reports, (2) featuring “Inter-Market Technical Analysis,” with lots of charts displaying the dynamic inter-relationships between foreign currencies, commodities, interest rates, and the stock markets from a dozen key countries around the world, (3) charts of key economic statistics of foreign countries that move markets.
Subscribers can also listen to bi-weekly Audio Broadcasts, posted Monday and Wednesday evenings, with the latest news and analysis on global markets. To order a subscription to Global Money Trends, click on the hyperlink below,
http://www.sirchartsalot.com/newsletters.php
or call 561-391- 8008, to order, Sunday thru Thursday, 9-am to 9-pm EST, and on Friday 9-am to 5-pm.
This article may be re-printed on other internet sites for public viewing, with links to:
http://www.sirchartsalot.com/newsletters.php
Disclaimer: SirChartsAlot.com’s analysis and insights are based upon data gathered by it from various sources believed to be reliable, complete and accurate. However, no guarantee is made by SirChartsAlot.com as to the reliability, completeness and accuracy of the data so analyzed. SirChartsAlot.com is in the business of gathering information, analyzing it and disseminating the analysis for informational and educational purposes only. SirChartsAlot.com attempts to analyze trends, not make recommendations. All statements and expressions are the opinion of SirChartsAlot.com and are not meant to be investment advice or solicitation or recommendation to establish market positions. Our opinions are subject to change without notice. SirChartsAlot.com strongly advises readers to conduct thorough research relevant to decisions and verify facts from various independent sources. Copyright © 2005-2013 SirChartsAlot, Inc. All rights reserved.
Brooke discusses the overall health of the S&P 500 in the first 3 minute video. Despite the market not being “broken,” it is prone to a correction. After a short-term opportunity from the last few days in June to mid-July, the market enters into two months, August and September that can be a negative combination.
In 3 minute Video (2 below, ) Brooke discusses the following Sectors:
-PotashCorp
-Agrium
-Gold
-Energy
-Fixed Income
-Biotech

-
I know Mike is a very solid investor and respect his opinions very much. So if he says pay attention to this or that - I will.
~ Dale G.
-
I've started managing my own investments so view Michael's site as a one-stop shop from which to get information and perspectives.
~ Dave E.
-
Michael offers easy reading, honest, common sense information that anyone can use in a practical manner.
~ der_al.
-
A sane voice in a scrambled investment world.
~ Ed R.
Inside Edge Pro Contributors

Greg Weldon

Josef Schachter

Tyler Bollhorn

Ryan Irvine

Paul Beattie

Martin Straith

Patrick Ceresna

Mark Leibovit

James Thorne

Victor Adair