

Earnings news this week is not an influencing factor on equity markets
Economic news this week is expected to confirm that U.S. economic growth continues to limp along.
Extreme inter-day fluctuations in currencies last week triggered extreme inter-day fluctuations in the Treasury and U.S. equity markets. Look for more of the same this week.
Despite gains by U.S. equity markets on Friday, short and intermediate technical signs show that U.S. equity markets (as well as equity markets in developed markets around the world) reached an intermediate peak on May 22nd. From peak to trough from May 22nd to June 6th, the S&P 500 Index dropped 5.3%, the Dow Jones Industrial Average fell 4.5% and the Dow Jones Transportation Average plunged 6.9% (The TSX Composite Index was down 4.5% during that period). Significant technical signs of a short or intermediate bottom have yet to appear.
Beyond the first couple of trading days, seasonal performance by North American equity indices in the month of June is negative. June is the second weakest month of the year for the Dow Jones Industrial Average and TSX Composite Index and third weakest month of the year for the S&P 500 Index.
The media “buzz word” is “tapering”. When will the Federal Reserve move to slow its $85 billion per month Treasury and Mortgage Backed securities purchases. When it happens, equity markets are vulnerable. Media discussion prior to the event will not help.
The Bottom Line
The intermediate corrective phase in North American equity markets remains intact. Short term strength provides an opportunity to reduce equity exposure, particularly in sectors that have a history of moving lower during a summer corrective phase. These sectors included industrials, consumer discretionary, materials and financials.
Selected sectors are setting up for seasonal trades this summer including fertilizers and gold. They already are showing signs of outperformance relative to the S&P 500 Index and the TSX Composite Index. Stay tuned for special sector opportunities as the summer progresses.
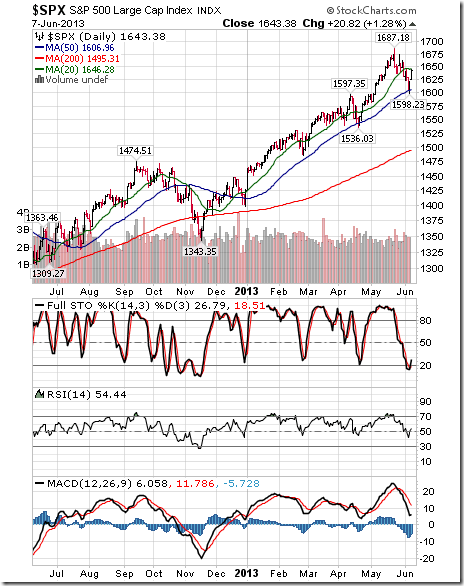
The S&P 500 Index gained 12.64 points (0.78%) last week. Trend remains up. Resistance has formed at its May 22nd high at 1,687.18. The Index remains below its 20 day moving average and bounced from near its 50 day moving average. Short term momentum indicators continue to trend down despite gains recorded on Friday.
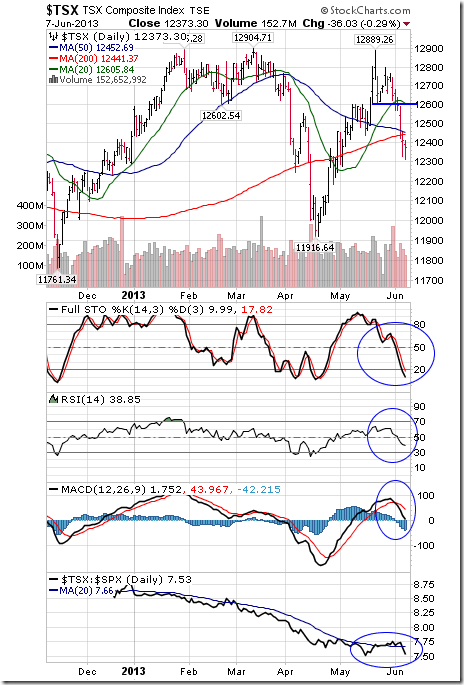
The TSX Composite Index dropped 277.12 points (2.19%) last week. Trend changed from up to down on a move below 12,439.13. The Index fell below its 20, 50 and 200 day moving averages. Strength relative to the S&P 500 Index changed from positive to at least neutral. Technical score changed from 3.0 to 0.5 out of 3.0. Short term momentum indicators continue to trend down.
…..45 more charts and commentary HERE


