
Stocks & Equities
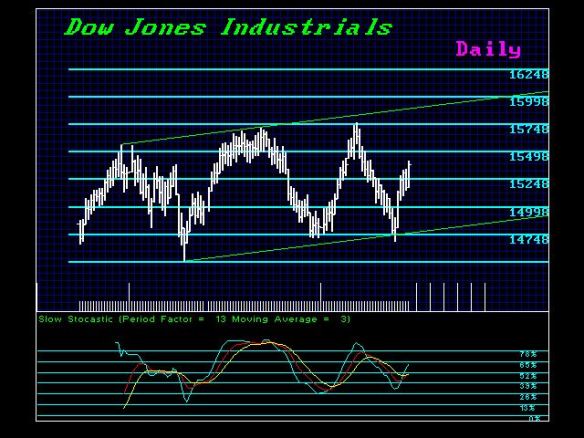
The fundamentals are really worthless because you can always extract just the ones to support your current view to “talk your own book” as they say. The Dow Jones Industrials bottomed within the channel nicely on the daily level and the target was on point as well the first week of October – the 9th (see Array). This is NOT a pattern of a major top. This is a basing pattern and equities may be the last savior we have. If you cannot store gold, you cannot keep excess money in a bank, and if you are European, well you may just have to get as much out of Europe as you possibly can – equities are movable, transportable, and liquid.
This is why I do not like people who try to pretend the sale in gold on Friday was not real. It is better to realize the trend so you DO NOT buy losing your shirt and then lose confidence or your marriage because you followed some gold “analyst” who just talks it up and his own self-interest. If the market is doing something you think is wrong, well may be you better check you logic.
More from Martin:
IMF Reports
The Solution

For some perspective on the current government shutdown and threat of default, today’s chart plots the weekly Gallup Economic Confidence Index. As today’s chart illustrates, economic confidence was trending higher and making post-financial crisis highs as late as June 2013. Then the government stepped in. Since that peak, confidence dropped significantly only to accelerate beginning in late September as the government shutdown appeared imminent and a potential default approached. So even what amounts to a ‘partial’ government shutdown and a ‘mere’ threat of default has already had an impact on US economic confidence (other issues such as reduced GDP growth, furloughed workers, potential credit rating cuts, reduced global standing, etc. notwithstanding). Reduced economic confidence can encourage consumers to spend less which can in turn slow an already sluggish job market.
Notes:
Where’s the Dow headed? The answer may surprise you. Find out right now with the exclusive & Barron’s recommended charts of Chart of the Day Plus.
Quote of the Day
“Everything is changing. People are taking their comedians seriously and the politicians as a joke.” – Will Rodgers
Events of the Day
October 24, 2013 – United Nations Day
Stocks of the Day
— Find out which stocks investors are focused on with the most active stocks today.
— Which stocks are making big money? Find out with the biggest stock gainers today.
— What are the largest companies? Find out with the largest companies by market cap.
— Which stocks are the biggest dividend payers? Find out with the highest dividend paying stocks.
— You can also quickly review the performance, dividend yield and market capitalization for each of the Dow Jones Industrial Average Companies as well as for each of the S&P 500 Companies.
Mailing List Info
Chart of the Day is FREE to anyone who subscribes.
To ensure email delivery of Chart of the Day, add mailinglist@chartoftheday.com to your whitelist.
Subscribe to Free Chart of the Day

Barring a last minute fly in the ointment, it appears that there will be some sort of Debt Ceiling deal in the U.S. Equity markets over the last week have already discounted this outcome by bidding up prices.
So, clear sailing ahead?
Not really.
In fact, from an investment perspective, the whole Debt Ceiling / Government Shutdown debate has been a red herring. There has been almost no surprise element or unknown factors with respect to these debates. We have had a dozen networks literally giving us play-by-play coverage over the last three weeks. The markets tend to hate real surprises, not slow-motion train wrecks that we can see from miles away.
What IS more important to equity markets over the next month is the level of corporate earnings; specifically corporate earnings for the 3rd quarter. It is not as racy and dramatic as political warfare, but the earnings have a greater bearing on the long-term direction of stock prices.
And how are 3rd quarter earnings looking? On the surface, they are not bad. However, companies have been warning of earnings that would be less than initial analysts’ expectations for a couple of months now. As a result, the hurdle is not that high. With expectations lowered, it may appear to be a reasonable “earnings season.”
Unfortunately, that does not change the fact that U.S. corporate earnings are almost unchanged over the last year while the U.S. equity markets are up about 15% over the same period!
The Price-Earnings graph for the S&P 500 almost perfectly overlays the actual graph of the S&P 500, clearly indicating that earnings have been stuck in neutral for the entire year.
The longer that equity markets remain elevated without an eventual corresponding increase in earnings, the greater the chance that prices will come down.
And, the best way to avoid going out with the tide in that scenario is to find individual companies with better-than-average earnings results and earnings growth, or defensive stocks that can maintain their profit margins and may attract a safety premium as a result.
The opinions expressed in this report are the opinions of the author and readers should not assume they reflect the opinions or recommendations of Richardson GMP Limited or its affiliates. Assumptions, opinions and estimates constitute the author’s judgment as of the date of this material and are subject to change without notice. We do not warrant the completeness or accuracy of this material, and it should not be relied upon as such. Before acting on any recommendation, you should consider whether it is suitable for your particular circumstances and, if necessary, seek professional advice. Past performance is not indicative of future results.
Richardson GMP Limited, Member Canadian Investor Protection Fund.
Richardson is a trade-mark of James Richardson & Sons, Limited. GMP is a registered trade-mark of GMP Securities L.P. Both used under license by Richardson GMP Limited.

I’d like to reveal a prediction today: The Dow Jones Industrial Average will lead the way higher and catapult to 31,000 over the next three years. That’s right — the U.S. large-company benchmark will double.
Have I lost my mind? Am I a perennial stock-market bull?
No. Quite to the contrary, I’m the only analyst I know of who understands the forces that are building to send the Dow rocketing higher. And my best forecasts have always been accompanied by the shrill voices of others telling me I’m nuts.
Moreover, I am not a perma-bull. I foretold of the 1987 crash months ahead of time. I forecast the 1999-2000 top in the Nasdaq and the Dow. I predicted the crash of 2008.
And if I didn’t know better, I’d throw my hat in the ring with all those pundits out there who say the economy is not strong enough and interest rates are rising, so the Dow must crash.
But, I must say, I do know better. The fact of the matter is that the Dow is going to reach 31,000 over the next three years.
Not in spite of gargantuan federal debts, not in spite of dysfunction in Washington, not in spite of dysfunction of the mess in Europe and Japan, not in spite of dysfunction of the falling value of the dollar and other currencies … but because of them.
 I know better because, for 35 years, I’ve traveled the world and studied every major market and economic system. I have charted how they interact and influence one another. And I’m an avid student of the history of markets.
And the fact of the matter is this: If you understand the way capital flows like a powerful undercurrent through the world, and if you understand the significance of rising interest rates, then I promise, you will be well-positioned to make a fortune over the next few years as most U.S. stocks soar higher.
Here is what you need to know to take advantage of it:
First, rising interest rates will be one of the major reasons the Dow and other broad market indices explode higher. To the contrary of many of the best minds on — and off — Wall Street, rising interest rates are no reason to be worried about the stock market and, in fact, are the opposite: Explosive fuel that will drive stocks much, much higher.
How so? There are three chief reasons.
1. Rising interest rates are a sign that there is stronger demand for money and credit. That’s a positive. In addition, rates are now so far below the real rate of inflation, they would have to catapult to better than roughly 10 percent before they even came close to making a dent in the stock market.
2. Rising interest rates are also a sign that bond values are going to be heading down — and quite dramatically. As investors leave the bond market, they will have to put their money to work in other asset classes.
Commodities will eventually be a recipient of that capital flow out of bonds. But the biggest asset class that will experience massive capital inflows from plunging bond prices will be the stock market. It’s the only market that can handle the depth and liquidity of trillions of dollars of capital that needs to be invested.
And it won’t just be capital flowing out of U.S. sovereign bonds. There will be trillions more flowing out of European sovereign debt when the next shoe drops in Europe, and that isn’t too far off.
3. Unlike when interest rates rise solely due to a healthy growing economy, this time around rates will rise because of a crisis in confidence in government.
Sounds bad, right? After all, if governments are collapsing and rates are rising as a result, stocks must crash too, right? Wrong. Dead wrong. Which brings me to the next major reason why the Dow will explode to 31,000 over the next three years.
Second, collapsing governments in Europe and the United States will be just about the best thing that could happen for the U.S. stock market. I know what you’re thinking: That’s a pretty bold, almost unbelievable, statement. Larry has definitely lost his marbles, you might be thinking.
But mark my words: As Western governments and their largely socialist and huge entitlement programs shrink and even go bust, the private sector will become the recipient of a tsunami of cash otherwise eaten up by the public sector. And that will send stocks into an explosive move higher.
There’s more. As Western governments teeter and the banking system crashes again — and it will — stocks will be deemed to be a safe place to put your money than just about anything else. After all, just look at the Cyprus confiscation of bank depositor money earlier this year. Banks will not be bailed out in the next crisis, and depositors everywhere will be bailed in.
Why keep your money in a bank, then, when there’s no safety to be found and, instead, large amounts of your capital will be deemed to be bank creditor funds?!
Want proof of all the above? Just look at the 1932 to 1937 time period and what most analysts are not telling you about the Great Depression.
Back then, U.S. and European economies were plummeting into a depression. Unemployment continued to soar. And interest rates began to climb for the very same reasons I just cited: Primarily because 17 nations in Europe were going bankrupt, defaulting on their sovereign bonds.
And though the U.S. was the world’s creditor then, its bond markets also came under suspicion. Banks were folding left and right in Europe and the U.S.
Tens of billions of dollars fled the sovereign bond markets — and the banking system — and went directly into U.S. stock markets.
Despite the worsening global economy, the Dow Jones Industrials soared 382 percent from a low of 40.56 in July 1932 to a high of 195.59 in March 1937.
All in the middle of the worst depression in our nation’s history!
And all of my indictors and studies tell me that the Dow’s 2009 crash low of 6,495 is tantamount to the 1929 crash low in the Dow.
And a similar 382 percent gain from that low would put the Dow Industrials just north of 31,000.
Thing is, Dow 31,000 is my minimum target. Why?
Because unlike the 1932 to 1937 period when it was primarily the governments and banking system of Europe that were going down the drain, this time around the governments and banking system of the U.S. and Japan will also collapse, adding fuel to the fire as capital stampedes away from the public sector and from banks in droves … and into the welcoming arms of commodities and stocks.
What about the correction we’re now seeing in the stock market, and where do the commodity markets stand right now as well?
The pullback we’re seeing in the Dow was way overdue and is merely a healthy correction. It’s the pullback I have been expecting. There is no, I repeat, no risk of a crash.
The maximum downside in the Dow, according to my models, is roughly 13,623.
If it gets that low, be ready to back up the truck and buy. These days the Dow is at about 15,200.
As for commodities, they are now in the final phase of their three-year correction. We should see final bottoms come into play in everything from gold to oil to rice by January. Then commodities will begin a moon shot higher, with gold leading the way.
Best wishes and stay tuned.
Your not-so-crazy but definitely unconventional analyst,
Larry
Stock Market Appears Ready for New High – What Impact Could It Have on Gold?
On Monday, after weekend talks failed to reach a solution that would reopen the federal government and raise the federal borrowing limit by October 17, the S&P 500 Index dropped to its intraday low below 1,700. However, the index reversed course early in the afternoon on a report that President Barack Obama planned to meet with Congressional leaders from both parties at the White House later in the afternoon.
According to Reuters, yesterday Senate leaders made progress on a U.S. debt deal. Additionally, today they may reach an agreement to bring a halt to the fiscal standoff. The emerging deal would avoid a potential default, end the 15-day-old government shutdown and change the immediate deadlines in favor of three new ones over the next four months.
Although it’s far from complete as the Senate may delay passing the plan and House Republicans may seek to block or change it, investors still believe that an extension to the debt ceiling, or at least a resolution that buys more time, is highly likely. So do we – no matter how the authorities decide to call it, we think that more money will be available. Printing it is just too easy politically.
Yesterday, the S&P 500 rose for a fourth day and closed at the highest level since September 19. It’s worth noting that the index is within 16 points of its September 18 record of 1,725.52. The S&P 500 has advanced 3.3% in the last four trading sessions and this is its biggest four-day rally since January.
The rally in stocks seems to have triggered a decline in the precious metals sector and the following stocks’ moves could further contribute to metals’ performance.

Looking at the above chart, we see that the move below the rising medium-term support line was quickly invalidated and the outlook improved dramatically based on Thursday’s session.
The official reason was “signs of progress in negotiations to raise the U.S. debt limit, at least temporarily.”
In our view, it’s almost certain that the debt ceiling will be raised, and the only unknown is the justification that politicians will use to do it this time. Therefore, we can expect stocks to rally further as the market becomes more optimistic about it. As mentioned earlier, yesterday the S&P 500 rose for a fourth day and closed at the highest level since September 19, which confirms the above assumption.
In the previous week, gold’s reaction was quite interesting – it didn’t rally even though the additional perceived probability of the increase in the debt limit should trigger such a move. This time, markets seem to have focused on this piece of information as a relief, and people sold gold, which is no longer needed as a hedge – at least a lot of investors seem to have thoughts like that.
The implications for gold are bearish, and this makes them bearish also for the rest of the precious metals sector, although to a smaller extent.
Let’s take a look at the short-term outlook.
 The invalidation of the breakdown is quite clear on the above chart, but since we already covered it above, we will now focus on something else.
Another important thing to be noticed here is that declining stock prices didn’t trigger a rally in the precious metal market. The only way in which the declining stocks managed to impact the precious metal market was to decrease the pace of the metals’ and miners’ decline. On a side note, our Stock Trading Alert subscribers remained updated throughout Thursday’s volatile session (4 alerts were published on Thursday; the first one is available publicly and its description in the list of alerts is accompanied by an arrow summarizing the outlook – it was green and pointing upward before Thursday’s session – for the first time in a week and a half).
Let’s turn now to the financial sector, which in the past used to lead the rest of the general stock market.
 On the above chart we clearly see that, in spite of the recent downward move, the financial stocks didn’t invalidate the breakout above the level of 130. This was a subtle indication that a bigger decline would not be seen on the stock market.
Consequently, the medium-term outlook remains bullish. Please note that since the support created by the 2011 high is relatively close, we will likely not see another major decline.
With a bullish outlook for the stock market, it seems that the decline in the precious metals stock market can continue in the medium term.
But how are stocks performing relative to gold – particularly: gold stocks? Let’s move on to the gold stocks:gold ratio. We think that this is another interesting chart that may provide important clues about further movements in the precious metals.
At the beginning of the previous week the HUI:gold ratio declined sharply and moved visibly below its 2013 lows. In other words, we saw a major breakdown in this important ratio and it seems that the ratio is on its way to the 2000 low at 0.133.
Please note that the significant underperformance of the ratio was the thing that preceded the April plunge earlier this year. Of course, it doesn’t mean that metals or miners have to move lower immediately, but in our view, it’s just a matter of time.
Summing up, the long-term, medium-term and short-term outlooks for the stock market are bullish, and the implications for the precious metals sector are bearish.
Thank you for reading. Have a great and profitable week!
Przemyslaw Radomski, CFA
Founder, Editor-in-chief
Gold Price Prediction Website – SunshineProfits.com
* * * * *
Disclaimer
All essays, research and information found above represent analyses and opinions of Przemyslaw Radomski, CFA and Sunshine Profits’ associates only. As such, it may prove wrong and be a subject to change without notice. Opinions and analyses were based on data available to authors of respective essays at the time of writing. Although the information provided above is based on careful research and sources that are believed to be accurate, Przemyslaw Radomski, CFA and his associates do not guarantee the accuracy or thoroughness of the data or information reported. The opinions published above are neither an offer nor a recommendation to purchase or sell any securities. Mr. Radomski is not a Registered Securities Advisor. By reading Przemyslaw Radomski’s, CFA reports you fully agree that he will not be held responsible or liable for any decisions you make regarding any information provided in these reports. Investing, trading and speculation in any financial markets may involve high risk of loss. Przemyslaw Radomski, CFA, Sunshine Profits’ employees and affiliates as well as members of their families may have a short or long position in any securities, including those mentioned in any of the reports or essays, and may make additional purchases and/or sales of those securities without notice.

-
I know Mike is a very solid investor and respect his opinions very much. So if he says pay attention to this or that - I will.
~ Dale G.
-
I've started managing my own investments so view Michael's site as a one-stop shop from which to get information and perspectives.
~ Dave E.
-
Michael offers easy reading, honest, common sense information that anyone can use in a practical manner.
~ der_al.
-
A sane voice in a scrambled investment world.
~ Ed R.
Inside Edge Pro Contributors

Greg Weldon

Josef Schachter

Tyler Bollhorn

Ryan Irvine

Paul Beattie

Martin Straith

Patrick Ceresna

Mark Leibovit

James Thorne

Victor Adair