
Stocks & Equities
Physicists have been lured into the financial market for decades, prized for their insights and data-crunching skills. But in a time of turbulence, flash crashes and high-frequency trading, can they really spot things that others miss?

Markets may be more like a body of water whose surface is constantly disturbed by new events and information, creating great waves whose energy is dissipated beneath the surface
Gene Stanley raises his fork, holds it out flat, a few inches above his plate of risotto. “The majority of traders still use Gaussian models and, when something outside the Gaussian happens, they have all these phrases, like ‘outliers’, but the main phrase is ‘shit happens’.”
He stares at his raised cutlery.
High quality global journalism requires investment. Please share this article with others using the link below, do not cut & paste the article. See our Ts&Cs and Copyright Policy for more detail. Email ftsales.support@ft.com to buy additional rights. http://www.ft.com/cms/s/2/8461f5e6-35f5-11e3-952b-00144feab7de.html#ixzz2iSZnAI8p
“Now, if we saw the forks start to levitate, it would be bizarre to say, ‘oh, shit happens’, but they do, that’s what they say. They say, ‘oh, you can’t predict everything’.”
With a chuckle, Stanley tucks back into his food.
Didier Sornette, chair of Entrepreneurial Risks at Swiss Federal Institute of Technology Zurich

‘These complex systems are not systematically predictable. They’re only predictable in some regimes’
The famous bell curve described by Carl Friedrich Gauss, the humble normal distribution that underlies so many statistical models, might explain most phenomena in a financial market but Stanley, professor of physics at Boston University, is interested in the levitating forks, the outliers, the “black swans” of Nassim Nicholas Taleb’s description.
This is the territory of econophysics, a discipline that sometimes sounds less like a collaboration between physics and economics and more like an attempted takeover of the latter by the former. By using the techniques of physics – poring through vast quantities of data in order to build models from the ground up, searching for patterns and, ultimately, for laws – econophysicists such as Stanley are trying to explain things that traditional financial theories do not.
In the past five years alone, investors have had to endure a US housing market collapse, a global credit crunch and a stock market “flash crash”. That is a lot of flying cutlery.
When future historians debate the genealogy of chickens and eggs up to the credit crisis, one question will be whether rocket scientists came to finance because of its increasing complexity or whether finance became increasingly complex because of the rocket scientists.
Banks and hedge funds have lured physicists for more than two decades, from the shrinking ranks of academic science or from corporate research departments such as Bell Labs in the US. The heads of trading desks were hungry for anyone who could bring new theory to the chaos of the markets or who could model the price of complex derivatives the same way they could divine laws for the physical world.
Little wonder. Vast fortunes can accrue to the most successful of these number crunchers, the so-called “quants” who can spot the market patterns that others cannot. Renaissance Technologies, the Long Island, New York-based hedge fund created by former codebreaker Jim Simons, now manages $39bn and provides a comfortable career for those trained as physicists, mathematicians and computer scientists.
Yet for some of those who have crossed over or undertaken research collaborations with traders, there remains a belief that the insights of physics have been imperfectly applied.
….read more HERE

In the previous update we have seen how Federal Reserve’s balance sheet grew in the last few years. Now let us look how this growth coincided with increases on the stock market:
When you look at the above graph it would seem almost gratuitous to ask if there is a relationship between the Dow Jones Industrial Average and the Fed’s balance sheet. You don’t need to be a technical analyst to see that there is indeed a relationship. Both grew at the same time, but this does not necessarily imply that the Fed is solely or even mostly responsible for the growth in the stock market. Nevertheless, its influence on the index can hardly be exaggerated. Part of the stock market’s growth may be due to natural market recovery, part caused by the interventionist policies (notice that the growth in the value of balance sheet is not associated with the growth with market value of assets, since they are not marked to market; that is the value of assets held is not adjusted to current market value like in the case of market institutions).
Why is this relevant? It tells us the strength of the dollar system, or actually the strength of the foundation upon which it stands. To put it technically – the economy needs investment demand to grow, or even more simply, it needs money to grow. The sources of that money can be various and the sustainability of growth depends on what those sources are. The best possible source of money to grow is to get money by saving it – that’s the natural capital accumulation, which allows the diversion of funds from pure consumption to financing investment activities. Another possible, but unsustainable way, is to have a bank credit expansion to finance growth through debt). This is what has happened after 2001, the economy grew because banks created massive amounts of credit. The end result of this bubble was predictable from the start to many. There was such huge amount of mal-investments that even the banks themselves got into trouble.
After such a downturn (let’s say that Lehman’s collapse in 2008 was the beginning of the downturn) we could move into phase two which consists of the government funding “growth” through both fiscal stimulus and monetary policy. We put quotation marks on the word “growth” because it is a very slow and often fictitious growth (usually the case with government-funded growth). This is why we can say that the dollar system is in trouble even if the dollar as currency is not doing badly at all in the currency markets. The economy grew, but not as a result of solid fundamentals, but due to the Fed’s interventionist policies. That is why gold kept on shining through that period.
Since the economy did not go into full-blown recovery, it is not surprising that the Fed did not back out from these interventionist practices. And the change at the helm should not change this trend either. We do not believe in a permanent (or at least truly sustainable) market recovery without market forces freely influencing the prices. As long as the Fed stays on its interventionist course, we have every reason to believe that gold remains a firm choice.
Thank you.
Matt Machaj, PhD
Sunshine Profits‘ Market Overview Editor
Gold Market Overview at Sunshine Profits
* * * * *
Disclaimer
All essays, research and information found above represent analyses and opinions of Matt Machaj, PhD and Sunshine Profits’ associates only. As such, it may prove wrong and be a subject to change without notice. Opinions and analyses were based on data available to authors of respective essays at the time of writing. Although the information provided above is based on careful research and sources that are believed to be accurate, Matt Machaj, PhD and his associates do not guarantee the accuracy or thoroughness of the data or information reported. The opinions published above are neither an offer nor a recommendation to purchase or sell any securities. Matt Machaj, PhD is not a Registered Securities Advisor. By reading Matt Machaj’s, PhD reports you fully agree that he will not be held responsible or liable for any decisions you make regarding any information provided in these reports. Investing, trading and speculation in any financial markets may involve high risk of loss. Matt Machaj, PhD, Sunshine Profits’ employees and affiliates as well as members of their families may have a short or long position in any securities, including those mentioned in any of the reports or essays, and may make additional purchases and/or sales of those securities without notice.
The leading American stock indices are at All Time Highs…and could be going a lot higher. The bears claim that the stock market rally is fuelled by Central Bank money printing…and that sooner or later that has to stop…or at least be cut back. But what if it doesn’t? The bears claim that the fools who are driving the market higher will get clobbered once the market “sees through” the idiocy of Central Banks monetizing government debts and deficits. Maybe so…but if you look at the stock market in Caracas, Venezuela ( up 300% last year, up over 300% so far this year) you might wonder why it is such a strong bull market…do you think that the fools who are driving it higher care about P/E multiple expansion? Not likely. Just like in Zimbabwe, which had the world’s hottest stock market a few years back, the people in Venezuela are driving their market higher because they are frightened by their currency’s tumbling purchasing power and they are desperate to exchange it for shares…or anything else.
I frequently ask myself, “Why do you believe what you believe?” I like to think that I saw the crash of 2008 comingbut maybe I’m just “naturally” predisposed to be skeptical of bull market enthusiasm. Having lived and traded through the 2008 crash (and several others going back to the 1974-75 crash) and having grown up listening to my Granddad’s stories of the Great Depression…maybe I’m predisposed to think that cash is king. Maybe I was right for a while…maybe I’m wrong now.
The American stock market, and many others around the world, have been on a bull run for over 4 years. The major indices are at All Time Highs. The more speculative small cap indices are rising faster than the large cap indices…it’s been a Risk-On Market in Full Bloom. The waves of bullish enthusiasm have been inspired by the anticipation of continuing Central Bank largess…the periodic set-backs in the market’s rise have come on fears that the flow of “financial heroin” would be reduced. We have been trading the Anticipation of Central Bank Policy…little else has mattered…including the recent Fiscal Follies in DC…the current Market Psychology is that the easy money is going to keep coming. (Of course Market Psychology is most bullish at an All Time High…how else would we have arrived here…Long Live the Fed!)
Trading comment:
One of my key questions is, “Are you trading what the market is doing…or what you think it should be doing?” I’ve been actively trading gold, stocks and currencies…I’ve made some money…but mostly because my risk management “overrides” have either kept me from making some trades or have taken me out of losing trades quickly…some of my “pet theories” about what the market “should be doing” have just been dead wrong recently.
Chart comment:
The S+P 500 – weekly: In the Big Picture Time Frame it’s clearly a Bull Market in Full Bloom…the guys who think Cash is Trash are certainly winning this round. The money printing may be helping the people who took risks and hurting the people who were risk averse…but it is what it is.
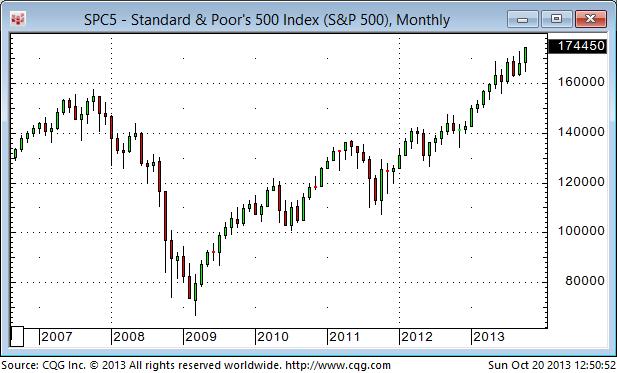
The S+P 500 – daily: When stocks started to fall away from the All Time Highs made Sept18 on the Fed’s “Non Taper” event I wondered if we had seen a Key Turn Date. I couldn’t bring myself to get short…there was no confirmation that a top had been made…and trading on the “got a hunch / bet a bunch” program usually produces miserable results…so I just watched stocks fall as the noise from the DC Fiscal Follies intensified. It was interesting that stocks turned higher on Wednesday Oct 9 – the day Janet Yellen was nominated. Once the market anticipated that the DC distraction was ending prices surged higher…even Fisher (the hawk?) declared that easy money has got to keep flowing…don’t fight the Fed!

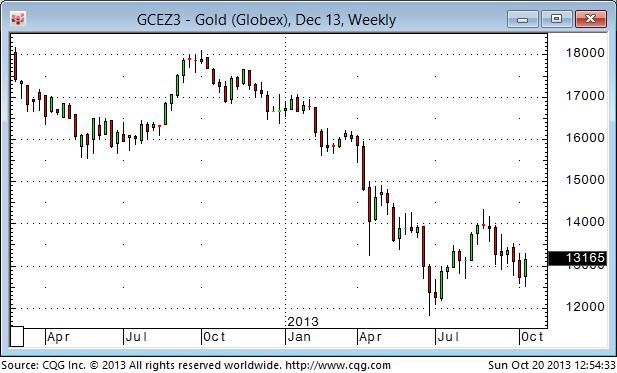
Gold – Weekly: In the Big Picture Time Frame it’s been a bear market in gold. Prices fell $740 or 38% from the Sept 2011 ATH to the 3 year lows made in late June. Comex Open Interest peaked in late 2010 and fell 43% to the September 2013 lows. Outstanding gold ETFs have fallen by more than 700 tonnes or 28% from the highs made late 2012. Money has been flowing to the stock market…not to gold.
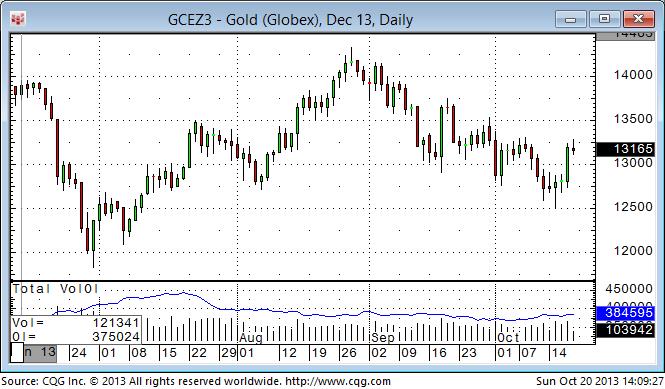
Gold – Daily: We’ve seen a couple of sharp sell-offs on big volume recently…the sell-offs came right on the opening of the US floor sessions…and it looked like forced selling from margin clerks…but who knows…and then we had a burst of buying (up $40 in a few minutes) very early Oct 17 (just after the Euro and Yen had surged higher) on the Chinese Credit Rating Agency downgrade of the USA. If the June lows were THE lows then the lows made this past week are important…and a move through $1350 would be a bullish confirmation. Gold came very close to making a perfect Weekly Key Reversal higher last week. HOWEVER, gold has been in a bear market…the $250 rally off the June lows may have just been a correction…and if last week’s lows at $1250 don’t hold then look for at least a challenge of the June lows.
Gold in terms of Gold shares – Weekly: For the past 2 years this blog has warned against buying gold shares because they were “cheap.” The ratio of gold/gold shares has recently gone to a 25 year extreme. If gold bullion is indeed making a turn higher from last week’s lows then gold shares may come roaring back…but wait for a confirmation.
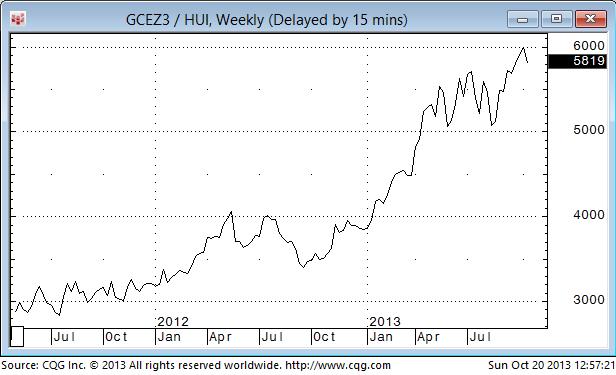
Gold in terms of the S+P 500 – Weekly: Money has been flowing to stocks and away from gold…stocks have been rising sharply in terms of gold. If you think that trend has run its course…sit down…and check out the perspective from the monthly chart below.
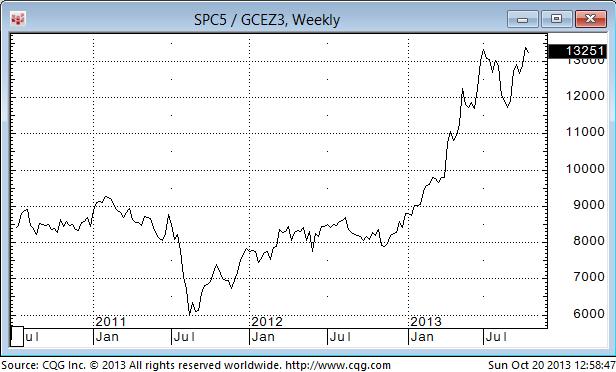
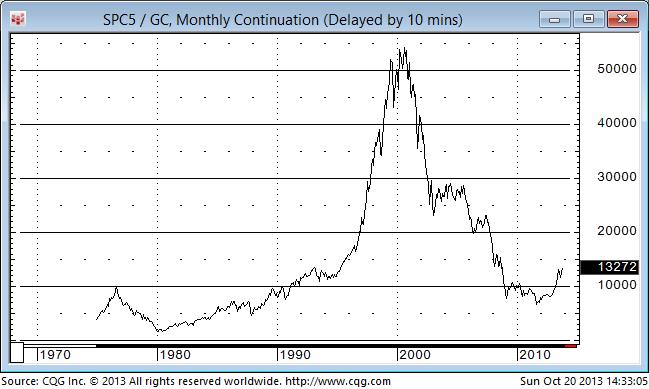
Gold in terms of the S+P 500 – Monthly: Stocks made huge gains in terms of gold during the 1990’s…the gains over the past two years have been relatively tiny.
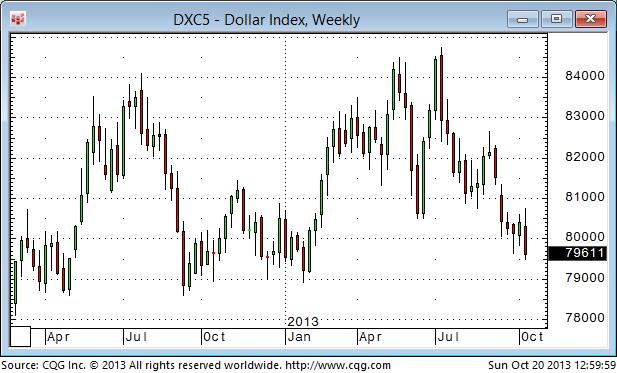
The US Dollar Index – Weekly: One of my key themes (a theme is an idea with a time frame longer than my trading horizon) has been that the US Dollar began a bull market in 2011…and is going to keep rising. A theme will often lead me to trade a market the way I think it should be going…rather than the way it is going. I bought the US$ Index during the DC Fiscal Follies (although my lack of conviction on the trade kept me to a ½ sized position) and I closed it out with a small loss when the Euro surged to new highs last week. The US Dollar Index traded to a 3 year high in early July but made a Weekly Key Reversal Down…and kept falling. It just registered another Weekly Key Reversal Down…I think taking a small loss was a good idea!
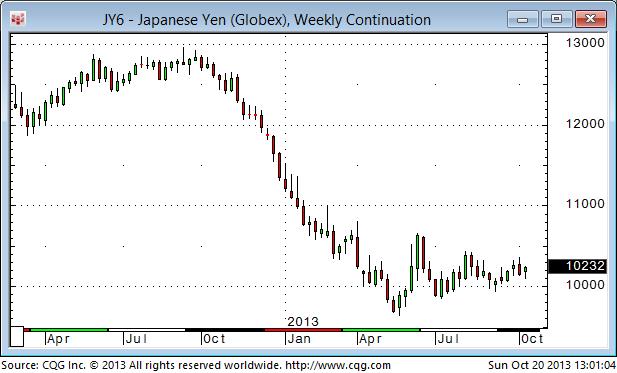
The Japanese Yen – Weekly: The Yen began to tumble last November when the market realized that Abe was going to win the election…but since the May lows it’s been unable to stay decisively below “Par”…confounding the Yen bears.
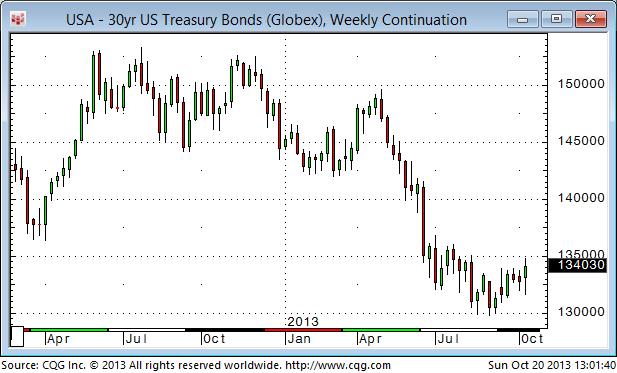
The US Long Bond – Weekly: The long bond traded at lifetime low yields in 2012…lower yields than were made in the panic of 2008…but beginning in May 2013 yields moved sharply higher. David Rosenberg, who was a bond bull for 25 years, thinks we’ve seen the lows in terms of yield and that, after a bit of a rally, bond prices are headed lower again. Other long time bond bulls (Gary Shilling, Lacy Hunt) think that the 2013 decline in the bond market was just a correction and that bonds are headed higher. It’s interesting that bonds rallied with the stock market the past few days…don’t fight the Fed!

China’s future may be brighter than anyone expects – it’s time to buy
 A lot of people are negative on China these days.
The bears worry that China relies too much on investment, and not enough on consumer spending. If it wants to continue to grow sustainably, consumers need to pick up the slack. Otherwise there could be an almighty crash.
But research from a couple of Chinese academics suggests that Chinese consumers are in fact spending significantly more than official figures suggest.
If they’re right, it means that the Chinese economy is less likely to ‘hit the wall’ in the next few years.
That means, investing in China is less risky than many people think.
And that leaves the Chinese stock market looking pretty cheap…
Why over-investment can lead to crashes
If you’re wondering why too much investment might lead to a crash, it’s because you get diminishing returns if you invest too much.
If you build roads and railways that no one ever uses for example, then they won’t generate any revenue. So you’ve spent a load of money on a project that will never cover its costs, let alone generate a return.
If this continues, there will come a time when businesses realise it’s pointless, because they’re not getting any return on their latest investments.
When that happens, workers in construction and heavy industry will get laid off. That means rising unemployment and recession. There’s also the risk to the banking system if all of these dud projects have been funded with borrowed money.
If you look at China, it’s not hard to find signs of over-investment. The country is famously dotted with ‘ghost cities’. There are also some plain weird follies, like this giant copper-plated puffer fish.
So the question is: can China achieve a relatively smooth and pain-free transition from an investment-led economy to one based more on consumption?
Could the future be brighter for Chinese consumers?
Well, if you believe the official Chinese government figures, it’s a massive challenge. Household consumption comprises just 34% of China’s GDP, according to official figures. That’s way lower than the UK, on 65%, and the US on 70%.
The sort of dramatic shift in economic focus needed to get the Chinese consumption figure up from 34% to, say, 50%, could easily end in tears.
However, an article in yesterday’s FT gives grounds for optimism. It cites research from two Chinese academics, Jun Zhang and Tjan Zhu, which suggests that Chinese consumption has been under-reported for some time.
Indeed, Zhang and Zhu believe that a more accurate figure for household consumption would be around 45% of GDP.
How do they get to this figure? Well, arguably it’s by taking a more realistic view of corruption in the country. High earners prefer to hide the true extent of their consumption from government bureaucrats. Some even avoid being surveyed altogether.
This strikes me as a very plausible argument. And if it’s true, it suggests that the chances of a big Chinese crash are lower than many people realise.
Granted, even a 45% figure for household consumption isn’t really sustainable in the long-term. But it’s a much better place to begin a transition from, than the 34% official figure.
China looks cheap
Don’t get me wrong, there’s still a real risk that China could crash. But the point I’m making is that the risk is lower than widely thought.
And that matters, because right now, Chinese share prices look very cheap on many measures. That means they are pricing in a lot of potential drama.
For example, look at the table below, which compares the value of a country’s stock market to its GDP.
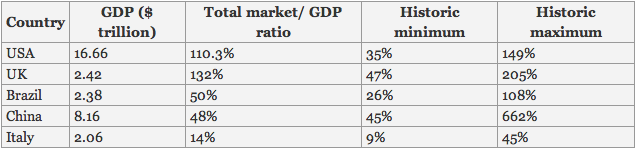
Source: GuruWatch
Just to explain – the total market/GDP ratio is just the value of the country’s stock market expressed as a percentage of the economy.
As you can see, the US is currently on the high side compared to history (the total value of the stock market is a little bit higher than the value of the economy, compared to a historic maximum of 149%). The UK is somewhere in the middle of its historic range, and Brazil is on the low side.
But China – with a stock market valued at half of GDP – is only just above its historic low. (As is Italy, another market we’ve viewed as cheap for some time).
I have to say, this table certainly increased my own interest in investing in China. What’s more, Pictet Asset Management says that we’re now seeing early signs of improved corporate governance in the country.
How to profit from a Chinese rebound
So what’s the best way to profit from a smooth transition to a consumption-based economy in China?
Well, the lowest risk approach is to invest in Western companies that do a lot of business in China. I’m thinking of consumer goods giants such as Diageo (LSE: DGE) or Unilever (LSE: ULVR).
Or you could take a bet on growth in Chinese tourism. The number of visitors to Thailand has doubled over the last year, according to the China Market Research Group. And I’m sure that we’ll see many more Chinese tourists here in Britain in the future.
InterContinental Hotels Group (LSE: IHG) looks well placed to benefit as it has a decent estate of hotels in China, plus many more in other major tourist destinations.
If you have an appetite for taking more risk – and have more of an eye for a potential bargain – you could buy shares in Chinese companies themselves. The danger here is you may not trust the Chinese government to treat overseas shareholders fairly – and you’d be right to be cautious.
Still, I quite like the JP Morgan Chinese Investment Trust (LSE: JMC). It’s been running since 1993 and has managed to avoid some of the riskiest Chinese shares.
Moreover, 45% of the fund is invested in shares listed in either Hong Kong or Taiwan where the governance should be better and the risk lower. It’s also trading on a 13% discount, so in effect you’re getting £1 of assets for 87p. If sentiment changes towards China, not only could the underlying shares rise, but the discount will probably close too – boosting your returns.
• Stay up to date with MoneyWeek: Follow us on Twitter, Facebook and Google+
Our recommended articles for today
How to use the best minds in Britain to find blockbuster stocks
Some of the most exciting small-cap tech stocks have their roots in Britain’s world-class universities. David Thornton looks at one to keep an eye on.
Making sizzling profits from solar power
SUBSCRIBERS ONLY
The investment trend for cutting out the middle man is throwing up lucrative opportunities in solar power, say John Stepek and Matthew Partridge. Here’s how to profit.

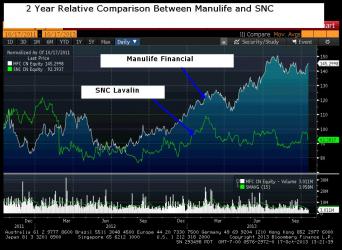
SNC Lavalin used to be the darling of brokerage firm analysts, garnering almost unanimous BUY recommendations from the Street for a number of years. Then, when it was revealed that a number of employees and officials of the firm were implicated in a bribery scandal, many of the analysts cut bait and ran. According to Bloomberg, seven analysts currently have a BUY on the stock, however six say it is a HOLD and one says that it is a SELL.
The bribery scandal news was serious, and it was not good. However, we at McIver Wealth Management have always believed it was first, and foremost, a governance issue and not an operations issue. During and following a number of investigations, there has been a wholesale replacement of officials at the firm.
Now that those associated with the scandal are gone, operations are once again the focus. That said, yesterday SNC cut their outlook and the stock fell a couple of percentage points. That would suggest that operations are weakening. However, upon closer examination, there are a number of one-time charges which contributed to that negative guidance.
Our Richardson GMP colleague Gareth Watson, appearing on BNN Television, stated that the appearance of one-time charges suggests that management is adamant about “cleaning house” as it move past the scandal. We would agree.
Another one of our holdings, Manulife Financial, went through a similar evolution following a difficult period for the company. Again, a number of analysts became neutral or negative on the stock. We were attracted by their “cleaning house” strategy in that it can provide a cathartic experience for the firm as it says goodbye to the previous regime and absorbs costs associated with old projects and divisions. No one is left to defend or rationalize the previous strategies or mistakes. The new management proceeds unhindered and with an objective and fresh outlook.
It is our hope that Manulife’s resulting good fortune can also be seized by SNC and it moves into a new era.
Both SNC Lavalin Group Inc. and Manulife Financial Corp. are held in the McIver-Jasayko Model Portfolios. Comments about these investments are not intended as advice and do not constitute a recommendation to buy, sell, or hold.
The opinions expressed in this report are the opinions of the author and readers should not assume they reflect the opinions or recommendations of Richardson GMP Limited or its affiliates. Assumptions, opinions and estimates constitute the author’s judgment as of the date of this material and are subject to change without notice. We do not warrant the completeness or accuracy of this material, and it should not be relied upon as such. Before acting on any recommendation, you should consider whether it is suitable for your particular circumstances and, if necessary, seek professional advice. Past performance is not indicative of future results.
Richardson GMP Limited, Member Canadian Investor Protection Fund.
Richardson is a trade-mark of James Richardson & Sons, Limited. GMP is a registered trade-mark of GMP Securities L.P. Both used under license by Richardson GMP Limited.

-
I know Mike is a very solid investor and respect his opinions very much. So if he says pay attention to this or that - I will.
~ Dale G.
-
I've started managing my own investments so view Michael's site as a one-stop shop from which to get information and perspectives.
~ Dave E.
-
Michael offers easy reading, honest, common sense information that anyone can use in a practical manner.
~ der_al.
-
A sane voice in a scrambled investment world.
~ Ed R.
Inside Edge Pro Contributors

Greg Weldon

Josef Schachter

Tyler Bollhorn

Ryan Irvine

Paul Beattie

Martin Straith

Patrick Ceresna

Mark Leibovit

James Thorne

Victor Adair