The leading American stock indices are at All Time Highs…and could be going a lot higher. The bears claim that the stock market rally is fuelled by Central Bank money printing…and that sooner or later that has to stop…or at least be cut back. But what if it doesn’t? The bears claim that the fools who are driving the market higher will get clobbered once the market “sees through” the idiocy of Central Banks monetizing government debts and deficits. Maybe so…but if you look at the stock market in Caracas, Venezuela ( up 300% last year, up over 300% so far this year) you might wonder why it is such a strong bull market…do you think that the fools who are driving it higher care about P/E multiple expansion? Not likely. Just like in Zimbabwe, which had the world’s hottest stock market a few years back, the people in Venezuela are driving their market higher because they are frightened by their currency’s tumbling purchasing power and they are desperate to exchange it for shares…or anything else.
I frequently ask myself, “Why do you believe what you believe?” I like to think that I saw the crash of 2008 comingbut maybe I’m just “naturally” predisposed to be skeptical of bull market enthusiasm. Having lived and traded through the 2008 crash (and several others going back to the 1974-75 crash) and having grown up listening to my Granddad’s stories of the Great Depression…maybe I’m predisposed to think that cash is king. Maybe I was right for a while…maybe I’m wrong now.
The American stock market, and many others around the world, have been on a bull run for over 4 years. The major indices are at All Time Highs. The more speculative small cap indices are rising faster than the large cap indices…it’s been a Risk-On Market in Full Bloom. The waves of bullish enthusiasm have been inspired by the anticipation of continuing Central Bank largess…the periodic set-backs in the market’s rise have come on fears that the flow of “financial heroin” would be reduced. We have been trading the Anticipation of Central Bank Policy…little else has mattered…including the recent Fiscal Follies in DC…the current Market Psychology is that the easy money is going to keep coming. (Of course Market Psychology is most bullish at an All Time High…how else would we have arrived here…Long Live the Fed!)
Trading comment:
One of my key questions is, “Are you trading what the market is doing…or what you think it should be doing?” I’ve been actively trading gold, stocks and currencies…I’ve made some money…but mostly because my risk management “overrides” have either kept me from making some trades or have taken me out of losing trades quickly…some of my “pet theories” about what the market “should be doing” have just been dead wrong recently.
Chart comment:
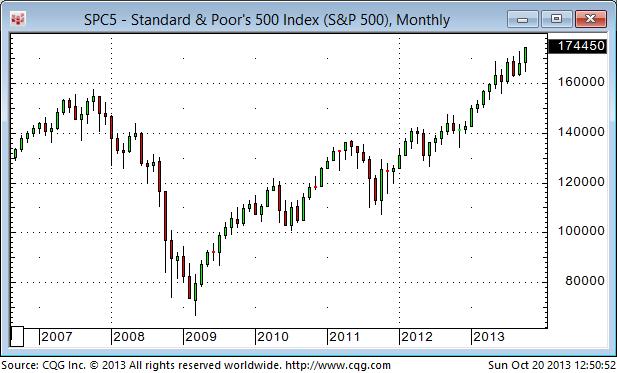
The S+P 500 – weekly: In the Big Picture Time Frame it’s clearly a Bull Market in Full Bloom…the guys who think Cash is Trash are certainly winning this round. The money printing may be helping the people who took risks and hurting the people who were risk averse…but it is what it is.
The S+P 500 – daily: When stocks started to fall away from the All Time Highs made Sept18 on the Fed’s “Non Taper” event I wondered if we had seen a Key Turn Date. I couldn’t bring myself to get short…there was no confirmation that a top had been made…and trading on the “got a hunch / bet a bunch” program usually produces miserable results…so I just watched stocks fall as the noise from the DC Fiscal Follies intensified. It was interesting that stocks turned higher on Wednesday Oct 9 – the day Janet Yellen was nominated. Once the market anticipated that the DC distraction was ending prices surged higher…even Fisher (the hawk?) declared that easy money has got to keep flowing…don’t fight the Fed!

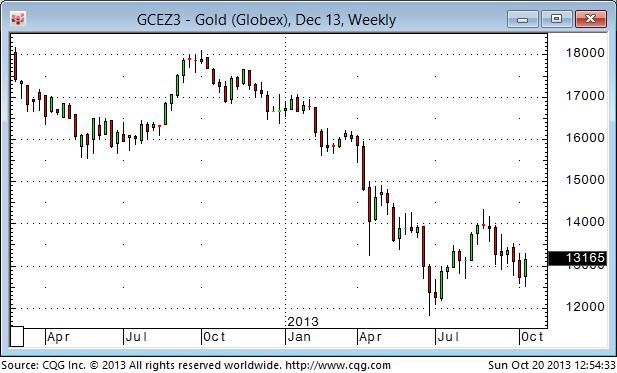
Gold – Weekly: In the Big Picture Time Frame it’s been a bear market in gold. Prices fell $740 or 38% from the Sept 2011 ATH to the 3 year lows made in late June. Comex Open Interest peaked in late 2010 and fell 43% to the September 2013 lows. Outstanding gold ETFs have fallen by more than 700 tonnes or 28% from the highs made late 2012. Money has been flowing to the stock market…not to gold.
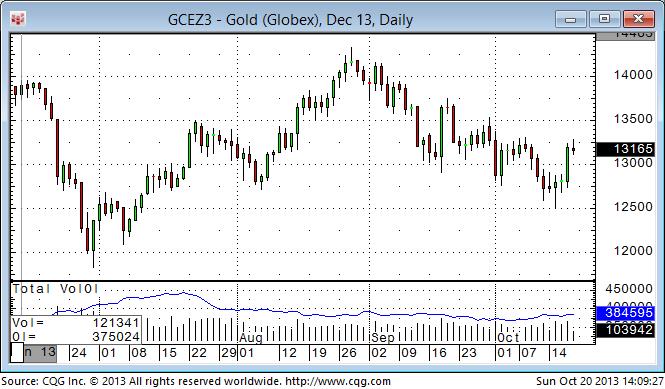
Gold – Daily: We’ve seen a couple of sharp sell-offs on big volume recently…the sell-offs came right on the opening of the US floor sessions…and it looked like forced selling from margin clerks…but who knows…and then we had a burst of buying (up $40 in a few minutes) very early Oct 17 (just after the Euro and Yen had surged higher) on the Chinese Credit Rating Agency downgrade of the USA. If the June lows were THE lows then the lows made this past week are important…and a move through $1350 would be a bullish confirmation. Gold came very close to making a perfect Weekly Key Reversal higher last week. HOWEVER, gold has been in a bear market…the $250 rally off the June lows may have just been a correction…and if last week’s lows at $1250 don’t hold then look for at least a challenge of the June lows.
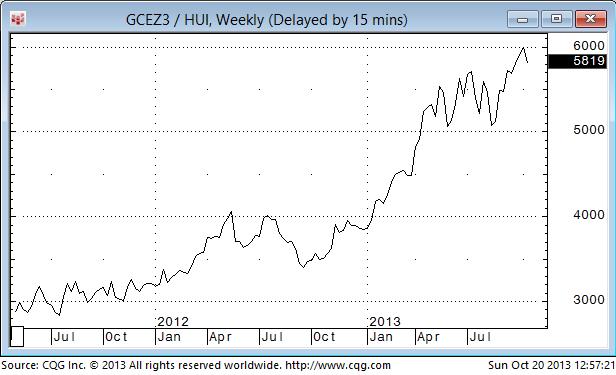
Gold in terms of Gold shares – Weekly: For the past 2 years this blog has warned against buying gold shares because they were “cheap.” The ratio of gold/gold shares has recently gone to a 25 year extreme. If gold bullion is indeed making a turn higher from last week’s lows then gold shares may come roaring back…but wait for a confirmation.
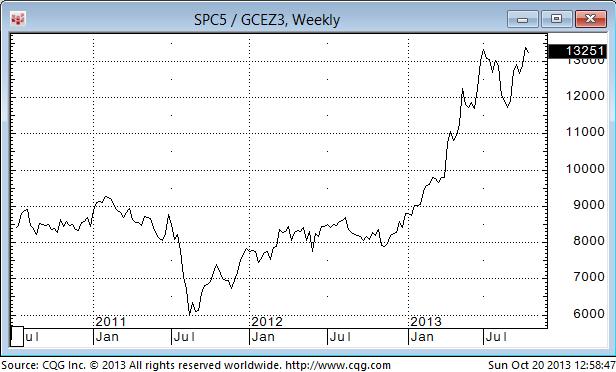
Gold in terms of the S+P 500 – Weekly: Money has been flowing to stocks and away from gold…stocks have been rising sharply in terms of gold. If you think that trend has run its course…sit down…and check out the perspective from the monthly chart below.
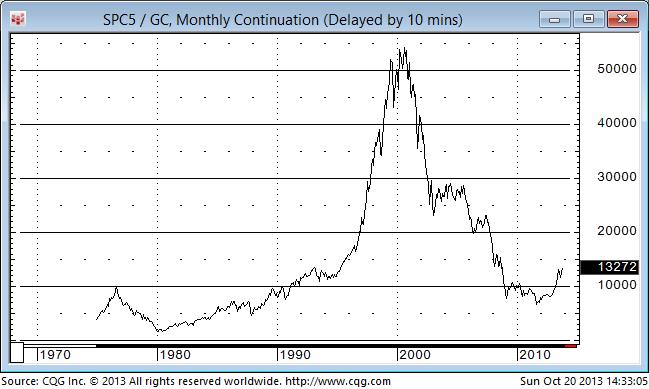
Gold in terms of the S+P 500 – Monthly: Stocks made huge gains in terms of gold during the 1990’s…the gains over the past two years have been relatively tiny.
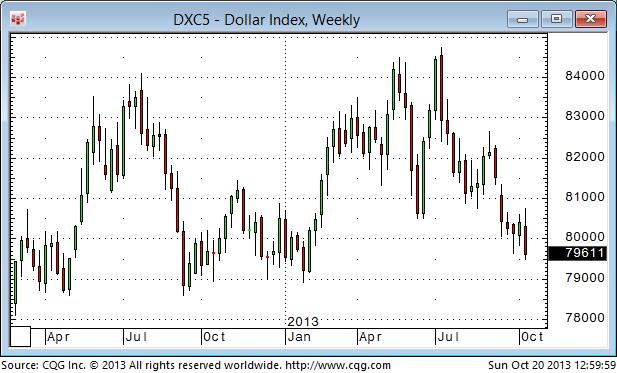
The US Dollar Index – Weekly: One of my key themes (a theme is an idea with a time frame longer than my trading horizon) has been that the US Dollar began a bull market in 2011…and is going to keep rising. A theme will often lead me to trade a market the way I think it should be going…rather than the way it is going. I bought the US$ Index during the DC Fiscal Follies (although my lack of conviction on the trade kept me to a ½ sized position) and I closed it out with a small loss when the Euro surged to new highs last week. The US Dollar Index traded to a 3 year high in early July but made a Weekly Key Reversal Down…and kept falling. It just registered another Weekly Key Reversal Down…I think taking a small loss was a good idea!
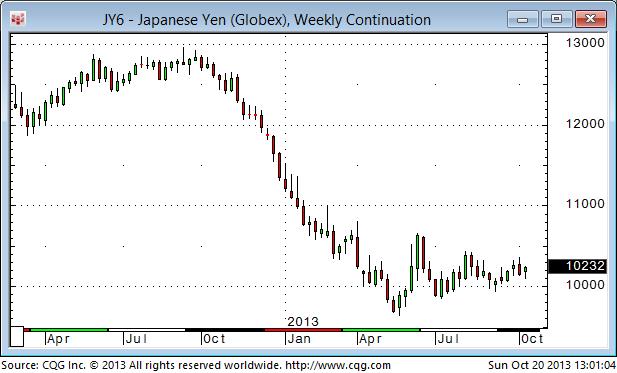
The Japanese Yen – Weekly: The Yen began to tumble last November when the market realized that Abe was going to win the election…but since the May lows it’s been unable to stay decisively below “Par”…confounding the Yen bears.
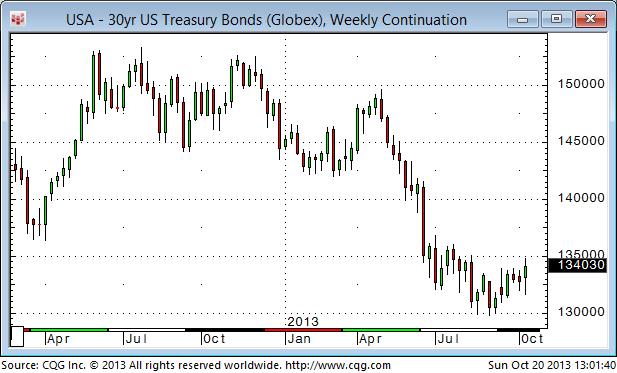
The US Long Bond – Weekly: The long bond traded at lifetime low yields in 2012…lower yields than were made in the panic of 2008…but beginning in May 2013 yields moved sharply higher. David Rosenberg, who was a bond bull for 25 years, thinks we’ve seen the lows in terms of yield and that, after a bit of a rally, bond prices are headed lower again. Other long time bond bulls (Gary Shilling, Lacy Hunt) think that the 2013 decline in the bond market was just a correction and that bonds are headed higher. It’s interesting that bonds rallied with the stock market the past few days…don’t fight the Fed!