
Real Estate
Housing is hot again, but lately it’s been overshadowed by flashier bubbles in government debt, tech stocks and possibly cryptocurrencies.
Still, the warning signs are spreading. Today’s Wall Street Journal, for instance, reports that homeowners are back to using their houses as ATMs:
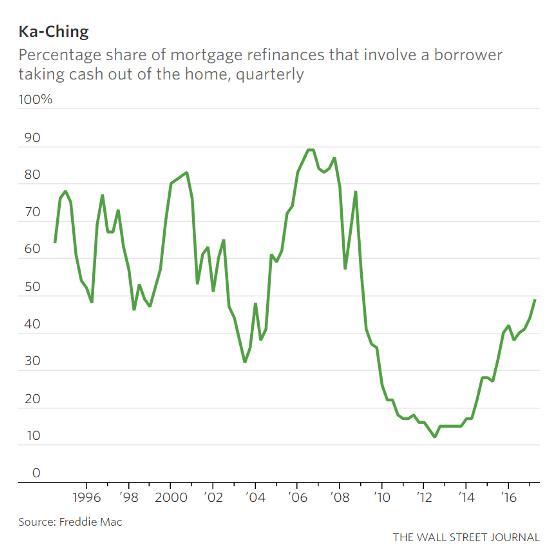
Homeowners Are Again Pocketing Cash as They Refinance Properties
Americans refinancing their mortgages are taking cash out in the process at levels not seen since the financial crisis.
Nearly half of borrowers who refinanced their homes in the first quarter chose the cash-out option, according to data released this week by Freddie Mac. That is the highest level since the fourth quarter of 2008.
The cash-out level is still well below the almost 90% peak hit in the run-up to the housing meltdown. But it is up sharply from the post-crisis nadir of 12% in the second quarter of 2012.
In a cash-out refi, a borrower refinances an existing mortgage with a new one, typically at a lower borrowing cost, that has a higher principal balance than the existing one. This allows the homeowner to pay off the old mortgage and still have cash left over for other uses.
The growing popularity of cash-out refis has helped buoy refinance activity. After booming for several years, demand for refinance mortgages had begun to slow as the Federal Reserve began increasing short-term interest rates and longer-term bond yields moved higher.
Mortgage rates remain low by historical standards, though. The average rate for a fixed, 30-year mortgage was 3.95%, Freddie Mac reported this week.
Meanwhile, rising home prices have helped increase the equity homeowners have in their houses. This allows more people to refinance to capture the benefit of lower mortgage rates.
And borrowers whose homes are rising in value are often more likely to be interested in refinancing for cash. For example, in Denver and Dallas, where home prices have jumped, more than half of refinancers opted for cash last year, according to Freddie Mac.
To some housing-market observers, the fact that more homeowners are tapping their homes for cash represents a healthy confidence in the economy. It comes against a backdrop of continued gains in employment.
At the same time, the increasing use of cash-out refis causes some concern since, in the run-up to the financial crisis, borrowers used their homes like veritable ATMs.
Len Kiefer, Freddie Mac’s deputy chief economist, says this time has been different. Borrowers now are subject to stricter standards when they get a loan or refinance a mortgage. There is also less money at stake now than a decade ago.
Cash-out refis in the first quarter represented about $14 billion in net home equity compared with more than $80 billion in each of three straight quarters in 2006. On an annual basis, total home equity cashed out in 2016 was $61 billion, according to Freddie Mac, versus $321 billion in 2006.
“People have been using cash-out for years,” Mr. Kiefer said. “From a personal-finance standpoint, it can make a lot of sense.”
One example is a borrower using the cash from a refinance to consolidate credit-card debt that has far higher yields. That in many cases can produce a big savings in debt-servicing costs by replacing debt that has double-digit interest rates with a loan that has a rate in the low single digits.

Here we go again. In every cycle, destructive behavior like using home equity to pay off credit cards or take vacations or whatever starts to surge. And every time the banking/real estate complex trots out paid spokesmen masquerading as economists to explain that this behavior is perfectly safe because everything else is going so well.
This deception eventually blows up in their faces, the pseudo-economists are disgraced (See Realtors’ Former Top Economist Says Don’t Blame the Messenger) and the people suckered in by the experts’ assurances are stuck with bills they can’t pay.
If cash-out refis continue to soar in the second quarter, then housing is officially a bubble again — with one big difference: This time around it’s just one of many, which means the eventual reckoning will be a lot more complex and interesting.
….related:

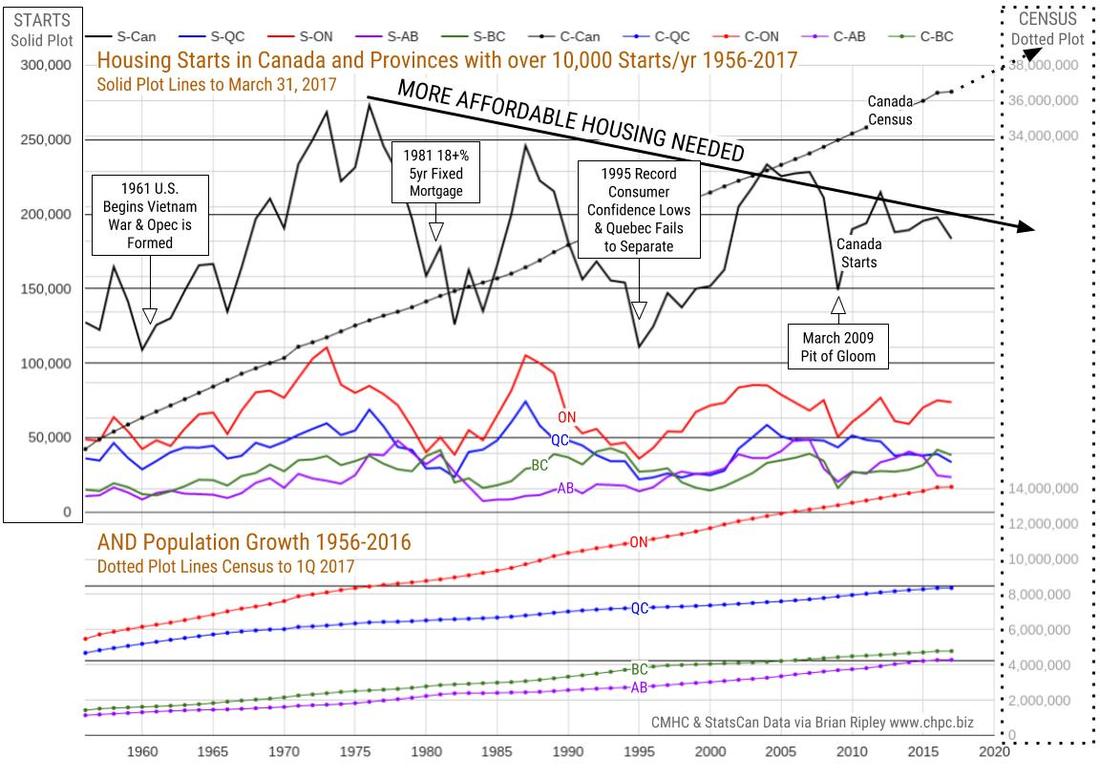
NOTE: The chart below shows the actual annual totals count from 1956 through 2016.
The 2017 data points on the chart are derived from the “annualized” provincial data set in the charts above and are therefor a projection of what year end 2017 might look like.
…..read more HERE including City, Provincial charts broken down
…related: Toronto, Hamilton and Victoria push Canada to another record on house prices
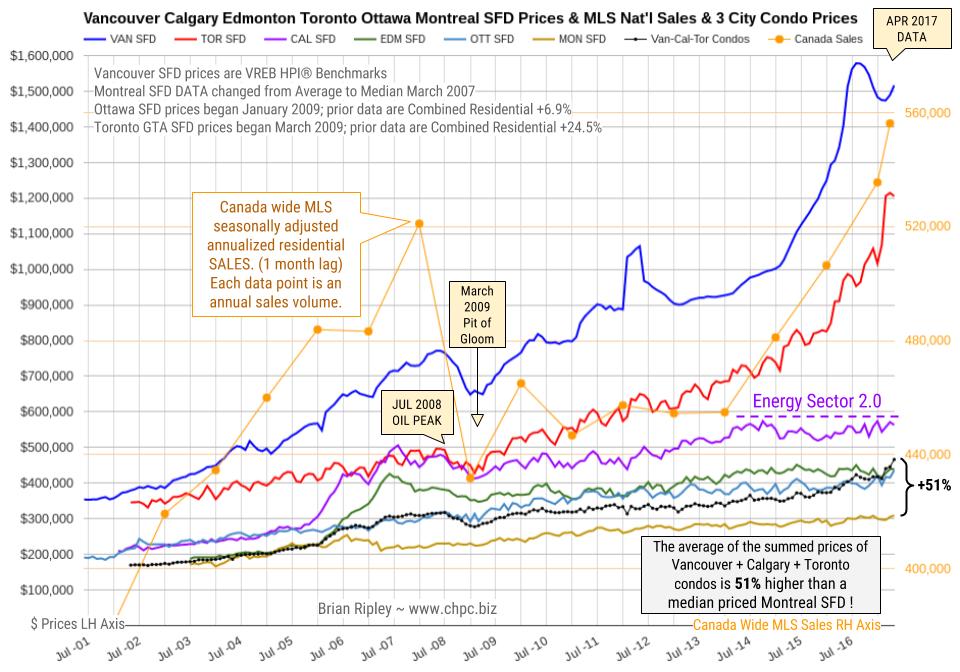
In April 2017 Canada’s big city metro SFD prices coiled about or slid off their near term highs except in Ottawa and Montreal where detached houses fetched new peak prices. Anyone owning a detached house in the scorching hot Toronto and Vancouver markets is sitting on an unredeemed lottery ticket.
In Calgary prices are labouring under the new Energy Sector 2.0 as the oil majors head for blacker fields; big money is fleeing Canada (and has been for nearly 20 years) and on the street, Calgary buyers are avoiding condo units in favour of townhouses and detached properties.
We are going to focus this week on two stories from the property market; one in Canada and one back home here in the UK. Property market analysis is not exactly the main focus of our day job, but these stories may well have important implications for financial markets, which of course is what our day job is all about.
It is no secret with our readers that we have had a bearish fundamental bias for quite some time now. We have tried our very best to supress these bearish feelings as financial prices move further into bubble territory supported by extraordinary central bank policies and also the activities of price insensitive buyers (central banks, companies buying their own shares and index providers). However, we do believe that these forces will ultimately dissipate and that there will one day be another bear market.
Nobody knows what will be the visible trigger or triggers for the next bear market (academics are still unsure of the cause of the 1987 stock market crash!). We still look back at 2007 and pinpoint the collapse of two highly leveraged Bear Sterns hedge funds in June of that year as the first visible evidence that the financial bubble was bursting (the property bubble began to burst in 2006 in the US). So, we present these two stories as evidence that leveraged speculation by unsophisticated investors is rife today, and that visible problems are emerging.
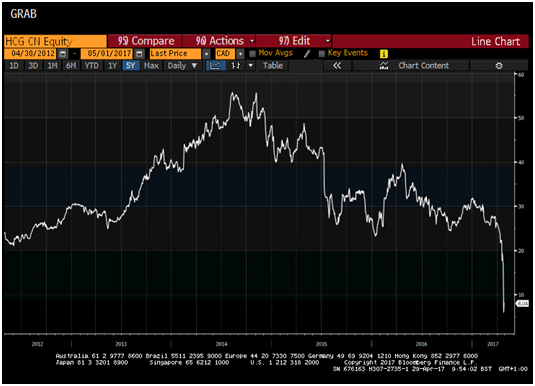
We will start this week on the story of the collapsing share price of Home Capital Group (HCG), the largest non-bank mortgage lender in Canada. The shares collapsed by over 60% last week after it emerged that the Company had arranged an emergency liquidity line via a C$1.5 billion loan facility. The reason for the liquidity need appears to be some C$600 million of deposits had been withdrawn and they had to plug the gap. As can be seen in chart 1 below, the 60% decline on Wednesday was not the start of the bear market for Home Capital Group; the shares have now fallen by 85% from the 2014 high. In our opinion, this story has an eerie parallel with Northern Rock in 2008 in the UK – a mortgage provider suffering a deposit run.
Chart 1 – Home Capital Group share price
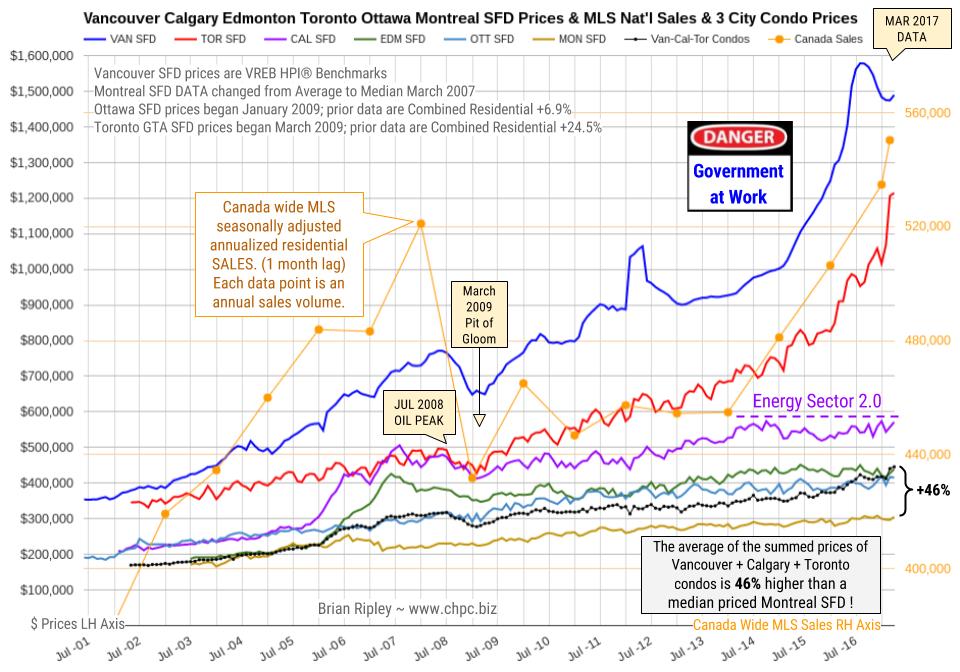
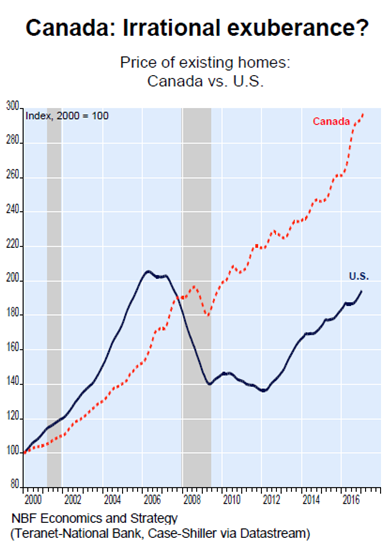
In March 2017 Canada’s big city metro SFD prices coiled about or slid off their near term highs except in Toronto where detached houses, town houses and condos fetched new peak prices; Vancouver strata prices also hit new highs as well. Strata is the new Canadian “can-do” “must-do” “will-do” affordability metric.
Anyone owning a house in the scorching hot Toronto market is sitting on an unredeemed lottery ticket. In Vancouver scorched earth ruins are beginning to appear. In Calgary prices are labouring under the new Energy Sector 2.0 as the oil majors head for blacker fields; big money is fleeing Canada (and has been for nearly 20 years) and on the street, Calgary buyers are shunning strata units in favour of detached properties.
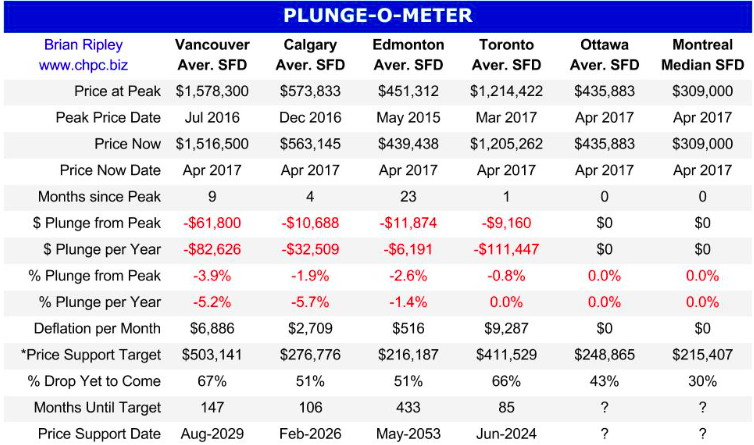
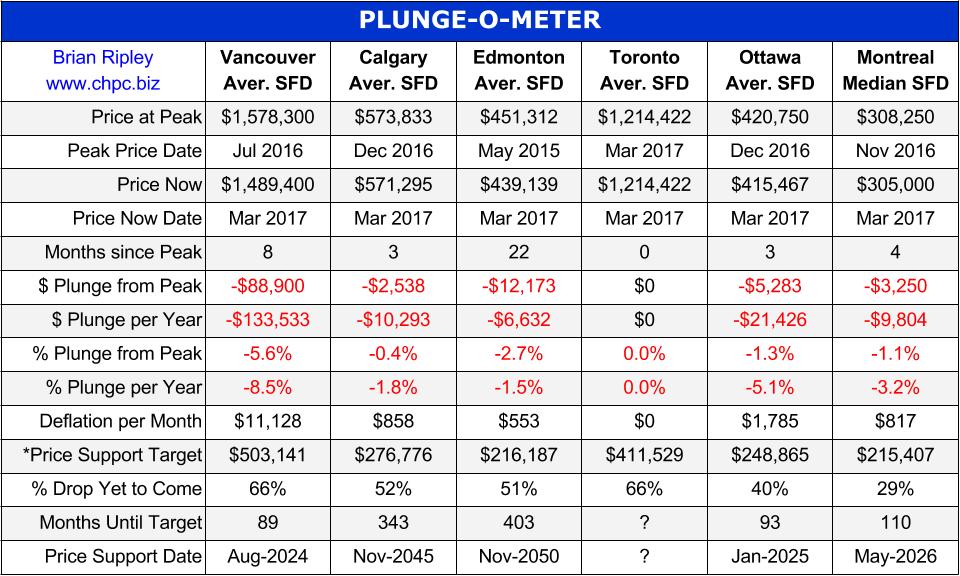
The Plunge-O-Meter is a fantasy model based simply on the current snapshot of how much of the correction has already occurred and if the rate of change continues at the same tempo.


-
I know Mike is a very solid investor and respect his opinions very much. So if he says pay attention to this or that - I will.
~ Dale G.
-
I've started managing my own investments so view Michael's site as a one-stop shop from which to get information and perspectives.
~ Dave E.
-
Michael offers easy reading, honest, common sense information that anyone can use in a practical manner.
~ der_al.
-
A sane voice in a scrambled investment world.
~ Ed R.
Inside Edge Pro Contributors

Greg Weldon

Josef Schachter

Tyler Bollhorn

Ryan Irvine

Paul Beattie

Martin Straith

Patrick Ceresna

Mark Leibovit

James Thorne

Victor Adair