
Real Estate
 On the way up in price it was easy. Make an offer higher than list price with few conditions if any and provide the vendor with everything they wanted and voilà, you own the asset if you managed to out-guess the competitive bidders lined up on their phones.
 Liabilities were an unimportant consideration because in a few days, a similar property would sell for even more and your balance sheet then became even more credit worthy; check and check.
On the way down, guessing the price that a vendor will agree to is still a requirement; is the vendor holding a property with too little of his own equity and perhaps reluctant to take a loss at this time, or is the property being offered for the first time in let’s say the last decade? A single family detached house in Vancouver has increased in price by over 120% in the last 10 years (over 160% in Toronto). The vendor’s equity position is an important clue in the guessing game.
Is the vendor attempting to sell in order to repurchase in the same market? That would suggest an end price is required CLICK IMAGE TO ENLARGE
similar to the current snapshot of market comparable sales if trading sideways is the objective. Is the vendor an estate looking to settle accounts for multiple
parties? That implies that the end price is not as “sticky” because VALUE can be defined outside the parameters of “comps”.
At some point definitions of value might again include an appraiser’s use of the “income” approach. Investment real estate cap rates in a city like Vancouver are among the lowest in Canada and so a buyer must determine if there is value in the price. Potential investment capital can dry up and move very rapidly out of a declining market and seek out better (lower risk) returns elsewhere. Low cap rates are tolerated in a rising market but not so much when price momentum shifts to the down side. Vancouver prices peaked July 2016
A declining market requires more work on the buy side and exposes the potential purchaser with risk not seen on the way up.
The CBRE in their 2016 Report list cap rates for “A” class apartment buildings in Vancouver at 2.5-3% (in Toronto 3.25-3.75%, in Calgary 4.5-5%). This week the Bank of Canada benchmark 10 year yield is 1.76% similar to the full month of February plot on my yield curvechart.
What we don’t see in the CBRE report is what expense items are used in the developing a theoretical cap rate (Net Income / Asset Purchase Price). I suspect that only the minimum data of property tax, insurance, maintenance and actual expenses paid out are used for a given year in these surveys. Is a vacancy allowance included? Not all tenancies are reliable. Is a management fee included? Someone has to spend time taking care of the asset. Is the asset subject to sudden strata fee spikes or revelations of past due maintenance? These are important questions that any real estate investor who has been playing the game for at least one cycle trend change will ask.
In my 2013 case study, I had to lower the purchase price by 25% to get a return that piqued my interest because I included vacancy and management.
With a 25% drop in sale price, the GRM has dropped nearly 6 points (lower is better) and the CAP Rate has gone up 40 basis points (higher is better) which not a huge move but the yield on investment (ROI) has increased to more than twice the 10 year bond return and that provides an investor the incentive in a ZIRP environment to buy and hold and allow other people’s money (the tenant’s) to turn debt into equity.
(2013 Case Study)

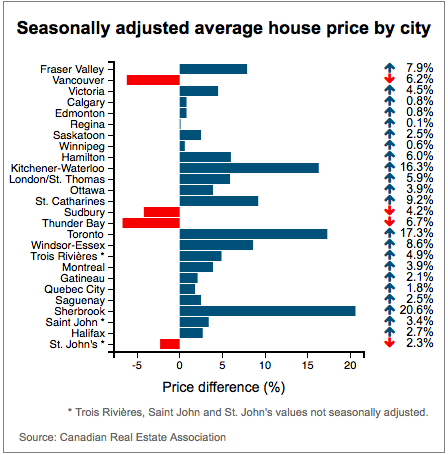
The price of the average Canadian home rose up by 3.5 per cent to and average price of $519,521 in February, even as the national figures continue to be skewed by hot activity in the country’s biggest market: Toronto. “That said, Greater Vancouver’s share of national sales activity has diminished considerably over the past year, giving it less upward influence on the national average price,” CREA said.
According to statistics released today by The Canadian Real Estate Association (CREA), national home sales were up on a month-over-month basis in February 2017.
Highlights:
- National home sales rose 5.2% from January to February.
- Actual (not seasonally adjusted) activity in February was down 2.6% from a year earlier.
- The number of newly listed homes was up 4.8% from January to February.
- The MLS® Home Price Index (HPI) in February was up 16% year-over-year (y-o-y).
- The national average sale price edged up 3.5% y-o-y in February.

 “The real estate cycle peaked and it is headed down in terms of appreciation. This is the general market and not the high-end, although that has begun to turn down in many places often due to taxation of rising regulation as in Miami or Sydney Australia.”
….also from Martin:
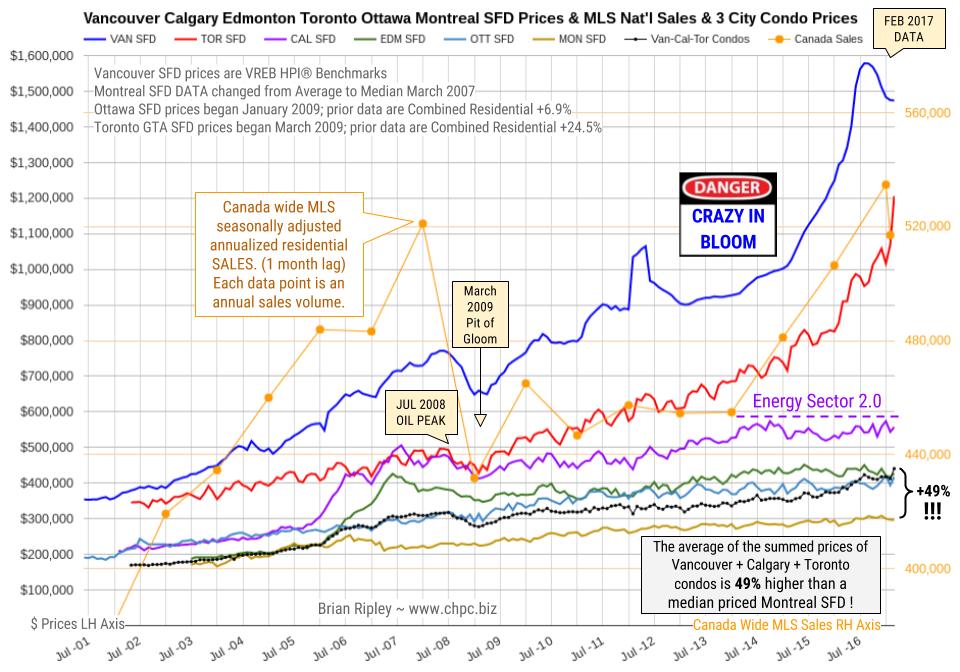
The chart above shows the average detached housing prices for Vancouver*, Calgary, Edmonton, Toronto*, Ottawa* and Montréal* (the six Canadian cities with over a million people each) as well as the average of the sum of Vancouver, Calgary and Toronto condo (apartment) prices on the left axis. On the right axis is the seasonally adjusted annualized rate (SAAR) of MLS® Residential Sales across Canada (one month lag).
In February 2017 Canada’s big city metro SFD prices coiled about or slid off their near term highs except in Toronto where detached houses,town houses and condos fetched new peak prices. Anyone owning a house in the scorching hot Toronto market is sitting on an unredeemed lottery ticket. In Vancouver scorched earth ruins are beginning to appear. Notice Calgary prices are labouring under the new Energy Sector 2.0 which could be anticipating the Trumpster’s U.S. energy independence.
CMHC is not so sure. In November 2015 CMHC had a private audience in New York City and brought along a stress test of $35/bbl oil and its potential effect on Canada. I covered the bullet points here. The Department of Finance is also worried:
The age-related deceleration in economic growth in Canada will take place amidst other powerful, slow-moving global forces. As in Canada, the world population is aging and productivity growth (Canadian Productivity Chart bottom of this page) has slowed across OECD countries. These structural forces are paving the way to slower global growth for the next number of years. Slower nominal GDP growth will thus reduce the growth rate of government revenues, thereby limiting the capacity of governments to continue to maintain the growth rates of public expenditure at levels as high as in the past. At the same time, population aging is also expected to put upward pressure on public expenditure, notably for age-related programs such as elderly benefits. Department of Finance Canada December 2016
It remains interesting to note that the combined average sum price of a Vancouver, Calgary & Toronto condo is currently 49% (no typo) more expensive than a median priced Montreal SFD. The record previously was 41% in July 2016 (the Vancouver peak).
- *Toronto GTA SFD prices began March 2009. Prior data are Combined Residential +24.5%.
- *Ottawa SFD prices began January 2009. Prior data are Combined Residential +6.9%.
- *Montreal SFD DATA changed from Average to Median in March 2007
- *Vancouver SFD data are HPI®, not Average.
….also:

The chart shows the bulls in charge prior to the 2007-2008 plunge that took the average Vancouver SFD price down $122,900, or 15.9% in 8 months (24% per year drop). The crash derailed the exponential doubling trend but after reignition prices doubled again in June of 2016 at $1,542,642 + $18,858. The next double was scheduled for around December 2021, but it is now unlikely that buyers are as fearful of missing out as they were in 1H 2016.
…also:
In February 2017, Vancouver detached house prices added very little drama to the slump from the July peak under the heavy weight of sentiment change and sales that are 53% below their March 2016 peak. The manic detached buying spree moved prices up 21.5% per year since the JAN 2013 low. Prices now are deflating at 11.4% since the peak in July 2016.

-
I know Mike is a very solid investor and respect his opinions very much. So if he says pay attention to this or that - I will.
~ Dale G.
-
I've started managing my own investments so view Michael's site as a one-stop shop from which to get information and perspectives.
~ Dave E.
-
Michael offers easy reading, honest, common sense information that anyone can use in a practical manner.
~ der_al.
-
A sane voice in a scrambled investment world.
~ Ed R.
Inside Edge Pro Contributors

Greg Weldon

Josef Schachter

Tyler Bollhorn

Ryan Irvine

Paul Beattie

Martin Straith

Patrick Ceresna

Mark Leibovit

James Thorne

Victor Adair