

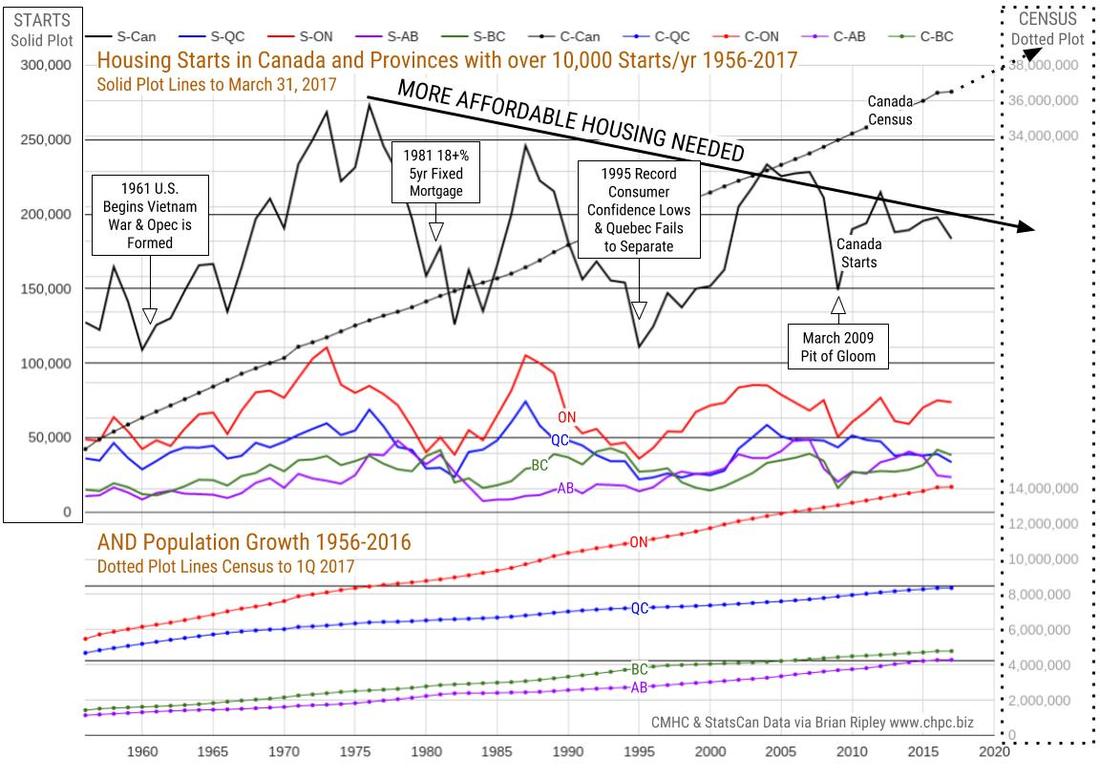
NOTE: The chart below shows the actual annual totals count from 1956 through 2016.
The 2017 data points on the chart are derived from the “annualized” provincial data set in the charts above and are therefor a projection of what year end 2017 might look like.
…..read more HERE including City, Provincial charts broken down
…related: Toronto, Hamilton and Victoria push Canada to another record on house prices


