Real Estate

“Real” Gold & Real Housing Price of Van+Cal+Tor Priced in USD

 goldchcp

Larger Chart

The chart above shows the “real” price of the TSX real estate index (RE/CCI green dotted plot line) and the “real” price of the TSX gold index (Gold/CCI yellow dotted plot line).

….read more HERE

goldchcp1

Larger Chart

The chart above shows the “real price” of Vancouver, Toronto & Calgary SFDs when looked at from the point of view of the BoC Canadian Commodity Index (CCI) and Borrowing Costs (retail 5yr Mortgage) which are the main input costs apart from operating expenses and tax.

….read more HERE 

goldchcp2

Larger Chart

COMPARE PRICES in $CAD and $USD for Single Family Detached Houses in Vancouver, Toronto and Calgary with FX and Crude Oil Notations

…read more HERE

Is the Housing Rally Over?

With soft housing data last week and higher interest rates expected, it is a good time to ask:

Is the housing rally over?

Last Week Recap

The big economic news last week was the Fed policy decision and guidance. Friday’s announcement of the Amazon purchase of Whole Foods grabbed the headlines. Attorney General Sessions’ Senate Testimony got the gavel-to-gavel treatment.

Our question from last week – a possible change in market leadership – did attract some discussion. Friday’s grocery news is still being digested, but the sector shifts were pronounced.

The Story in One Chart

I always start my personal review of the week by looking at this great chart from Doug Short via Jill Mislinski. Despite the mid-week Fed announcement, the result for the week was barely changed.

f7f49ea8e2de282d558c32a491fb4787

….continue reading HERE


Pop Goes The Housing Boom… In Canada

766147-14975422266578183Summary

China’s new controls seek to slow down capital flight.

Canada’s housing boom is vulnerable.

The Canadian dollar’s rally is overdone.

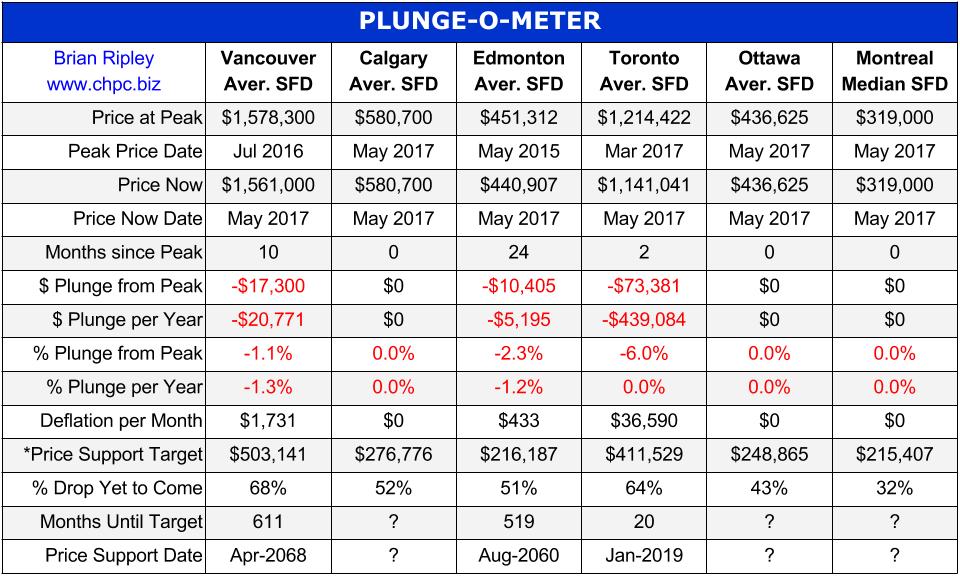
We’re headed for another housing bust. This time in Canada. And the key is China.

It’s no secret that Chinese investors, seeking asylum from the slow-motion credit bust underway there, have been dumping tons of cash into Canadian real estate.

But it looks like a number of events are coming together at the same time to blow up that market before the end of 2017.

…continue reading HERE

Canada 6-City Housing & the Plunge-O-Meter


​The chart above shows the average detached housing prices for Vancouver*, Calgary, Edmonton, Toronto*, Ottawa* and Montréal* (the six Canadian cities with over a million people each) as well as the average of the sum of VancouverCalgary and Toronto condo (apartment) prices on the left axis. ​On the right axis is the seasonally adjusted annualized rate (SAAR) of MLS® Residential Sales across Canada (one month lag).
 

The Canadian Real Estate PLUNGE-O-METER

chart-plunge-o-meter 5 orig
 
The Plunge-O-Meter tracks the dollar and percentage losses from the peak and projects when prices might find support. On the price chart in the spring of 2005 there was a 4-6 month plateau period while buyers and sellers twitched like a herd. When the credit spreads narrowed and the yield curve began its journey towards inversion, the commodity stampede began.


Compare Toronto & Vancouver Housing

chart-compare-vancouver-toronto 6 orig

 
Single Family Detached, Town House and Condo Prices and Total Residential Listings and Sales and the Absorption Rates as well as INSIDE AIRBNB below.
 
The chart above shows the HPI® prices for Vancouver and average prices for Toronto (solid plot lines) as well as the Monthly Absorption Rate ​(MAR = Sales/Listings as dotted plot lines). 

At the old Vancouver price peak in April 2012 before Torontonians joined the party, Vancouver metro SFDs were 64% more expensive than Toronto comparables. In July 2016 at the peak of Vancouver SFD prices, they were 65% more expensive. The gap is closing quickly; it’s narrowed down to 33%, and now strata prices are similar within 9% of each other.

In March 2017 the Monthly Absorption Rate based on total inventory and total residential sales hit 154% in Toronto vs Vancouver at 47%. Vancouver may have led the FOMO crowd up the ladder, but Toronto maybe sending them down the snake.

click HERE to view attempt to visualize the distortions of the market