
Op/Ed
Each week Josef Schachter gives you his insights into global events, price forecasts and the fundamentals of the energy sector. Josef offers a twice monthly Black Gold newsletter covering the general energy market and 30 energy, energy service and pipeline & infrastructure companies with regular updates. We also hold quarterly webinars and provide Action BUY and SELL Alerts for paid subscribers. Learn more.
EIA Weekly Oil Data: The EIA data of Wednesday November 24th was mixed. US Commercial Crude Stocks rose 1.0Mb (forecast a decline of 481K) as Net Imports rose 1.26Mb/d. The key was a decline in Exports of 1.02Mb/d. Refinery Utilization Rose by 0.7 points to 88.6% from 87.9% in the prior week. Total Motor Gasoline inventories fell 0.6Mb while Distillate volumes fell 2.0Mb. US Crude Production rose by 100Kb/d to 11.5Mb/d back to the year high so far. Total Demand rose by 123Kb/d to 21.75Mb/d. Gasoline consumption rose before the US Thanksgiving long weekend by 92Kb/d to 9.33Mb/d which is just above the 9.20Mb/d consumed in 2019 at this time. Jet Fuel Consumption rose 125Kb/d to 1.51Mb/d versus 1.88Mb/d consumed in 2019 during that holiday season travel time. Cushing Inventories rose 800Kb to 27.4Mb/d.
EIA Weekly Natural Gas Data: Weekly injections continue as we get close to the winter withdrawal season. Last week there was an injection of 26 Bcf, lifting storage to 3.644Tcf. The five year average for last week was a withdrawal of 26 Bcf. Storage on a five-year basis was 3.735Tcf so storage is only 2.2% below the five-year average. Injections for the last nine weeks have been above 2020 levels so NYMEX prices have retreated 22% from their robust levels of US$6.47/mcf in early October when there was fear of too low storage levels for the upcoming winter. NYMEX today is US$5.03/mcf and AECO spot is at $3.77/mcf down over $2/mcf from recent highs. As to be expected, natural gas stocks have retreated from their 2021 highs.
Baker Hughes Rig Data: The data for the week ending November 19th showed the US rig count rose by seven rigs (up by six rigs in the prior week). Of the total of 563 rigs working last week, 461 were drilling for oil and the rest were focused on natural gas activity. This overall US rig count is up 82% from 310 rigs working a year ago. The US oil rig count is up 100% from 231 rigs last year at this time. The natural gas rig count is up a more modest 34% from last year’s 76 rigs, now at 102 rigs. Texas saw an increase of seven rigs last week to 271 rigs and was up 88% from 144 rigs last year. The Permian saw an increase of six rigs to 278 working and was up 78% from 156 rigs working last year.
Canada had a decline of one rig (versus a rise of eight rigs in the prior week) to 167 rigs. Canadian activity is now up 65% from 101 rigs last year. There was one more oil rig working last week and the count is now 102 oil rigs working, up from 42 last year. There are 65 rigs working on natural gas projects now, up from 59 last year.
The material increase in rig activity over a year ago in both the US and Canada should continue to translate into rising liquids over the coming months, especially with the DUC count (drilled but uncompleted well count) at very low levels. The data from many companies on their plans for Q4/21 and forecasts for 2022 support this rising production profile expectation. We expect to see US crude oil production reaching 12.0Mb/d before the end of 2021. Companies are taking advantage of attractive drilling and completion costs and want to lock up experienced rigs and crews as staffing issues are getting tougher for the sector.
Conclusion:
Bearish pressure on crude prices:
- A coordinated effort by consuming nations to lower rising gasoline prices by opening their strategic reserves (SPR’s) appears to include China, India, Japan, South Korea, the UK and the US. Total releases may be in the range of 100-120Mb (US 50Mb) or just over one day of world demand. This may not be enough to lower prices immediately but should open up a Pandora’s box for OPEC as consuming nations balk at their current pricing and production policies. OPEC holds its next meeting on December 2nd. They increased production by 486Kb/d in September (exceeding nicely the 400Kb/d approved level) but in October they increased volumes by only 217Kb/d. What level they approve at that meeting may force consumers to lift SPR sales even more (US has 604 Mb).
- The US may increase pressure on top of SPR sales by cutting off all imports from OPEC countries. Last week the US imported a total of 496Kb/d from only three OPEC countries (mostly from Saudi Arabia – 453Kb/d – the rest from Iraq and Nigeria) and could easily cut them off from sales access to the biggest consuming nation. The US imports the largest amount of needed crude from Canada at 3.43Mb/d (61% of the total). To replace OPEC crude the US could import more from Canada or from Mexico, Colombia, Ecuador, Brazil and Trinidad which also supplied the US last week. The US is also considering a new ban on crude exports which was allowed to start in 2015 after a 40-year ban.
- Covid caseloads are growing around the world. In the US, the death rate is over 772K deaths (up 8,000 during the last week). Worldwide, the death count is now 5.16M. Deaths are rising in Europe particularly in Austria (imposing lockdowns on the unvaccinated with fines of $30K, Bulgaria, Czech Republic, Croatia, Germany (now over 51K new daily cases plans to tighten restriction next week), Netherlands (21,615 new daily cases), Romania, Russia, Slovakia, Slovenia, and Ukraine. South Korea is now facing record caseloads and is planning to tighten up their economy. If they and Germany tighten up, that will add to world supply chain problems and slow economic growth.
- Energy demand is under pressure as high prices for most food, rent, taxes, child care, health expenses, auto costs and other daily necessities make spending decisions tougher for consumers. This gouge in prices will surely impact consumers’ buying behaviour in the coming months. The spending pie of consumers is shrinking and some spending habits of the past will have to be dropped. Demand destruction is on the way. Recent US economic releases indicate that we may already be in the early stages of a recession.
- China has seen a rising wave of new infections in 19 of its 31 provinces. Many industrial plants in China have been closed due to the high cost of fuel and the Government’s plan to lower emissions in the Beijing area for the upcoming 2022 winter Olympics from February 4th to the 20th. Clean air is needed for the event and China wants to show it is making progress on its climate initiatives.
Bullish pressure on crude prices:
- OPEC may be considering lower crude exports to offset sales from SPR’s of the consuming countries planning such sales to keep world inventories tight. The December 2nd meeting in Vienna will be closely watched for the next phase of this tussle.
- Speculative long investors (options traders, hedge and commodity funds) and a short squeeze on bearish positions in the futures and options markets on crude, have spiked up prices. Energy bulls like Bank of America see US$120/b by June 2022.
- The Iran deal may not see much progress in the coming months so the concern about 1-2Mb/d of new Iranian oil is abating.
- JP Morgan and other US investment banks see world demand exceeding pre-pandemic levels in Q2/22.
CONCLUSION:
WTI is at US$78.46/b unchanged from last week despite the SPR sales and the retaliatory comments by OPEC members. Crude has retreated over 8% from the high in late October. We see prices as still having US$20-25/b of speculative value which should disappear as demand weakens in the US and China as they both appear to be headed into recessions. If repeated economic data comes out supporting recessionary conditions, the oil price slide could be quick and painful. Leveraged speculative longs in crude oil futures are vulnerable to nasty margin calls in the future.
Energy Stock Market: The S&P/TSX Energy Index currently trades at 169, up four points from last week as investors jump on OPEC’s talk of restricting future supplies. We think that the supply side bullish view will be trounced by the weakened demand side as the two biggest economies face slower growth and move towards recession. Add in problems in Germany, Japan and South Korea and the world’s economic juggernauts will offset any supply moves by OPEC. Remember regular recessions can lower world demand by 2-5Mb/d rising to over 8Mb/d of lower demand as was seen during Covid-impacted 2020.
Josef will be away next week. Our next ‘Eye on Energy’ issue will come out on Wednesday December 8th.
Our November Schachter Energy Report Monthly comes out tomorrow Thursday November 25th with detailed updates on 25 companies that have released their Q3/21 report since our Interim Report.
Become a subscriber if you would like to access the archive of the webinar and all our previous SER reports. Go to https://bit.ly/34iKcRt to subscribe.
If you enjoy reading our weekly ‘Eye on Energy’ feel free to forward it off to friends and colleagues. We always welcome new subscribers to our complimentary macro energy newsletter.
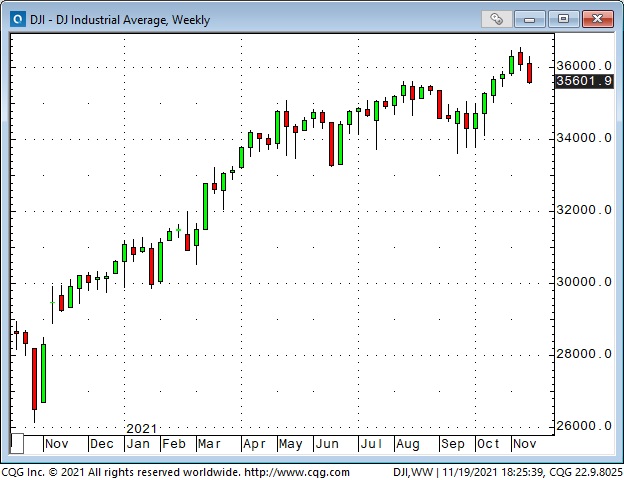
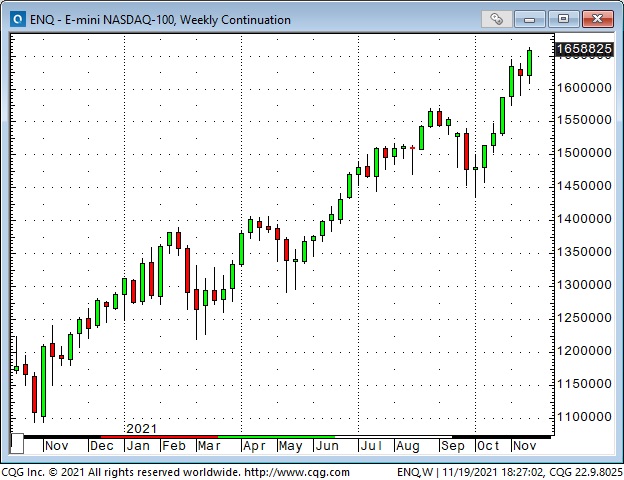
A handful of BIG cap tech stocks make all the difference
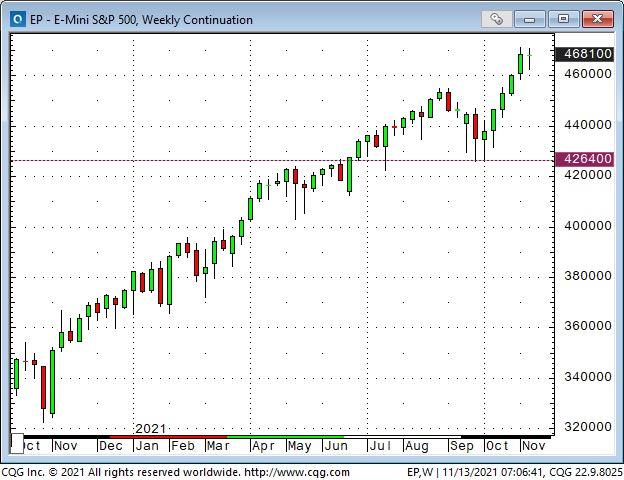
The DJIA and the small-cap indices closed lower for two consecutive weeks (the DJIA fell as much as 1,000 points from last week’s high to this week’s low) – but the Nasdaq and the S+P 500 indices hit new All-Time Highs this week.
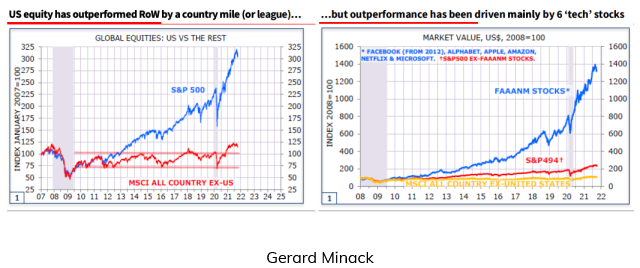
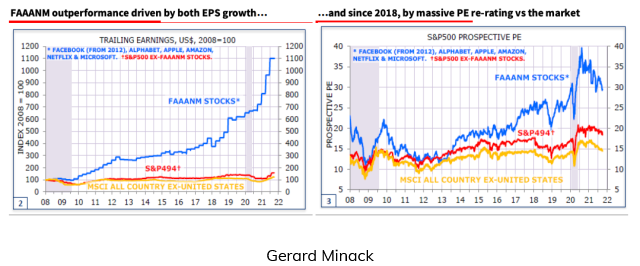
The American stock market has massively outperformed the Rest Of the World – largely thanks to the same handful of BIG cap tech stocks.
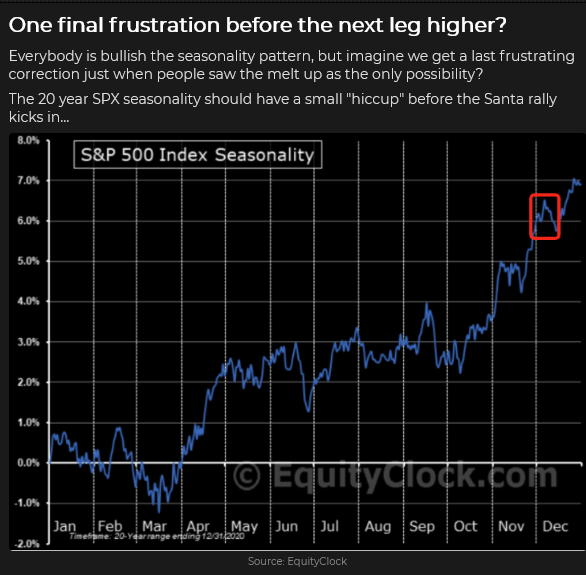
The S+P and Nasdaq keep tracking the seasonal trends – momentum trumps valuations.
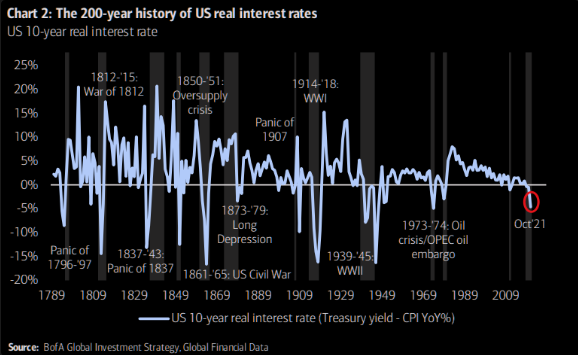
American real interest rates hit the deepest negative level of our lifetime
The recent inflation surge means the difference between nominal rates and after-inflation rates has dropped more deeply negative. A critical aspect of deeply negative real interest rates is that they add to the “pressure” of capital flowing into risk assets. Deeply negative real rates mean that people who should be “savers” become “traders” – reaching for yield in risky markets.
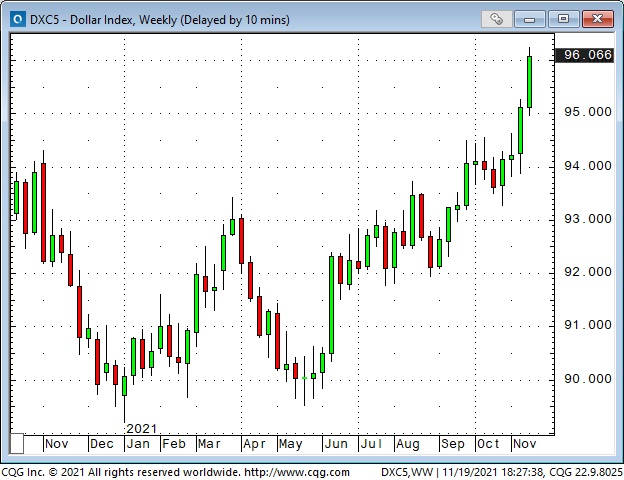
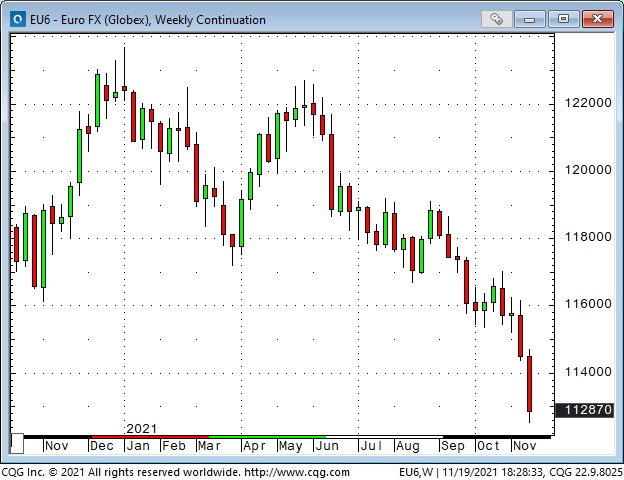
The purchasing power of the US Dollar is falling – except when it comes to buying other currencies
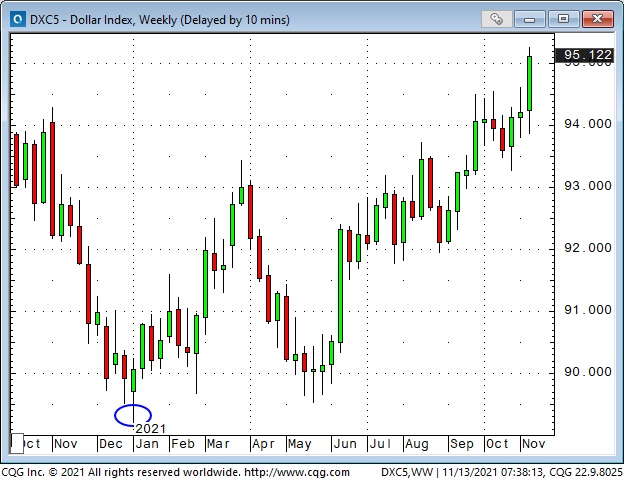
The USD hit (what I called) a cathartic inflection point on Wednesday, January 6, 2021, when the mob stormed the Capitol Building in Washington, DC. It was a 34-month low for the US Dollar Index, and since then, it has rallied ~ 8%.
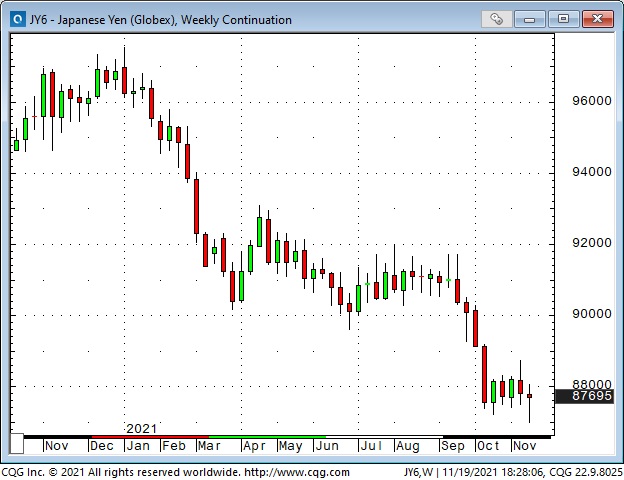
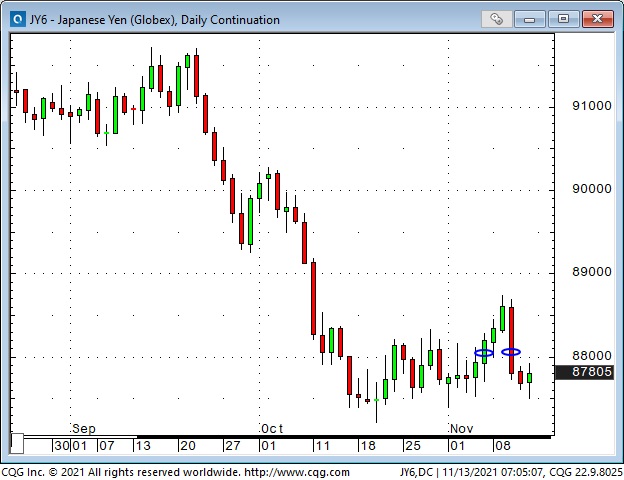
The Japanese Yen has tumbled ~10% since January, hitting a 56-month low this week.
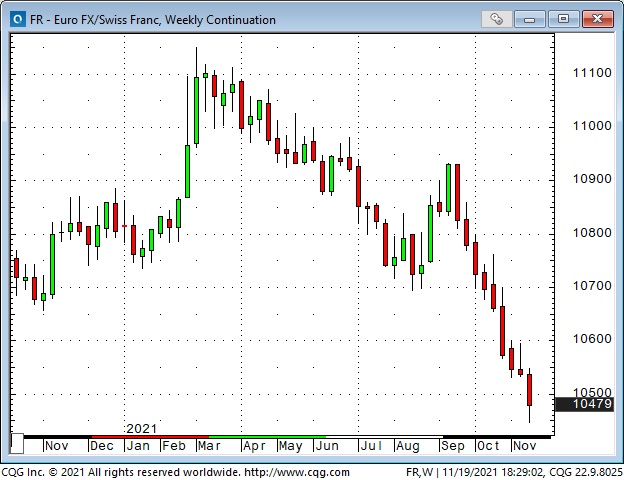
The Euro currency has fallen ~8% against the USD since early June. Against the Swiss Franc, the Euro is down 6% (near All-Time record lows) during that same period. I look at the Euro falling against the Franc as a sign that European citizens are moving money to “safety” because they are unhappy with or fearful of the political/economic climate in Europe.
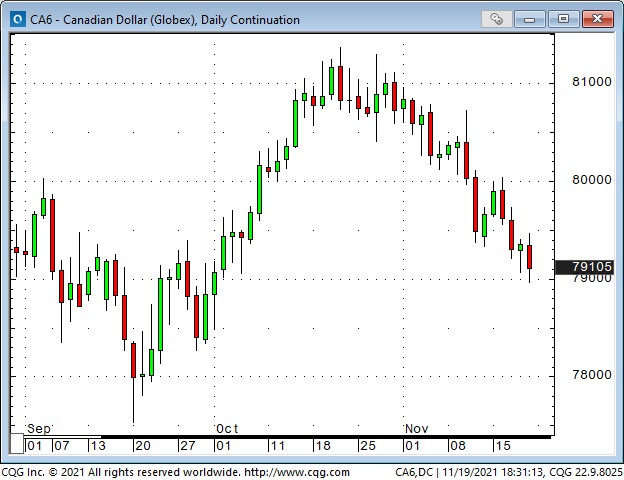
The Canadian dollar hit a 4-year low at ~68 cents during the Covid Crisis of March 2020 but rallied to 83 cents (22%) at this year’s high as 1) the USD trended lower and 2) commodity and stock markets trended higher.
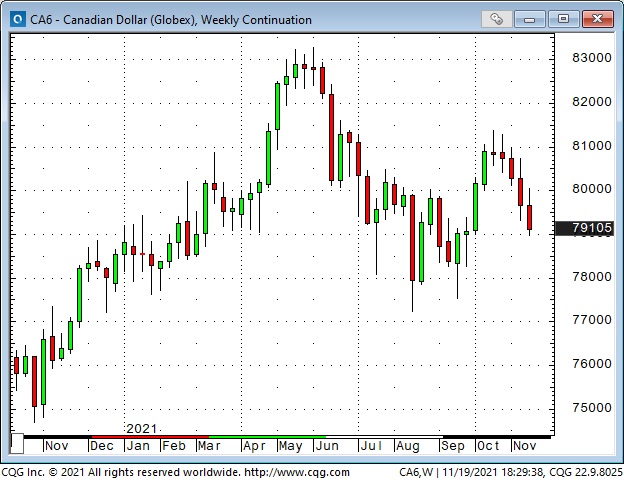
The CAD peaked at ~83 cents in June as the USD started to trend strongly higher and rolled over from a lower peak in October as the commodity indices (and crude oil especially) dropped away from 7-year highs.
With the USD making solid gains against virtually all currencies this month, it is hard to tell if the CAD is suffering from the effects of the extensive flooding on the West Coast, which has crippled vital transportation links.
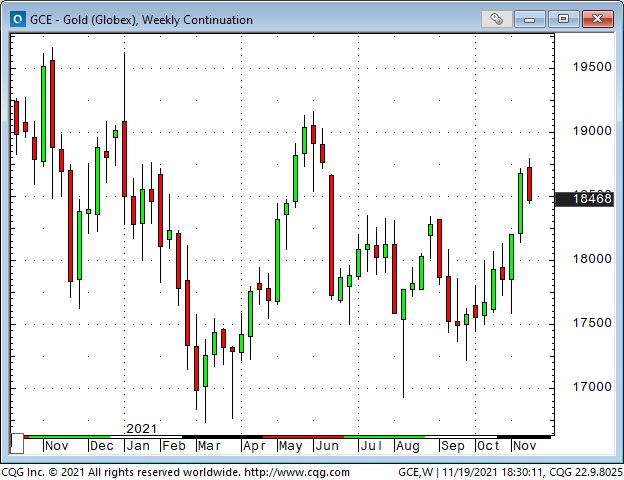
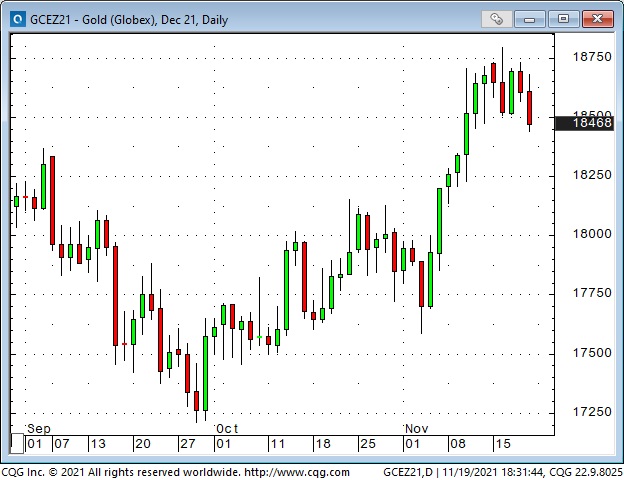
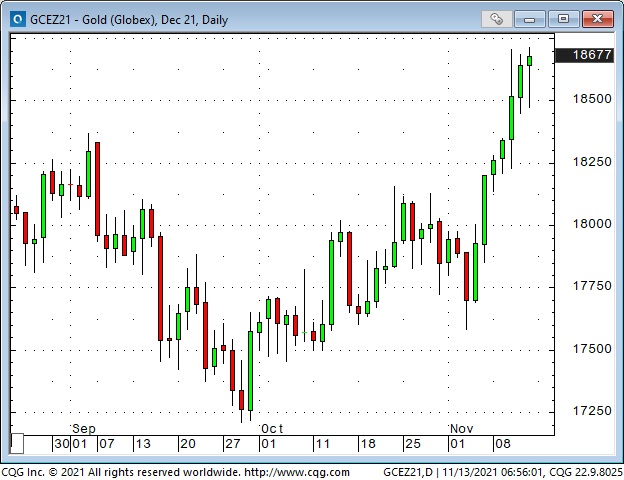
Gold surged over $100 the past two weeks – but fell back this week
Gold rallied the last two weeks even as the USD rallied – and that’s unusual outside of “haven buying” on a geopolitical event. The rally broke through several key technical levels and was accompanied by a 20% surge in open interest. Net speculator long positioning in the futures market soared.
Crude oil and commodity indices fell away from multi-year highs in September
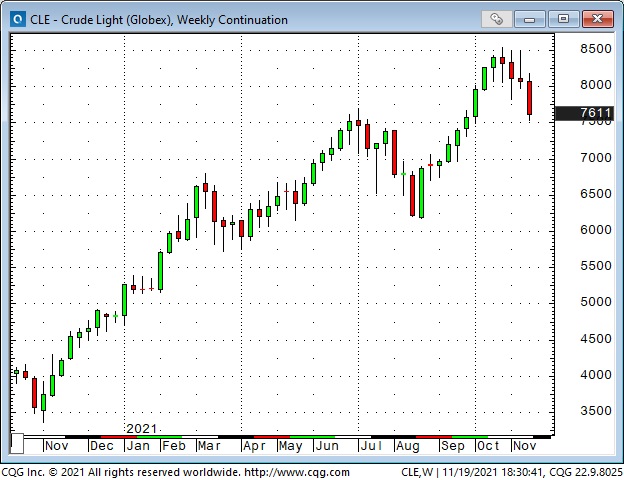
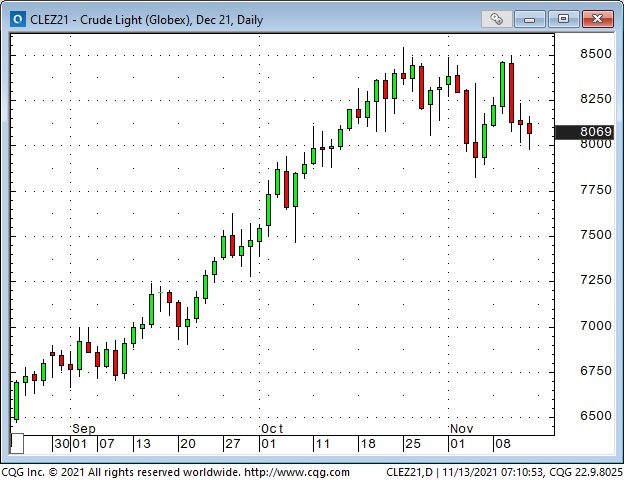
WTI rallied from ~$62 to ~$85 (37%) from August to October as “re-opening” demand surged and OPEC+ made only modest production increases. The need for crude “right now” caused a very sharp increase in the price of nearby futures over deferred futures during October, but a lot of that has faded away as front-month prices have dropped from ~$85 to ~$75.
This chart shows that the Dec 2021 contract was a $1 premium over the Mar 2022 contract in early September. Soaring “demand” for WTI crude drove the premium to nearly $5.50 by November 1st. It has now dropped back to ~$2 as crude prices have fallen.
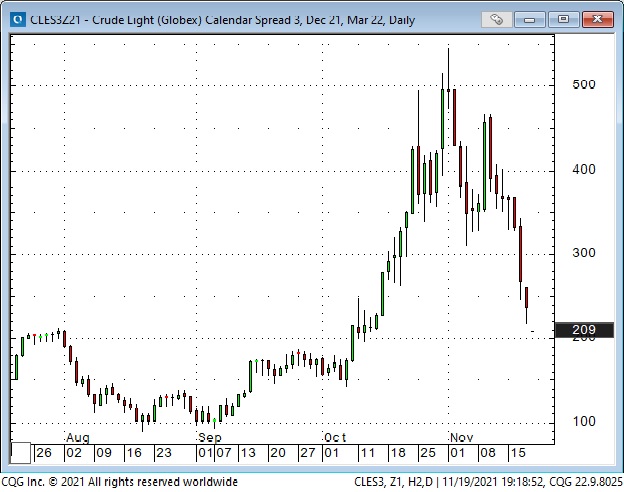
Speculators may also have “backed away” from bullish positioning on concerns of a coordinated global release of government crude oil reserves and worries about rising covid cases.
My short term trading
I started this week with no positions, but after doing my homework last weekend, I developed a “bias” that the “runaway inflation narrative” had gone too far too fast. I decided to look for opportunities (price action setups) to fade that narrative.
I shorted gold, crude, the S+P and the CAD on Monday. I was quickly stopped for a slight loss on the S+P. I was stopped on gold Tuesday, also for a small loss, but I re-shorted the market as it fell back below Monday’s lows (gold had a daily key reversal down on Tuesday.)
I was also stopped on my short WTI position Tuesday, and I regret not finding a spot to re-short that market as it dropped $5 by Friday’s lows.
I took profits on the short CAD ahead of the weekend. I was puzzled that the CAD wasn’t weaker, given the USD’s strength and the economic disaster unfolding on Canada’s West Coast.
Going into the weekend (ahead of the US Thanksgiving week), the only position I hold is short gold. My realized P+L for the week is flat; I have decent unrealized gains on the gold position, which ended the week right on its lows.
On my radar
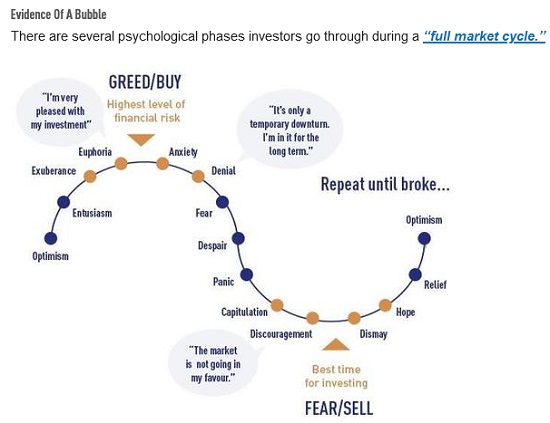
I continue to think that the stock market is at the “Euphoria” stage of the “full market cycle,” so I will keep looking for price action setups to probe with short positions.
I think the “central banks are WAY behind and will have to tighten” narrative is overdone (or at least, fully priced in), as is the “runaway inflation” narrative, so I will look for price action setups to fade those sentiments.
President Biden has said he will announce his decision about the Fed Chair before Thanksgiving. Betting sites see Powell being re-appointed – if Biden wants to replace him the markets won’t like that.
Thoughts on trading
I recorded a 30-minute interview on November 19 with Howestreet radio. I talk about what I’m seeing in several different markets, and some of the trades I’m making. Access is free.
Last week I invited readers to tell me what they would like to see in the TD Notes. Several people asked for more detail on how I trade. Here is an edited version of my reply to one of those readers:
First, I form an “opinion” about a market. For instance, the stock market has HUGE upside momentum for several reasons, but my s/t opinion is that retail FOMO has “taken it too far, too quickly.” I think it could experience a quick, nasty correction – which could morph into a more significant downside move (for instance, if it takes out the Sept lows.)
My “opinion” gets me looking for an opportunity – a setup – to get short. This trade would be an initial position. If the market fell, I would look for a setup to increase my short position.
My “opinion” is not a timing tool – price action is the timing tool. I can’t sell a market without regard to price action simply because I think there is a “good chance” that it will be lower in the future.
The S+P made a new ATH within the first hour of the “day session” on Friday, November 5 – but then started to fall back. I got short an hour later with a stop just below the ATH. The market took a swift 35 point drop from the ATH and closed the day below the mid-point of the day’s range. I felt OK staying short over the weekend. If the trade had been in the red by Friday’s close, I would have exited the trade (and cancelled the stop – the stop was intended to protect me if the market had a swift rally while I wasn’t looking.) I would not want to carry a money-losing short position into the weekend with the market in a powerful uptrend. (The Friday closing price is often the most valuable price of the week.)
The market rallied during the Sunday “overnight” session and the opening range of the Monday “day session” – and nearly hit my stop – but it then drifted lower for the next couple of days. By the Wednesday lows, I was ~75 points ahead on the trade. That was “decision time.”
Wednesday’s lows (4625) had been a resistance level in early November. If the market could break below 4625, I could see it falling another 75 points. I decided to stay with the trade – to give it the chance to become a BIG winner. But for risk management purposes, to protect my P+L, I lowered my stop to lock in at least a small gain.
The market turned higher from Wednesday’s lows, and I was stopped for a small profit (~20 points) on Friday, one week after entering the trade.
To wrap up: My process is to form an opinion about a market (I follow dozens of markets, and most of the time, I have no motivating view on many of them.) When I have a “strong” opinion, I look for confirmation from the price action. I look for a price action setup. For example, I might get short if I’m bearish and the market has just made a lower high. Maybe the market will fall, but, at least on some time horizon, I’m not trying to top-pick a rising market. I also need to have a potentially good risk/reward ratio for the trade given where I would place my stop – a point where I know I’m wrong to be short.
Best wishes,
Victor
Two weeks ago, I included a link to a video done by Goehring & Rozencwajg. As I watched their video, I was thinking, “If their ideas are correct, then a TON of capital is mal-invested in the energy markets – where’s the trade?”
Here’s a link to another (5-minute) video that also makes the case that a TON of capital is mal-invested in the energy markets – and if that’s true, it will create many great trading opportunities.
Another reader sent a link to a beautiful little piece (a 4-minute read) that makes the point that amateurs will win more by avoiding stupid mistakes – rather than trying to be brilliant. This message applies to trading/investing BIG TIME.
Raoul Pal and Keith McCullough
I watched a fabulous 1-hour video interview between Raoul Pal (founder of RealVisionTV) and Keith McCullough (founder of Hedgeye.) The video is about Crypto – Macro – Regime Change – and how Millennials are HUGELY different than Boomers (and how that changes everything in markets now that the Mills out-number the Boomers.) Both men are deep thinkers and very successful traders.
This video is one of the best explanations of crypto and what it is likely to become that I have ever seen. I loved Raoul’s perception (near the end of the video) of the Regime Change underway as Millennials view RISK much differently than Boomers!
Quotes from the Notebook
Trying to predict a trend is hard. Trying to predict the end of a trend is even harder. (Therefore) picking stocks to buy is a better use of your time than trying to pick stocks to short. Jared Dillian 2021
My comment: I agree with Jared, but it’s in my nature to look for opportunities to fade irrational exuberance or to call “Bullshit!“
My fundamental premise in trading is that “When” is much more important than “Why.” Raoul Pal in the video noted above. 2021
My comment: I agree. I remember taking a phone call from a client many years ago when I was a commodity broker. He wanted to discuss some ideas he had about a market. After our chat, he asked me to buy some contracts for him – at the market. I wondered, “why now? Just because we’re on the phone doesn’t mean that this is the best time to enter the market.”
You can have your ideas about “why” a market should be doing something (I call it having an “opinion,” but instead of trying to be brilliant, reduce the chances of doing something stupid by concentrating on “When” you enter the market.
A small request
If you like reading the Trading Desk Notes, please do me a favour and forward a copy or a link to a friend. Also, I genuinely welcome your comments. Would you please let me know if there is something you’d like to see included in the TD Notes? Thanks, Victor
Barney getting set to hit the “irrational exuberance” bid

Subscribe: You have free access to everything on this site. Subscribers receive an email alert when I post something new – usually 4 to 6 times a month.
Victor Adair retired from the Canadian brokerage business in 2020 after 44 years and is no longer licensed to provide investment advice. Therefore, this blog, and everything else on this website, is not intended to be investment advice for anyone about anything.
Each week Josef Schachter gives you his insights into global events, price forecasts and the fundamentals of the energy sector. Josef offers a twice monthly Black Gold newsletter covering the general energy market and 30 energy, energy service and pipeline & infrastructure companies with regular updates. We also hold quarterly webinars and provide Action BUY and SELL Alerts for paid subscribers. Learn more.
EIA Weekly Data: The EIA data of Wednesday November 17th was mixed. US Commercial Crude Stocks fell 2.1Mb (forecast 135K decline) as Net Imports fell 490Kb/d, reducing inventories by 3.43Mb. If this had not occurred there would have been a 1.1Mb build. The key subcomponent Exports showed a rise of 573Kb/d which indicates exports rose by 4.0Mb last week, lowering US Commercial Crude levels. Refinery Utilization Rose by 1.2 points to 87.9% from 86.7% in the prior week. Total Motor Gasoline inventories fell 0.7Mb while Distillate volumes fell 0.8Mb. US Crude Production declined 100Kb/d to 11.4Mb/d. Total Demand rose by 2.34Mb/d to 21.63Mb/d as Other Oils demand rose by 2.20Mb/d. Gasoline consumption fell 18Kb/d to 9.24Mb/d which is just above the 9.19Mb/d consumed in 2019 at this time. Jet Fuel Consumption rose 206Kb/d to 1.38Mb/d versus 1.66Mb/d consumed in 2019 at this time. Cushing Inventories rose 200Kb to 26.6Mb/d.
Baker Hughes Rig Data: The data for the week ending November 12th showed the US rig count rose by six rigs up by six rigs in the prior week. Of the total of 556 rigs working last week, 454 were drilling for oil and the rest were focused on natural gas activity. This overall US rig count is up 78% from 312 rigs working a year ago. The US oil rig count is up 93% from 236 rigs last year at this time. The natural gas rig count is up a more modest 40% from last year’s 73 rigs, now at 102 rigs.
Canada had a rise of eight rigs (a decline of six rigs in the prior week) to 168 rigs. Canadian activity is now up 89% from 89 rigs last year. There were six more oil rigs working last week and the count is now 101 oil rigs working, up from 39 last year. There are 67 rigs working on natural gas projects now, up from 50 last year.
The material increase in rig activity over a year ago in both the US and Canada should continue to translate into rising liquids and gas production over the coming months, especially with the DUC count (drilled but uncompleted well count) at very low levels. The data from many companies on their plans for Q4/21 and forecasts for 2022 support this rising production profile expectation. We expect to see US crude oil production reaching 12.0Mb/d before the end of 2021. Companies are taking advantage of attractive drilling and completion costs and want to lock up experienced rigs and crews as staffing issues are getting tougher for the sector.
Conclusion:
Bearish pressure on crude prices:
- Covid caseloads are growing around the world. In the US, the death rate is over 764K deaths (up 8,000 during the last week). Worldwide, the death count is now 5.11M. Deaths are rising in Europe particularly in Austria (imposing lockdowns on the unvaccinated with fines of $30K if they leave homes when not essential), Bulgaria, Croatia, Germany, Netherlands, Romania, Russia, Slovakia, Slovenia, and Ukraine.
- Many US corporate and government employees are not planning on getting vaccinated and are now being put on unpaid leave and may soon lose their jobs. Eighty million individuals have a shotgun decision by January 4th (delayed by one month to cover off Christmas deliveries) when the cut-off kicks in. NO JAB, NO JOB is the vaccination mantra. The US military, police and firefighters are being significantly affected.
- Energy demand is under pressure as high prices for most food, rent, taxes, child care, health expenses, auto costs and other daily necessities make spending decisions tougher for consumers. This gouge in prices will surely impact consumers’ buying behaviour in the coming months. The spending pie of consumers is shrinking and some spending habits of the past will have to be dropped. Demand destruction is on the way. Real US GDP grew 6.7% in Q2/21 and was seen at only 2% in Q3/21. Recent economic releases indicate that we may already be in the early stages of a recession. The US$1.2T infrastructure bill signed into law by President Biden will only add to US inflationary pressures.
- The UAE and the IEA now see 2022 as having sufficient supplies and that inventories will start to build after winter 2021-2022 is over. We concur!
- China has seen a rising wave of new infections in 19 of its 31 provinces. Many industrial plants in China have been closed due to the high cost of fuel and the Government’s plan to lower emissions in the Beijing area for the upcoming 2022 winter Olympics from February 4th to the 20th. Clean air is needed for the event and China wants to show it is making progress on its climate initiatives. China’s General Administration of Customs reported yesterday that imports of crude oil in October were down by 1.5Mb/d from 10.5Mb/d to 9.0Mb/d as the smog issue was being focused on. They are breaking US sanctions by buying 560Kb/d from Iran and 57Kb/d from Venezuela, leaving less oil to non-sanctioned OPEC members under the deal provisions. In Monday’s virtual meeting between President Xi and President Biden they discussed using their Strategic Petroleum Reserves (SPR’s) to lower prices in their domestic markets and send a warning signal to OPEC+ that current prices are unacceptable. If they cut back or ordered nothing from OPEC for some set period of time, OPEC would be in big trouble quickly.
- Iran is returning to the negotiating table on November 29th and if progress is made, then at some point in the future they may get sanction relief and be able to add 1-2Mb/d fairly quickly.
Bullish pressure on crude prices:
- Speculative long investors (options traders, hedge and commodity funds) and a short squeeze on bearish positions in the futures and options markets on crude have spiked up prices. Energy bulls like Bank of America see US$120/b by June 2022.
- Spot natural gas prices in Europe have backed off after President Putin confirmed that Russia would meet all European winter needs once they open the Nord Stream 2 Pipeline, which is now being filled and undergoing pressure tests before certification. This new pipeline doubles Russia’s annual export capacity to Europe. The most recent problem/delay is that German regulators want Nord Stream to set up a German company with a headquarters and manpower before completing the regulatory requirements. This was supposed to be completed in January 2022 in time for the worst of winter natural gas needs but may now be delayed by four months. Natural gas prices in Europe have lifted again and this is supportive of crude prices.
- In the US, NYMEX today is now at US$5.12/mcf – and in Canada AECO is C$4.37/mcf as storage levels have been built up sufficiently for a normal winter. US storage injections for the last six weeks have been above the five year average and over 2020 injection levels.
CONCLUSION:
WTI is down nearly 2.5% or US$2.03/b today to US$78.73/b as the US and China bring pressure on OPEC+. We see prices as having US$20-25/b of speculative value which should disappear as demand weakens in the US and China as they both could be headed into recessions. If the data comes out supporting recession conditions, the oil price slide could be quick and painful. Leveraged speculative longs in crude oil futures are vulnerable to nasty margin calls in the future.
Energy Stock Market: The S&P/TSX Energy Index currently trades at 165, flat with last week. The S&P Energy Bullish Percent Index backed off from the 100% SELL level to 80.9% now. Energy stocks could fall 30-40% in the coming months with leveraged entities the hardest hit.
Our November Schachter Energy Report Monthly comes out Thursday November 25th with details on the general stock market and its expected impact on the energy sector as well as reviews and updates on 25 companies that have released their Q3/21 report since our Interim Report.
We held our 90 minute Q4/21 quarterly Black Gold Webinar on Wednesday November 10th at 7PM MT. It was very well received. We discussed in detail our view on the general stock market, the energy market and our bearishness on both areas for the near term. We also discussed the companies that had already reported their Q3/21 results. They are broken up into presentations on those that reported good results (11 companies) and those with not so good reports (nine companies). We had two Q&A sessions to go over our presentation materials and subscriber questions.
Become a subscriber if you would like to access the archive of the webinar and all our previous SER reports. Go to https://bit.ly/34iKcRt to subscribe.
If you enjoy reading our weekly ‘Eye on Energy’ feel free to forward it off to friends and colleagues. We always welcome new subscribers to our complimentary macro energy newsletter.
The hotter-than-expected US CPI report rocked the markets Wednesday morning
Gold spiked nearly $50 within 90 minutes of the CPI report and ended the week ~$100 (6%) above last week’s lows.
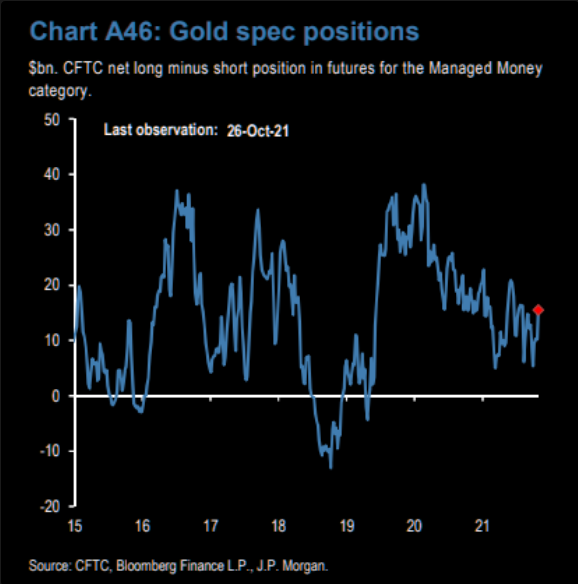
Speculators in the gold futures market were net long a modest-sized position (relative to their position the past few years) as of Oct 26. I expect there has been a substantial increase since!
Silver spiked ~$1.10 within 90 minutes and ended the week ~$2.40 (10%) above last week’s lows.

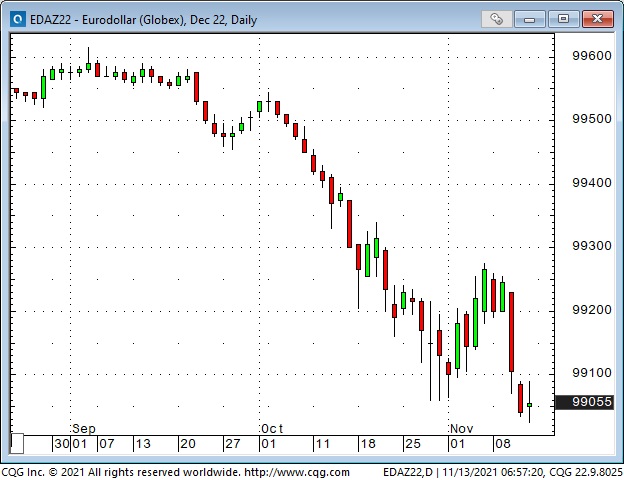
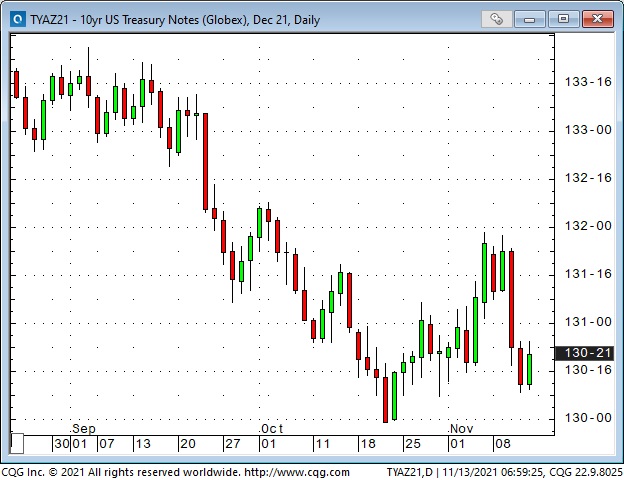
Short-term US interest rates spiked on the news. The Eurodollar futures contract trades at a discount to par, so falling prices on this chart indicate rising interest rates.
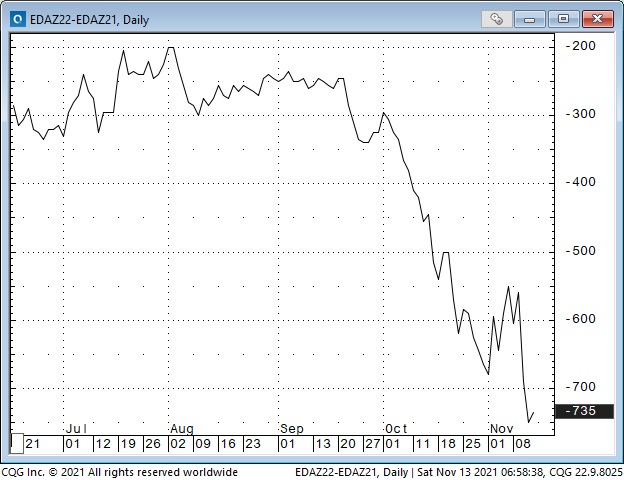
This next chart shows the spread between the Dec 2021 and the Dec 2022 Eurodollar contract. As recently as early October, the Dec 2022 contract was only a 30 point discount to Dec 2021 (implying that short rates come Dec 22 would only be 30 bps higher than Dec 21), but the spread has “gone out” to ~ 70 points in the last six weeks as s/t interest rates have been rising sharply on expectations that persistent and rising inflation would “inspire” the Fed to raise rates next year (at least 2 x 0.25%.)
Bond yields jumped (prices fell) on the CPI number – but the pressure was greater on the short end of the yield curve.
The US Dollar soared against (essentially) all other currencies on the CPI report, with the benchmark US Dollar Index ending the week at a 16-month high. The USDX has rallied nearly 7% from the January 6, 2021 nadir (a 32-month low), which I have previously described as a cathartic inflection point (the day the mob stormed the Capitol Building in Washington, DC.)
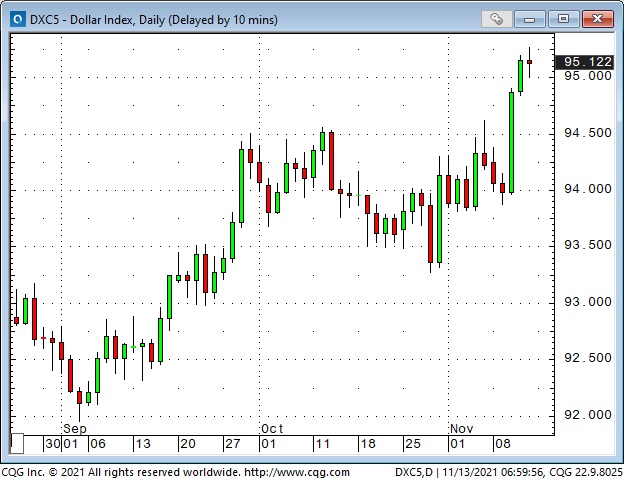
It is unusual to see gold and the USD both rising at the same time. (A geopolitical scare may cause this to happen as capital seeks safety in both gold and the USD.) Perhaps gold traders were thinking of, “inflation hedge,” while FX traders assumed that the CPI report would push the Fed to be much more hawkish than other central banks. Or, perhaps, the drop in real yields to historic lows inspired gold traders to bid aggressively for gold, regardless of the strong Dollar.
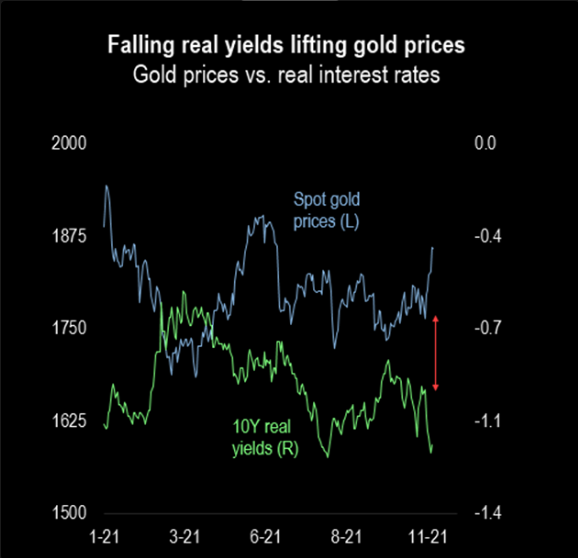
This chart shows the relationship of gold (black bars) and real yields (yellow = 5-year tenor, blue = 10-year tenor.) In late 2018 real yields for both tenors were positive ~1.15%, but now 5-years are negative ~1.83%. It is a “busy” chart, but it illustrates that falling real yields are generally positive for gold.
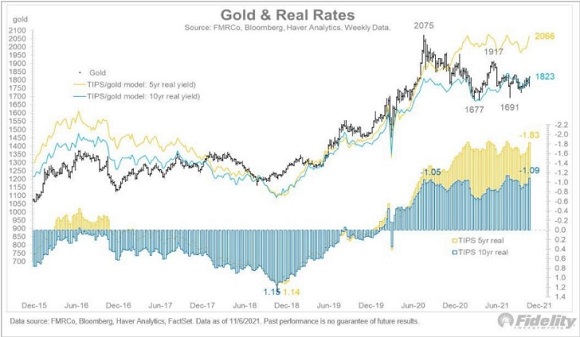
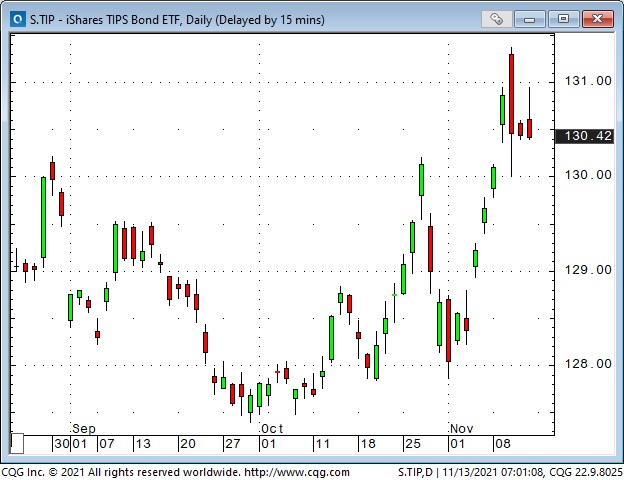
Prices on the TIPS (Treasury Inflation-Protected Security) chart rally as real interest rates fall. This chart shows that real rates have fallen sharply in November (as inflation metrics rose.) The CPI report created the spike at the top of the chart as real rates dropped to record (negative) lows.
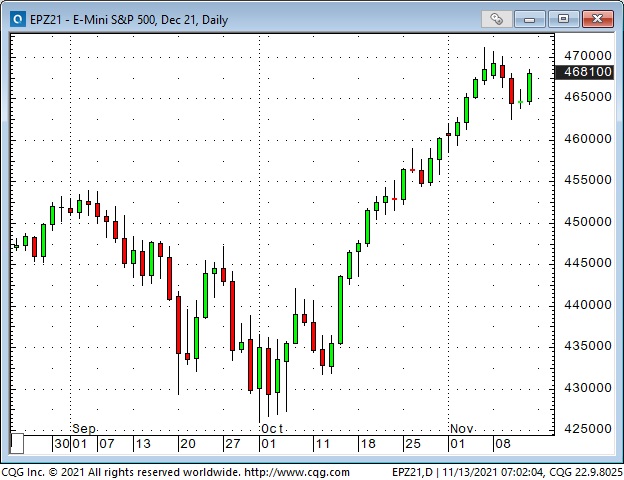
The S+P, DJIA and NAZ dropped to a one-week low late Wednesday, but they had little immediate reaction to the CPI report.
Inflation – transitory – or not?
As recently as last week’s Fed meeting, Chairman Powell maintained that inflationary pressures were a little stronger and lasted a little longer than the Fed had expected – but their baseline view was that the inflationary surge would prove to be transitory. Given that, the Fed was not anticipating higher interest rates during the next 12 months.
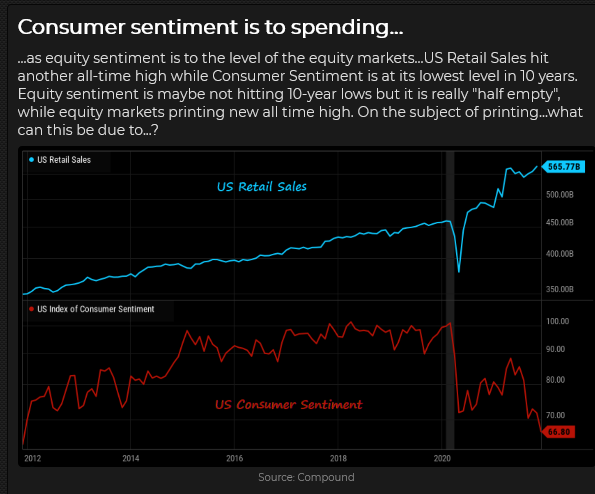
Many analysts are expecting the Fed to raise rates in 2022. The futures market is pricing in at least two interest rate increases (25 bps) next year. On Friday, the University of Michigan reported that “Consumer sentiment fell in early November to its lowest level in a decade due to an escalating inflation rate and the growing belief among consumers that no effective policies have yet been developed to reduce the damage from surging inflation.”
President Biden has declared that “Reversing this trend is a top priority for me.” Leading Republicans are blaming Biden’s economic policies for the surge in inflation – too much government stimulus.
Will there be a “fall guy,” and will it be Jay Powell? Powell’s term as Fed Chair ends in February. Biden has indicated that he will decide whether to re-appoint Powell before Thanksgiving (November 25.) If Powell is replaced, the new Chair will probably be either more dovish and/or tougher regarding regulations. What will that do to the markets you trade?
There is a school of thought that the Dems will try to “re-shape” the Federal Reserve during Biden’s term (like the Republicans “re-shaped” the Supreme Court during Trump’s term) to make it more “in-line” with the progressive agenda. Throwing Powell under the bus might give Biden some negotiating points with the progressive wing of the Democratic party – those folks haven’t been winning much lately.
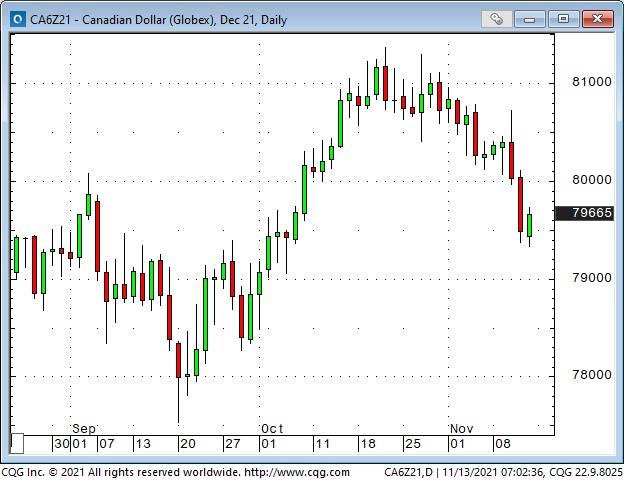
The Canadian Dollar rallied ~4 cents from the Sept lows (7750) to the October highs (8150), as stock and commodity markets were strong. The CAD rallied following the more-hawkish-than-expected Bank of Canada meeting on Oct 27 but has dropped ~ 2 cents since then as commodities (especially crude oil) have weakened and as the USD has rallied against nearly all currencies.
WTI crude oil traded between $80 and $85 this week. The market has traded broadly sideways between $78 and $85 for the last four weeks – after rallying from ~$62 in August (a 37% rally.)
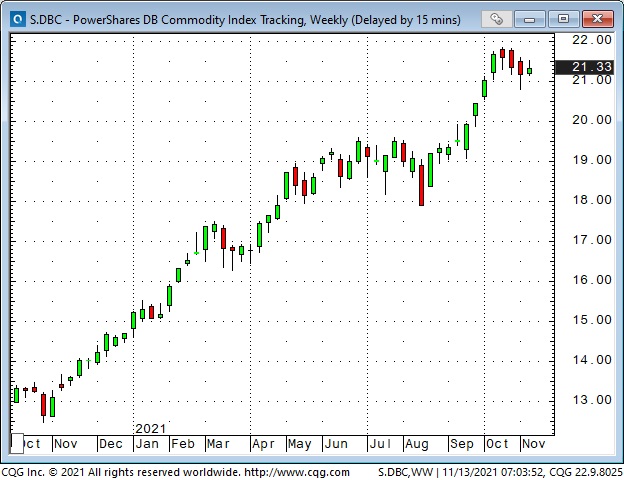
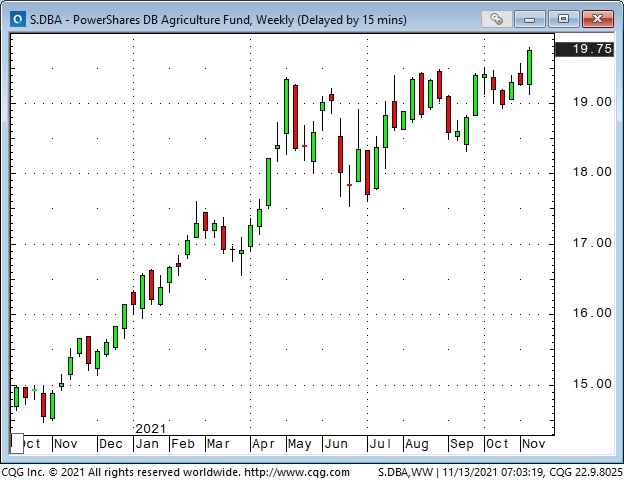
The broad commodity indices (with a heavy crude oil weighting) have rallied ~100% from the Covid Crisis lows to a 7-year high, but they have been sideways-to-lower the past few weeks. The Agricultural weighted indices have rallied ~50% from last year’s lows to a 4-year high and have been breaking out to new highs the past few weeks. Higher food prices ahead?
My short term trading
I started this week with two positions I established last Friday: long the Yen and short the S+P. Both trades went nicely in my favour early this week (showing decent profits), and I moved my stops to reduce P+L risk. I was stopped on the Yen for a tiny loss on Wednesday when the USD soared following the CPI report. I was stopped on the S+P for a small gain on Friday as stock indices rallied back from Wednesday’s lows.
It is frustrating to see decent (unrealized) profits turn into small losses or only modest gains. (There is always that “little voice” that asks, “Why didn’t you exit the trade with a good profit when you had the chance?”)
My answer to that question, for both the Yen and the S+P, is that my time frame, when I established the trades, was for a potentially bigger move – that even though the positions were showing a nice profit, I had to “stay with the trade,” rather than taking a quick profit. I had to give the trade a chance to develop into a much bigger gain. (See Quotes from the Notebook below.)
I have no open positions at the end of the week. My P+L for the week was essentially flat.
On my radar
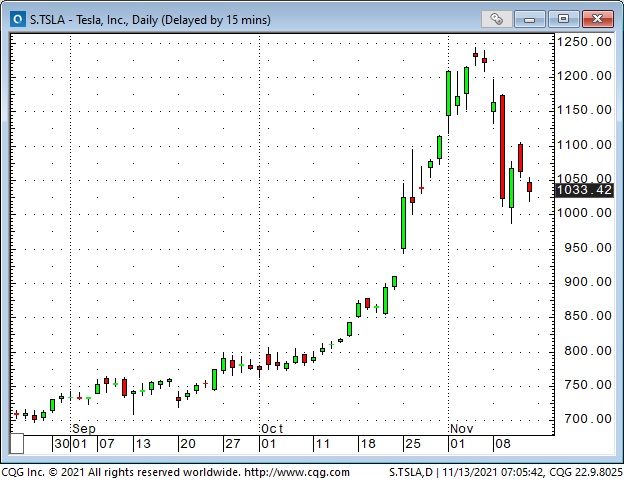
For the past couple of weeks, I’ve been looking for opportunities to fade “irrational exuberance,” especially in the equity markets. I thought the breakdown in Tesla this week might trigger a breakdown in the broader indices after its spectacular run higher the past few weeks. At Wednesday’s close, I thought there was a good chance prices could develop downside momentum. But – that didn’t happen this week.
From a longer-term perspective, if the major indices fall below their late September / early October lows, downside momentum may develop.
I will continue to look for opportunities to short equities, but I’m disappointed that my “obsession” with “irrational exuberance” has kept me from looking at opportunities in other markets. For instance, I’ve generally been bullish on the USD, but I haven’t “put on the trade.”
Thoughts on trading
Last week I wrote about why I read so much research, listen to podcasts and watch videos. I’m not looking for specific “buy this – sell that” recommendations – I’m looking to get an idea; to see a market from a different point of view, that will cause me to think, “If that’s the case, then the trade to make will be X.”
For example, I remember hearing Martin Armstrong say (probably in 1984) that the DJIA was making new All-Time highs – in US Dollar terms, but not in Swiss franc terms. It had never occurred to me to think of the DJIA in terms of Swiss francs – but I realized that people who thought about investing from an international perspective definitely did – and if the DJIA were making new All-Time highs in all currencies, that would probably “draw” more money (from around the world) to the DJIA – and drive it even higher.
This happened “in spades” in the late 1990s during the “dot-com” boom. The US stock market was soaring, and capital flowed to the USA to participate in the boom. This accelerated the boom and drove the USD higher – a classic virtuous circle.
I have not wanted to make “buy this – sell that” recommendations on this blog because I believe that deciding to enter a trade is only a tiny part of successful trading – that what you do with a trade, once you have it on, is much more important. For instance, if I recommended that my readers buy X, with a stop at point Y and a profit target at point Z, that might be exactly how I see the market then. But as time passes, and new information arrives, and prices change, I will probably change my mind about what to do with the trade.
I have hoped that readers will get some ideas from this blog to help them with their own trading. They might get an idea for a specific trade or for a way to manage risks, or they might see an opportunity in a market they have never traded before.
Quotes from the Notebook
“It never was my thinking that made big money for me. It always was my sitting. Got that? My sitting tight! It is no trick at all to be right on the market. You always find lots of early bulls in bull markets and early bears in bear markets. I’ve known many men who were right at exactly the right time and began buying or selling stocks when prices were at the very level which should show the greatest profit. And their experience invariably matched mine–that is, they made no real money out of it. Men who can both be right and sit tight are uncommon.”
Edwin Lefevre – Reminiscences of a Stock Operator -1923
My comment: This is a classic. Edwin wrote Reminiscences as a Roman a clef about Jesse Livermore – the Boy Wonder from the bucket shops who made and lost fabulous fortunes several times. If you want to manage your own money as a trader/investor (as opposed to turning it over to someone else to manage for you), then I think you absolutely must read this book. It’s 100 years old, but the wisdom is timeless.
It seems to me that there are two ways to make more money trading: either trade bigger size or position for bigger moves. I’ve always been pretty good at taking losses quickly, but I’ve not been good at “sitting” with a winning trade. I’m going to try to get better at that.
A small request
If you like reading the Trading Desk Notes, please do me a favour and forward a copy or a link to a friend. Also, I truly welcome your comments. Would you please let me know if there is something you’d like to see included in the TD Notes? Thanks, Victor
Barney keeps growing – 15 pounds this week

Victor Adair retired from the Canadian brokerage business in 2020 after 44 years and is no longer licensed to provide investment advice. Therefore, this blog, and everything else on this website, is not intended to be investment advice for anyone about anything.
Each week Josef Schachter gives you his insights into global events, price forecasts and the fundamentals of the energy sector. Josef offers a twice monthly Black Gold newsletter covering the general energy market and 30 energy, energy service and pipeline & infrastructure companies with regular updates. We also hold quarterly webinars and provide Action BUY and SELL Alerts for paid subscribers. Learn more.
EIA Weekly Data: The EIA data of Wednesday November 10th was mostly bearish. Commercial Crude Stocks rose by 1.0MB while Refinery Utilization Rose by 1.4 points to 80.1% from 78.5% in the prior week. Last week Total Motor Gasoline inventories fell 1.6Mb while Distillate volumes fell 2.6Mb. US Crude Production was maintained at the pandemic high of 11.5Mb/d. Total Demand fell by 708Kb/d to 19.29Mb/d. With Commercial Crude Stocks now at 435.1Mb in inventory, coverage is 22.6 days of Total demand, down from 24.2 days last year but up from 20.9 days in 2019 and 19.7 days of coverage in 2018. So there is no shortage of crude in the US market.
In detail:
- Demand for all products fell modestly last week. Total Product Demand fell 708Kb/d to 19.290Mb/d (demand was 20.18Mb/d at the same time in 2020, 21.5Mb/d in 2019 and 22.39Mb/d in 2018). Other Oils demand fell by 679Kb/d to 2.71Mb/d. Gasoline consumption fell 245Kb/d to 9.26Mb/d (and is below the 9.32Mb/d consumed in 2019 at this time). Jet Fuel Consumption fell 91Kb/d to 1.59Mb/d (versus 1.75Mb/d consumed in 2019 at this time). Cushing Inventories were flat versus the prior week at 26.4 Mb/d. Gulf Coast volumes are at 247.3Mb and are up 17.1Mb from 230.2Mb in pre-pandemic 2019 . In discussions with infrastructure companies, crude storage is being focused on the Gulf Coast so as to move the light oil volumes offshore (biggest market Asia) from the nearby prolific Permian and Eagle Ford basins. Over time Cushing should see growing storage as Canadian heavy crudes are moved down to this storage hub.
Baker Hughes Rig Data: The data for the week ending November 5th showed the US rig count rose by six rigs (up by two rigs in the prior week). Of the total of 550 rigs working last week, 450 were drilling for oil and the rest were focused on natural gas activity. This overall US rig count is up 83% from 300 rigs working a year ago. The US oil rig count is up 99% from 226 rigs last year at this time. The natural gas rig count is up a more modest 41% from last year’s 71 rigs, now at 100 rigs.
Canada had a decline of six rigs (a rise of two rigs in the prior week) to 160 rigs. Canadian activity is now up 86% from 86 rigs last year. There were three less oil rigs working last week and the count is now 95 oil rigs working, up from 37 last year. There are 65 rigs working on natural gas projects now, up from 49 last year.
The material increase in rig activity over a year ago in both the US and Canada should continue to translate into rising liquids and gas production over the coming months, especially with the DUC count (drilled but uncompleted well count) at very low levels. The data from many companies on their plans for Q4/21 and forecasts for 2022 support this rising production profile expectation. We expect to see US crude oil production reach 12.0Mb/d before the end of 2021. Companies are taking advantage of attractive drilling and completion costs and want to lock up experienced rigs and crews as staffing issues are getting tougher for the sector.
Conclusion:
We expect to see additional weekly builds in Commercial Crude Stocks over the next few weeks before winter fuel demand in December picks up.
Bearish pressure on crude prices:
- Covid caseloads are growing around the world. In the US, the death rate is over 756K deaths (up 9,000 during the last week). Worldwide, the death count is now 5.06M. Deaths are rising in Europe particularly in Austria (may impose lockdowns on the unvaccinated), Bulgaria, Croatia, Germany, Romania, Russia, Slovakia, Slovenia, and Ukraine.
- Many US corporate and government employees are not planning on getting vaccinated and are now being put on unpaid leave and may soon lose their jobs. Eighty million individuals have a shotgun decision by January 4th (delayed by one month to cover off Christmas deliveries) when the cut-off kicks in. NO JAB, NO JOB is the vaccination mantra. The US military, police and firefighters are being significantly affected as many personnel are not planning on getting the vaccine in the required timeline and are planning court battles.
- Energy demand is under pressure as high prices for most food, rent, taxes, child care, health expenses, auto costs and other daily necessities make spending decisions tougher for consumers. This gouge in prices will surely impact consumers’ buying behaviour in the coming months. The spending pie of consumers is shrinking and some spending habits of the past will have to be dropped. Demand destruction is on the way. Consumer Confidence is weakening and is nearing levels that have forewarned of recessions. Consumer spending rose at a low annual rate of 1.6% down from 12% in Q2/21. Real US GDP grew 6.7% in Q2/21 and was seen at only 2% in Q3/21. Recent economic releases indicate that we may already be in the early stages of a recession. Today the US CPI came out at the highest level in 30 years at up 6.2%. Wholesale prices (PPI) rose even faster and are up 8.6% from October of last year. The US$1.2T infrastructure bill when signed into law by President Biden will only add to US inflationary pressures.
- China has seen a rising wave of new infections in 19 of its 31 provinces. Many industrial plants in China have been closed due to the high cost of fuel and the Government’s plan to lower emissions in the Beijing area for the upcoming 2022 winter Olympics from February 4th to the 20th. Clean air is needed for the event and China wants to show it is making progress on its climate initiatives. This will dampen China’s consumption of fossil fuels over the next four to six months. Thermal coal prices have fallen 55% in the last few weeks. Chinese PMI has fallen below 50 for the second month in a row. China’s General Administration of Customs reported yesterday that imports of crude oil in October were down by 1.5Mb/d from 10.5Mb/d to 9.0Mb/d as the smog issue was being focused on.
- Iran is returning to the negotiating table on November 29th and if progress is made, then at some point in the future they may get sanction relief and be able to add 1-2Mb/d fairly quickly.
- Iraq wants to boost its productive capacity materially and is working on deals with Saudi Arabia worth tens of billions of dollars to increase oil production, natural gas fields for electricity, and build water desalination and solar energy stations in the country. If concluded this could be a big game changer for the country which is trying to get out of Iran’s orbit and move back to their traditional allies.
Bullish pressure on crude prices:
- Speculative long investors (options traders, hedge and commodity funds) and a short squeeze on bearish positions in the futures and options markets on crude have spiked up prices. Energy bulls like Bank of America see US$120/b by June 2022.
- President Biden’s moral suasion move to get OPEC+ to add more oil (ask of 600-800Kb/d monthly increases) fell on deaf ears. They plan to keep to their 400Kb/d monthly increase instead.
- Spot natural gas prices in Europe have backed off after President Putin confirmed that Russia would meet all European winter needs once they open the Nord Stream 2 Pipeline, which is now being filled and undergoing pressure tests before certification. Russian pressure seems to have worked on getting Europe to move quickly to certify the new line. This new pipeline doubles Russia’s annual export capacity to Europe. In the US, NYMEX today is now at US$4.86/mcf – and in Canada AECO is C$4.78/mcf as weather is mild and storage levels have been building. US storage injections for the last five weeks have been above the five year average and over 2020 injection levels.
CONCLUSION:
WTI is down US$2.51/b today to US$81.64/b as the Commercial Crude Oil Stocks built and demand data was weaker than expected. We see prices as having US$20-25/b of speculative value which should disappear as Commercial Crude Stocks continue their seasonal build and demand weakens as the US and China head into recessions. We seem to be moving from stagflation to recession in 2022 around the world. If the data comes out supporting recession conditions, the oil price slide could be quick and painful. Leveraged speculative longs in crude oil futures are vulnerable to nasty margin calls in the future.
Energy Stock Market: The S&P/TSX Energy Index currently trades at 165. The S&P Energy Bullish Percent Index backed off from the 100% SELL level to 85.7% now. Energy stocks could fall 30-40% in the coming months with leveraged entities the hardest hit.
Our November Schachter Energy Report Monthly comes out tomorrow Thursday November 25th with details on the general stock market and its expected impact on the energy sector as well as reviews and updates on over 20 companies that have released their Q3/21 report since our Interim Report.
We are holding our 90 minute Q4/21 quarterly Black Gold Webinar tonight Wednesday November 10th at 7PM MT. We will discuss in detail our view on the general stock market, the energy market and our bearishness on both areas for the near term. We will also go over those companies that have reported their Q3/21 results so far. They are broken up into presentations on those that reported good results (11 companies) and those with not so good reports (nine companies). We will have two Q&A sessions to go over our presentation materials and subscriber questions.
If you want access to all our SER reports or want to join our webinar then you will need to become a subscriber. Go to https://bit.ly/34iKcRt to subscribe.
If you enjoy reading our weekly ‘Eye on Energy’ feel free to forward it off to friends and colleagues. We always welcome new subscribers to our complimentary macro energy newsletter.
-
I know Mike is a very solid investor and respect his opinions very much. So if he says pay attention to this or that - I will.
~ Dale G.
-
I've started managing my own investments so view Michael's site as a one-stop shop from which to get information and perspectives.
~ Dave E.
-
Michael offers easy reading, honest, common sense information that anyone can use in a practical manner.
~ der_al.
-
A sane voice in a scrambled investment world.
~ Ed R.
Inside Edge Pro Contributors

Greg Weldon

Josef Schachter

Tyler Bollhorn

Ryan Irvine

Paul Beattie

Martin Straith

Patrick Ceresna

Mark Leibovit

James Thorne

Victor Adair