
Op/Ed
Stocks soar to New All-Time Highs
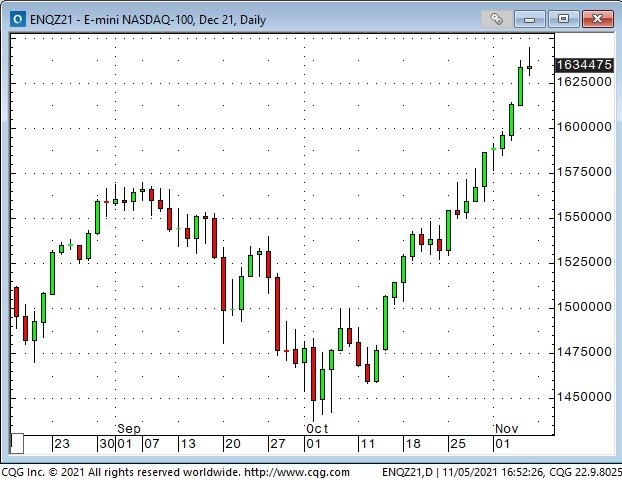
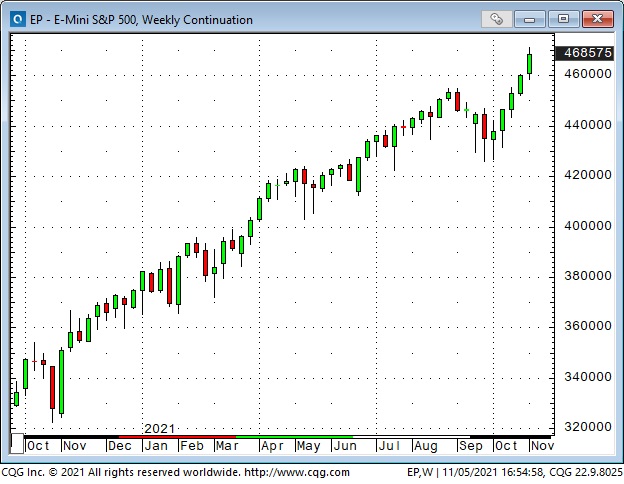
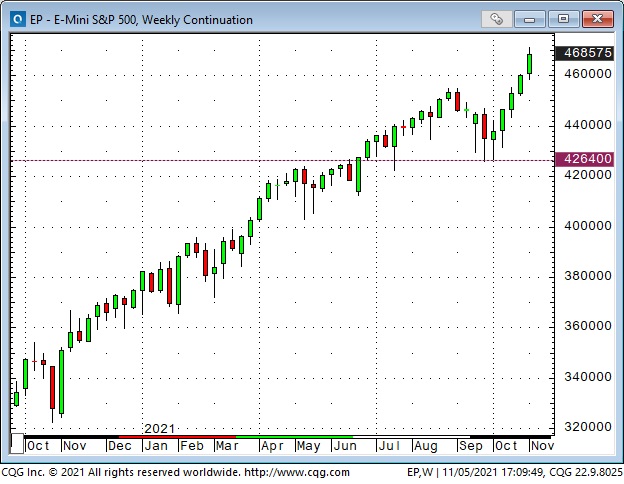
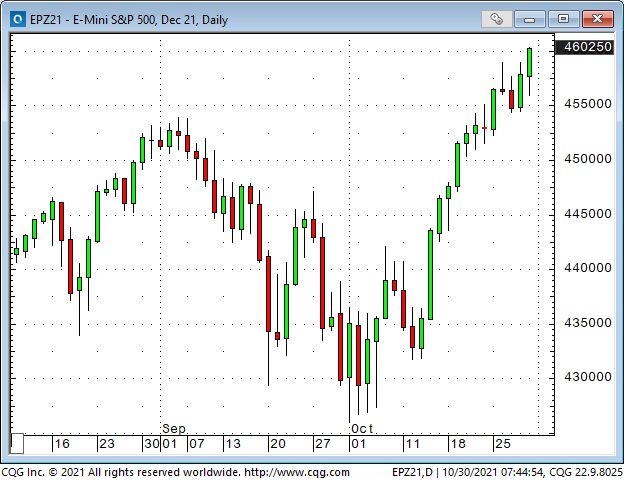
The worries that caused the major stock indices to slump ~6% in September have been forgotten – bullish sentiment has returned BIG TIME, and the indices have surged to All-Time Highs with the DJIA and the S+P rising for the past five consecutive weeks. Since early October, the DJIA is up ~8%, the S+P ~10%, the Russell ~12% and the Naz100 ~14%.
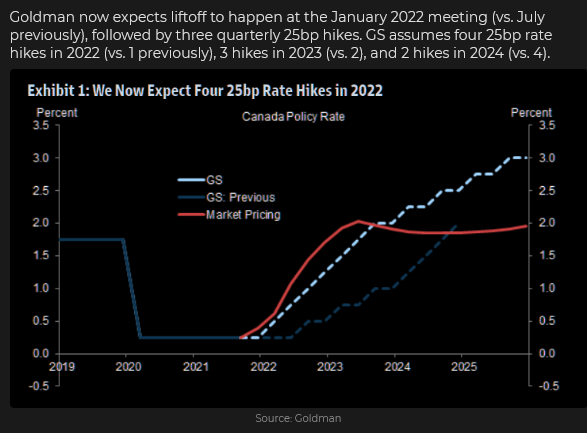
Global Central Banks (Ex. European) starting to tighten
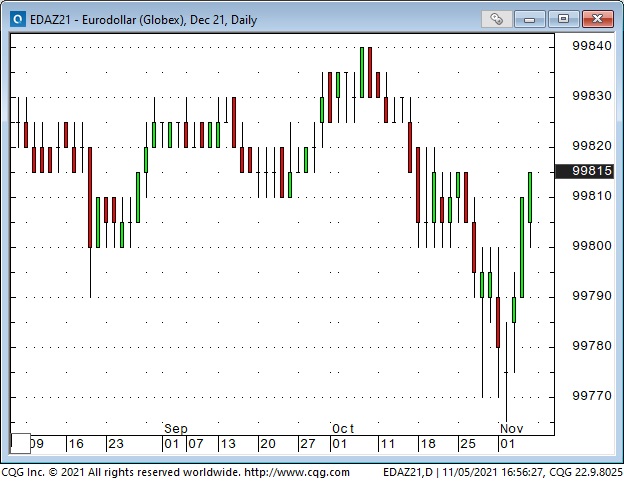
Short-term interest rates are firming, but bond yields are falling – which results in real (after inflation) long rates becoming more deeply negative while the yield curve flattens.
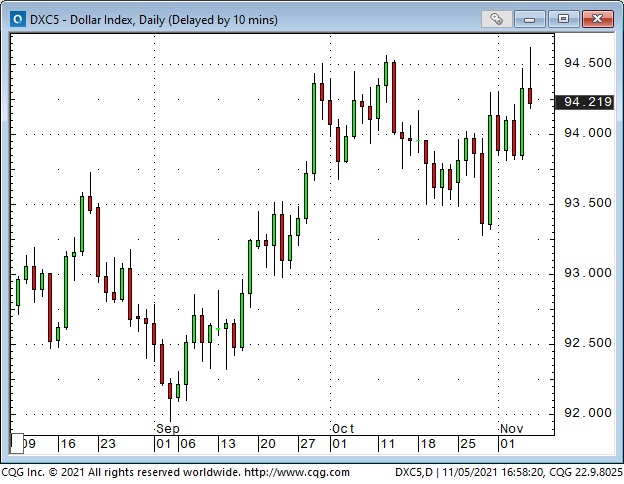
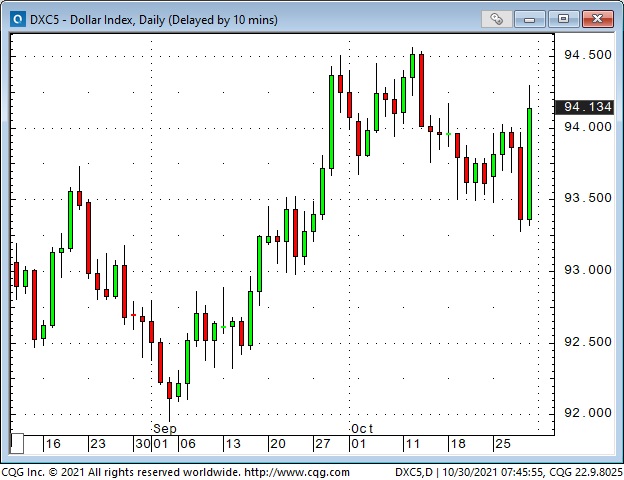
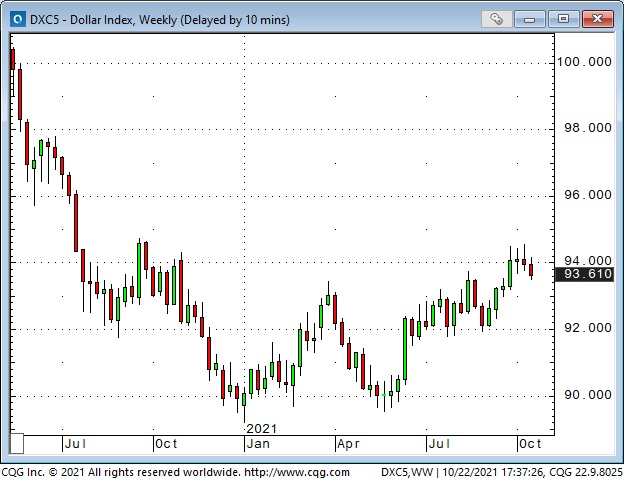
The US Dollar Index touches a 14-month high
Inter-day price action on the USDX has been choppy the past three weeks (up one day, down the next), but it rallied to a 14-month high Friday following the stronger-than-expected US employment report – but couldn’t sustain the gains. The USDX has rallied ~6% after touching a 3-year low in January.
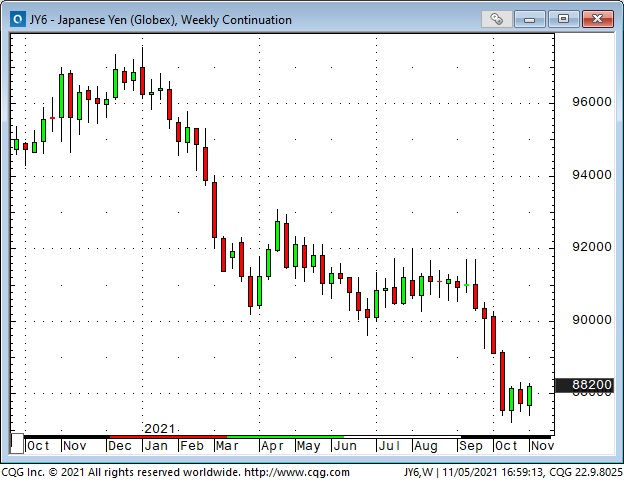
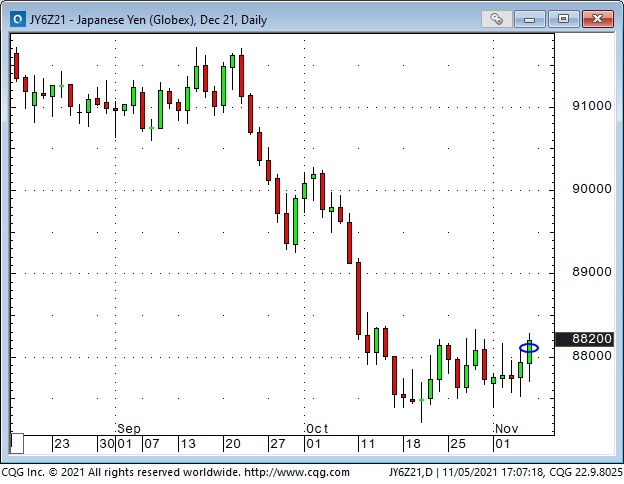
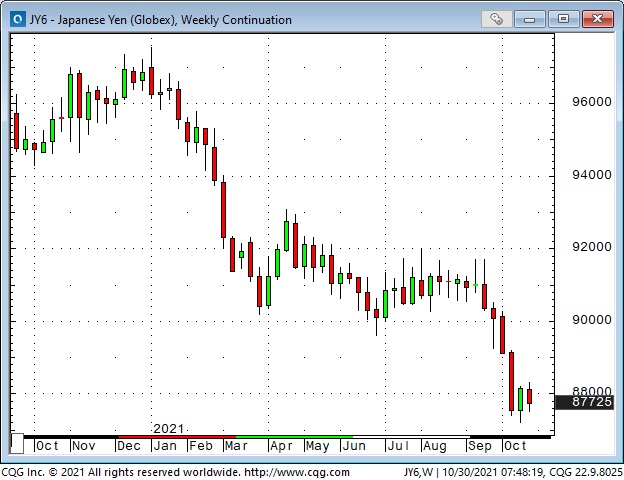
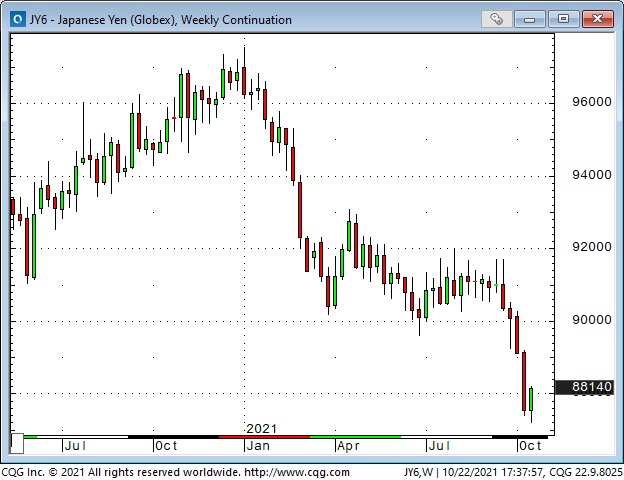
This year, the Yen has been the weakest primary currency against the USD, down ~10% since early January.
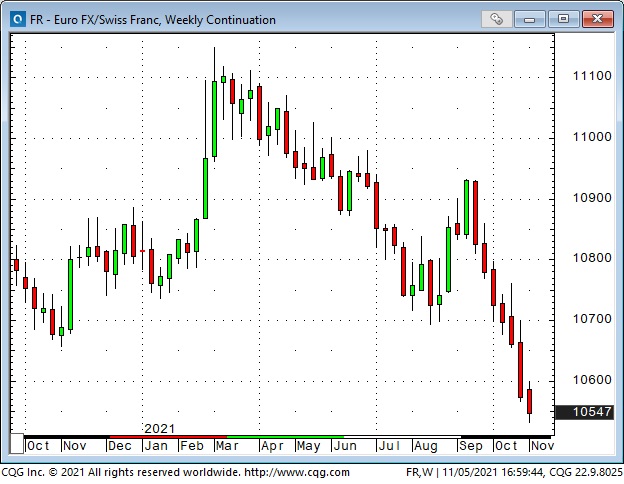
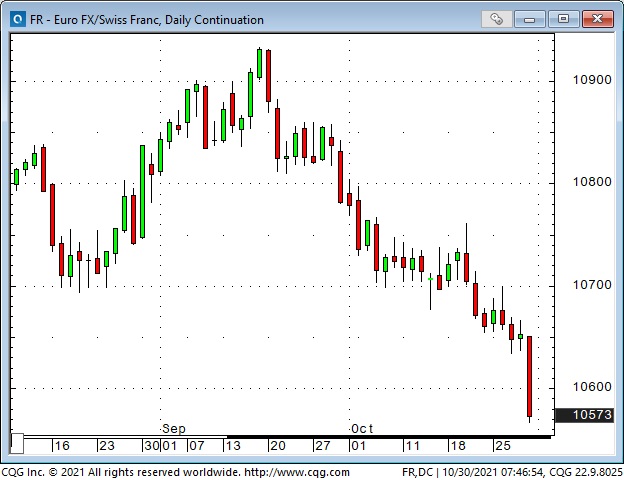
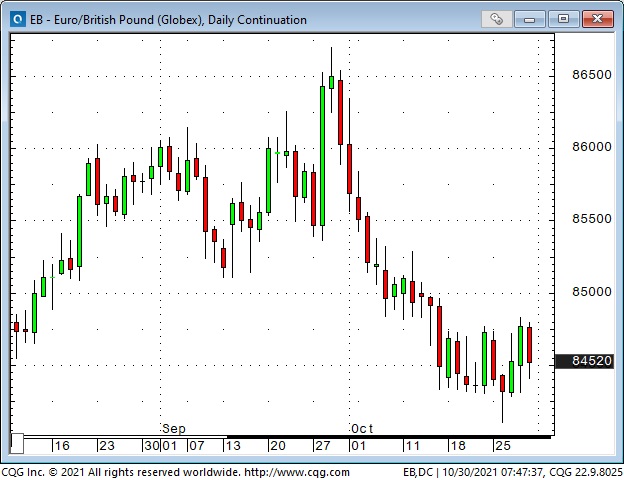
The Euro has fallen ~5.5% against the Swiss Franc over the past eight months and is near a 6-year low. Weakness in the Euro/Swiss spread is often a sign of bearish Eurozone political sentiment.
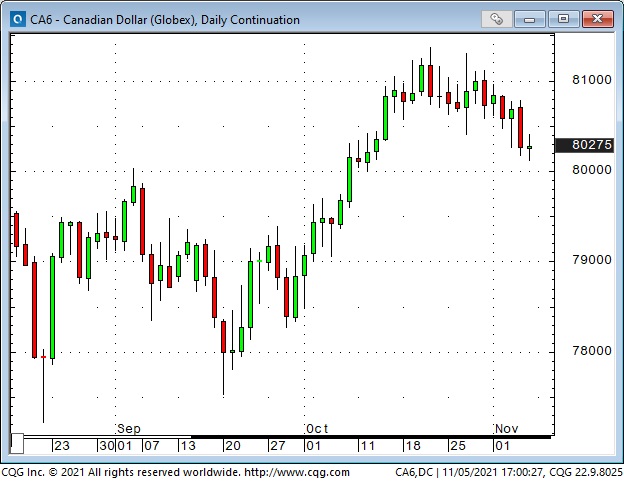
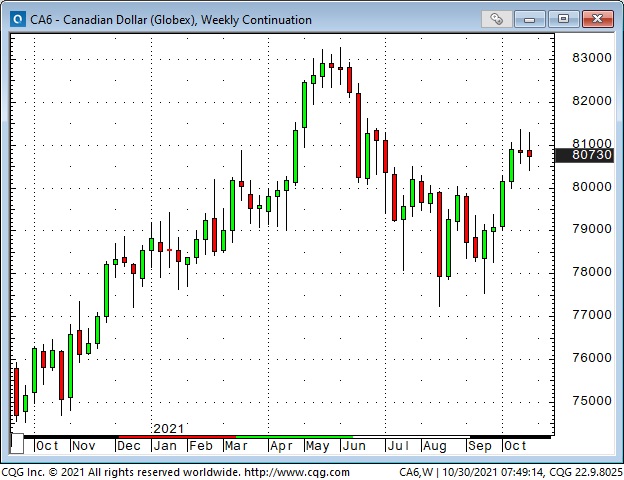
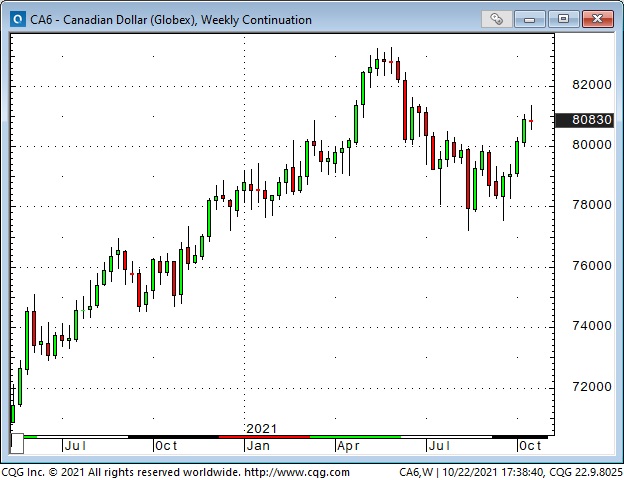
Thanks to a vibrant commodity (especially crude oil) market, the Canadian Dollar is one of the few actively traded world currencies that has risen Vs. the USD this year. The CAD popped higher last week when the BoC was a little more-hawkish-than-expected but drifted lower recently as commodities have weakened and the USD has been strong.
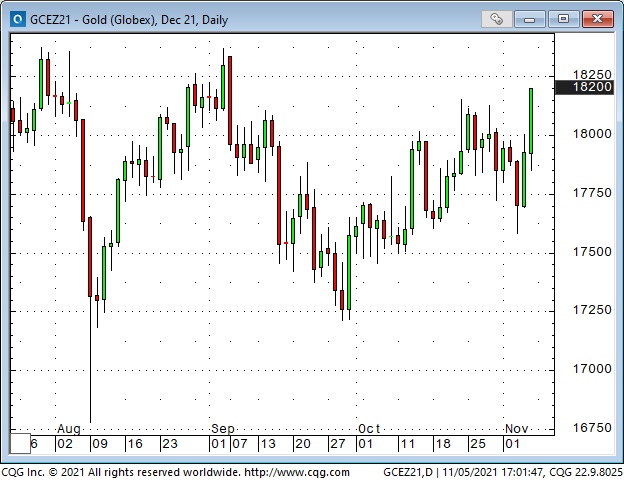
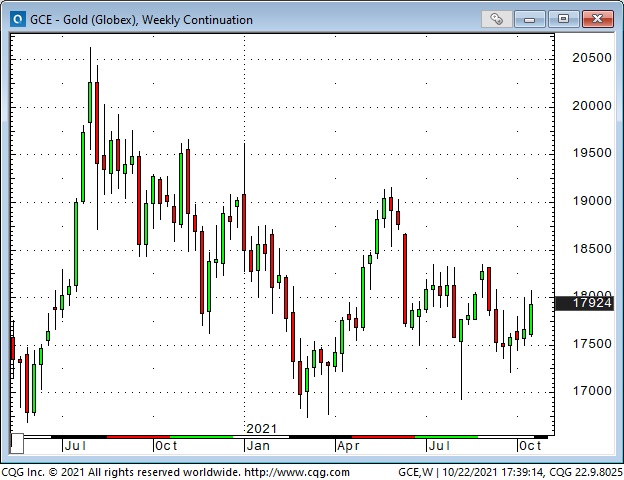
Gold bounced $60 from mid-week lows to a 2-month high
Gold has been out of favour (relative to stocks and crypto) since it had that spectacular $800 rally to new All-Time Highs from 2018 to July 2020.
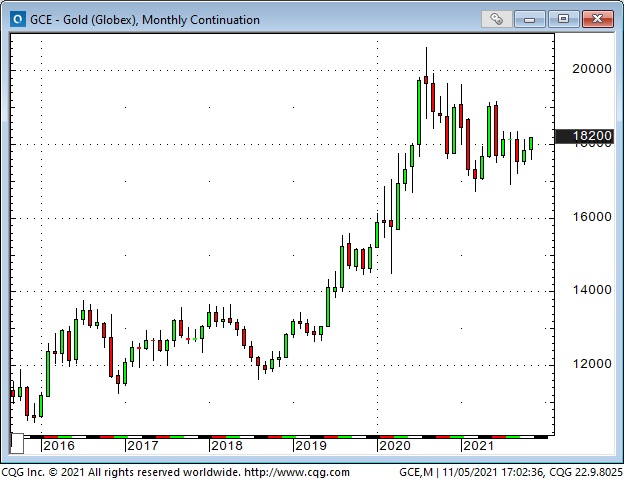
I’ve frequently discussed how gold ETF capital flows are an excellent barometer of gold market sentiment. In 2019 and 2020, the global gold ETF market “took” ~1,100 tonnes of gold, but the market turned sellers late in 2020, and so far this year, the ETF market has “sold” ~280 tonnes.
A breakout above $1840 could bring new attention to the gold market – especially if some currently popular markets fall out of favour.
I’ve traded gold for nearly 50 years and highly recommend the Gold Monitor, written by my good friend Dr. Martin Murenbeeld, as an excellent source of fundamental analysis. I’ve read his letter every week for thirty years.
I’d also recommend Crescat Capital for readers interested in gold – they have some nifty charts in their slide presentation decks.
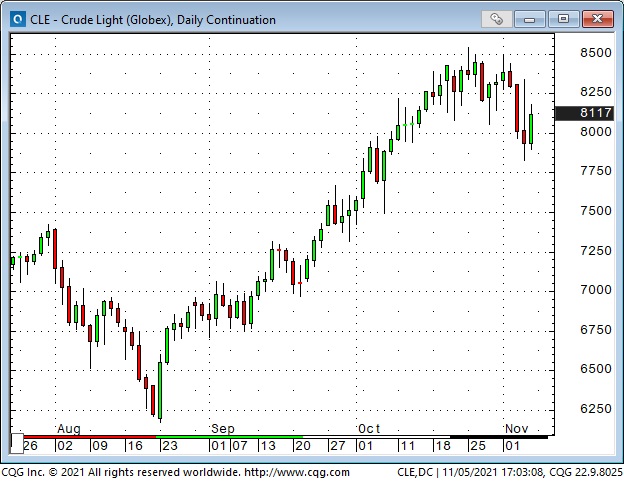
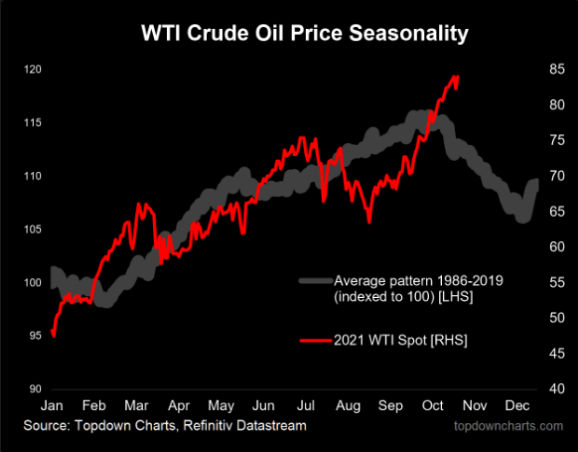
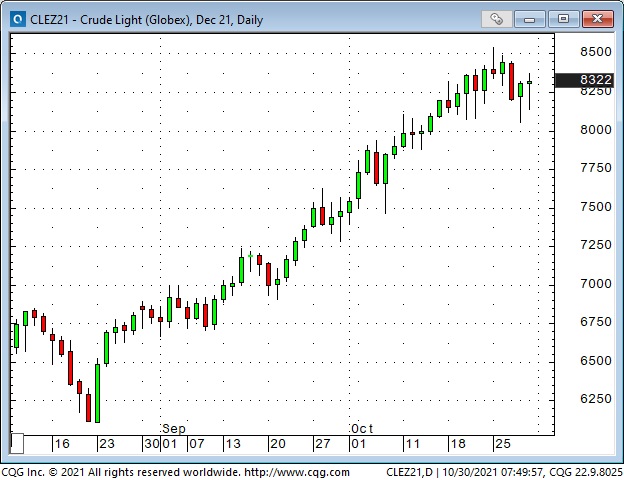
WTI crude oil touched a 7-year high last week – but fell 8% to this week’s lows
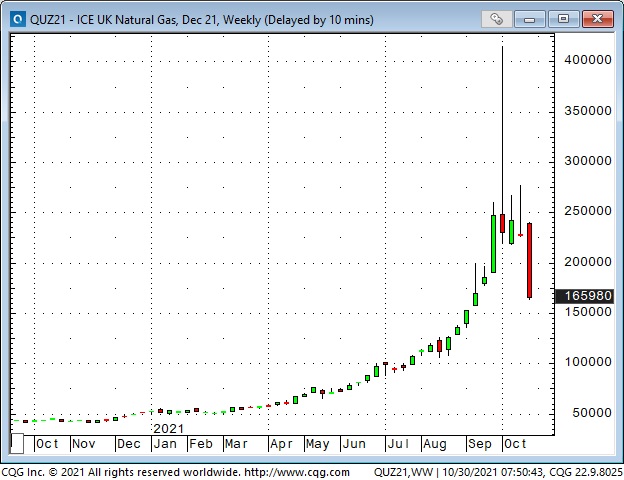
WTI crude oil surged >35% from mid-August to October on perceptions of short-term (and longer-term) supply/demand deficits. (The spike in European NatGas to All-Time Highs may have been the “poster-child” for such concerns.)
My short term trading
In keeping with the “on my radar” section of last week’s Notes, I started this week flat but looking for opportunities to sell “irrational exuberance” in stocks and commodities.
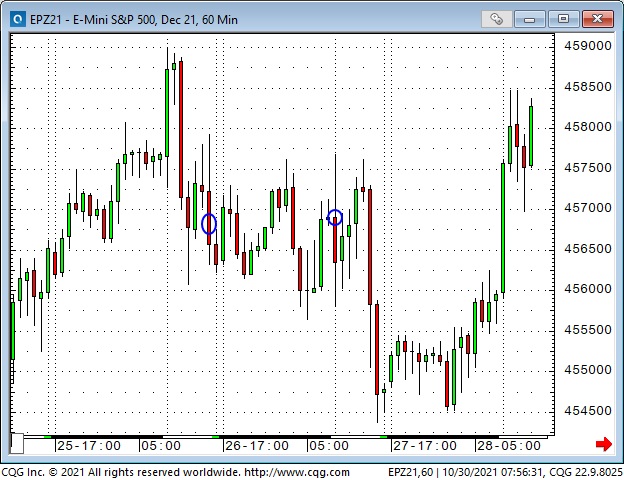
The S+P closed last week at ATH and gapped higher in the Sunday (October 31) overnight session. Those overnight levels didn’t hold when the Monday “floor session” started, so I shorted the S+P with a tight stop. The trade held up throughout the Monday day and overnight sessions, but I was stopped for a tiny loss as the Tuesday “floor” session began.
Our new 2-month old puppy arrived Tuesday night and single-handedly sidelined me for the next couple of days (no sleep!)
I missed getting short crude oil (blame the puppy), but the wild price swings would probably have stopped me out with a loss (thank God for the puppy!)
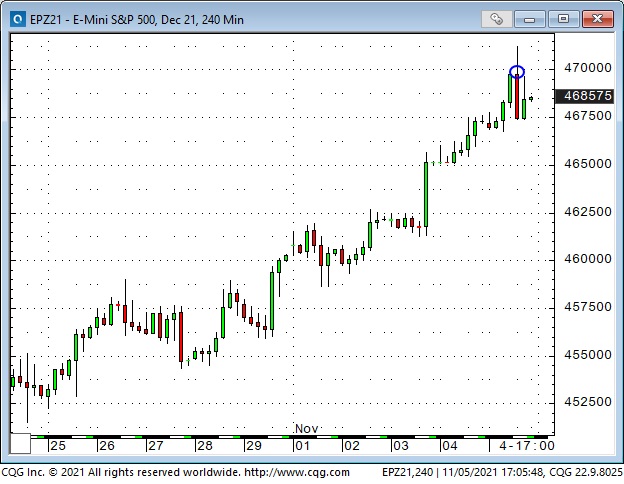
I re-shorted the S+P on Friday about a dozen ticks below ATH after it lurched higher following the employment report but then rolled over and dropped through the “floor session” opening range. I remain short, with a stop just below ATH.
I bought the Yen on Friday in anticipation of it breaking out of the sideways range it has been in for the past three weeks. As noted above, the Yen has been weak against the USD all year, and as a result, speculators in the currency futures market have built a massive net short position in the Yen – they might turn buyers if the Yen was to rally. (If “something” happened and market psychology was to turn risk-off, the Yen would probably catch a “haven” bid.)
My realized P+L was down tiny for the week. My unrealized P+L is up 0.25%.
On my radar
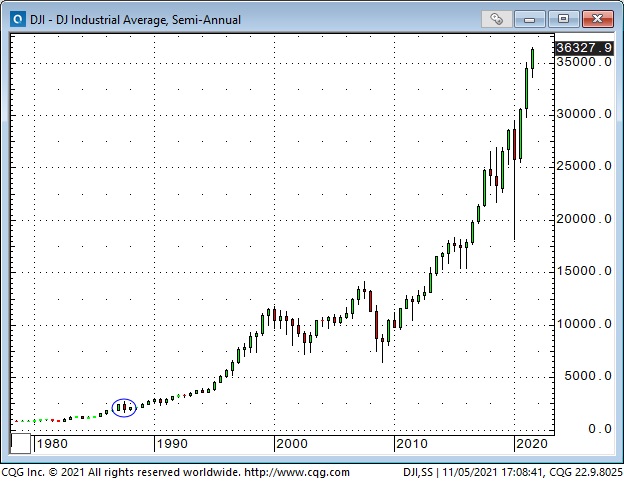
I’ve lived through many wild market swings since I began trading fifty years ago. I remember being a speaker at a significant financial conference in Toronto when the Dow Jones tumbled ~25% on October 19, 1987. There were ~1,000 financial professionals at that conference, and everybody was in shock. I cancelled a trip to Chicago and flew straight home, worried that the world as I knew it would never be the same again.
These days, that crash in 1987 barely registers as a blip on the long-term chart.
I mostly write about my short-term trading (I think of it as my “day job“), but I also pay attention to long-term trends. (See the Quotes From The Notebook section below.) from that perspective, I’m worried about the bizarre valuations we see in many markets, particularly equities.
I know ultra-low interest rates “justify” high equity prices. I know Central Banks have flooded the world with liquidity, and share prices must rise as the purchasing power of currencies is degraded. I know “There Is No Alternative.”
I know my Old School metrics are useless for understanding today’s “valuations” and “rate of change.” Please forgive me, I’m not trying to lecture anybody, but I’m saying that we’ve seen this movie before. I remember people buying penny mining stocks on the Vancouver stock exchange fifty years ago because somebody told them that XYZ was going up. The companies had no tangible assets and were flying on a wing and a prayer, but, as my long-time friend Bob Hoye loves to say, “People will believe the most preposterous stories – as long as the price keeps going up.”
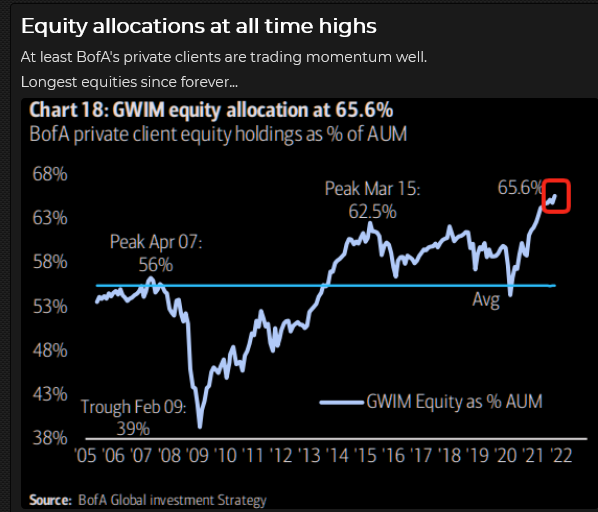
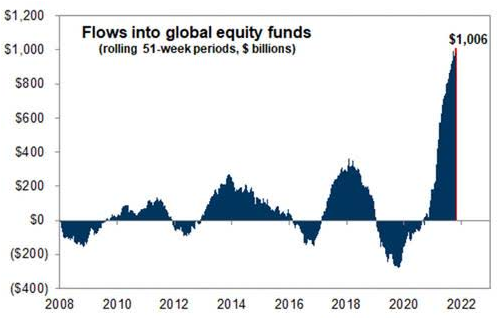
I’m not saying that the stock market will crash tomorrow – I honestly would not be surprised to see it go higher – but I think it has been going up because people believe (and have been told) that it will keep going up. Those people are putting money into the stock market like never before.
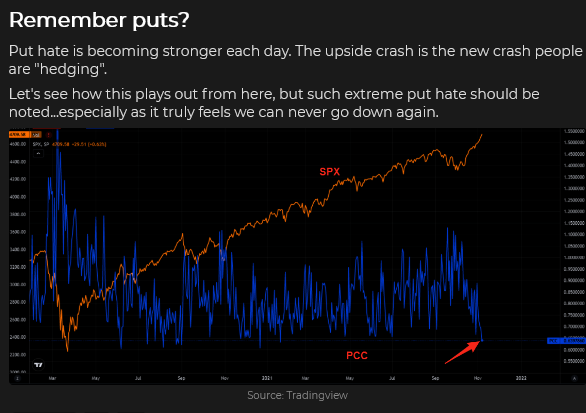
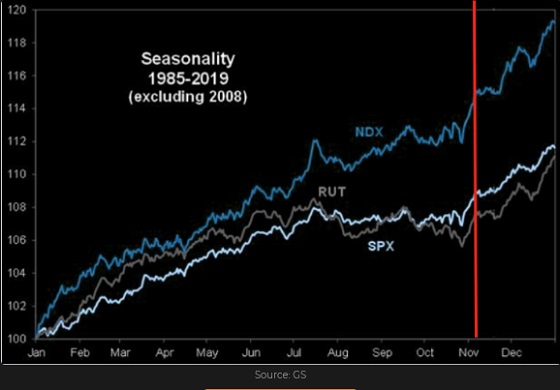
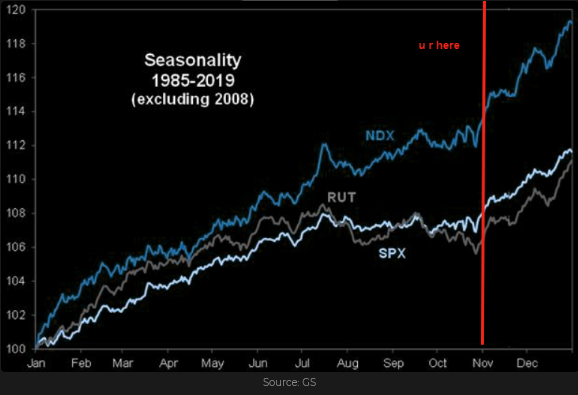
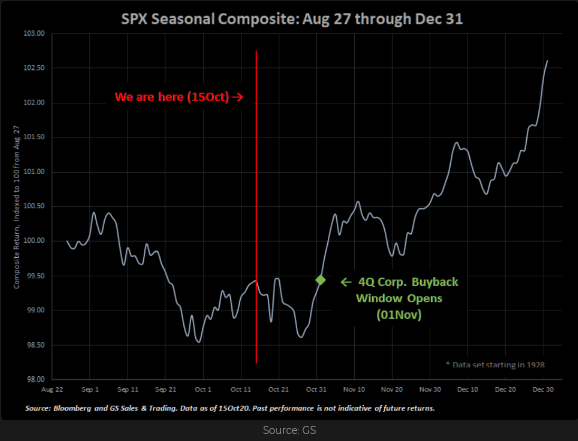
The major indices fell ~6% in September – the most prominent “tumble” we’ve seen since September 2020 – and then came roaring back the last five weeks to make new All-Time Highs. The Buy-The-Dip crowd is in an “I-Told-You-So” frame of mind – and who can blame them – you only need to look at the “seasonal trends” chart to see the roadmap to higher prices.
If markets reverse the trend of the last five weeks and take out the September lows (I know that seems impossible – but it was only five weeks ago), that would be the first time we’ve seen an interim low broken since the Covid Crash in March 2020. I think such a break would rattle the market and, perhaps, trigger some severe selling.
Thoughts on Trading – Why I read so much research, listen to podcasts, watch videos
In the gold section above, I mentioned that I’ve read Martin Murenbeeld’s weekly Gold Monitor for 30 years. Martin doesn’t offer a “buy this, sell that” service, and that’s not what I’m looking for when I read his letter. (I think letters that offer “buy this, sell that” advice are often “marketing” letters, not research letters.)
When I read a research piece, I want to be open to new ways of “seeing” things – especially if the ideas in the piece challenge some of the ideas I currently believe to be true. For instance, I got the idea that the gold ETF market was probably an excellent psychological barometer of the overall gold market while reading Martin’s letters. The next step was – if that’s the case, where’s the trade?
Another example: I recently watched a video prepared by Goehring and Rozencwajg (The Most Important 2000 Years Of Energy History) that challenged “conventional wisdom” concerning the importance of solar and wind-generated power as the world tries to transition away from fossil fuels. As I read their research, I was thinking, “If their ideas are correct, then a TON of capital is mal-invested in the energy markets – where’s the trade?”
Quotes from the Notebook
What were you thinking? Scott McNealy, founder and CEO of Sun Microsystems, from an address to an investor gathering in 2002. In 2000 shares of Sun Microsystems had been trading at $64 – which was ten times the firm’s annual revenue. Sun Microsystems was one of the HOT stocks during the dot-com boom.
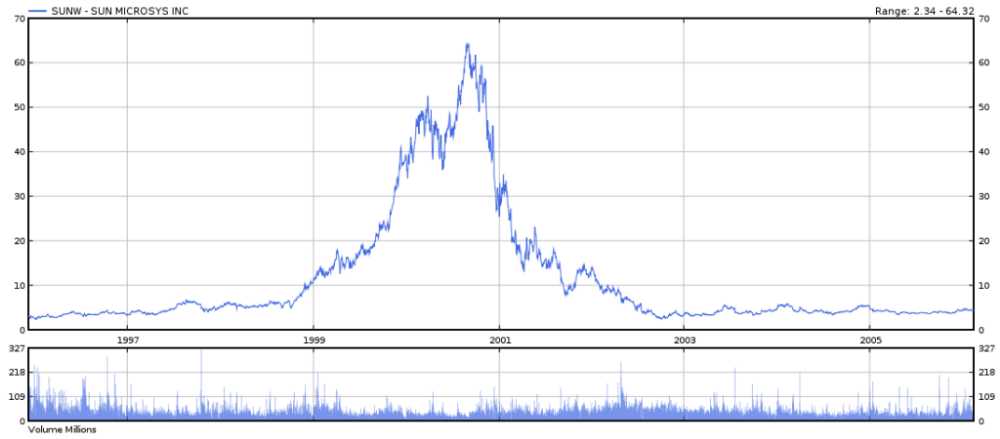
At ten times revenues, to give you a 10-year payback, I have to pay you 100% of revenues for ten straight years in dividends. That assumes I can get that by my shareholders. That assumes I have zero costs of goods sold, which is very hard for a computer company. That assumes zero expenses, which is really hard with 39,000 employees. That assumes you pay no taxes on your dividends, which is kind of illegal. And that assumes with zero R&D for the next 10 years, I can maintain the current run rate. Now, having done that, would any of you like to buy my stock at $64? Do you realise how ridiculous those basic assumptions are? You don’t need any transparency. You don’t need any footnotes. What were you thinking?“
My comment: Scott McNealy’s speech has become famous within the value investing community. What, indeed, were people thinking when they paid $64 a share (10X Sun’s annual revenue per share?) The value investing community would argue that people “weren’t thinking” when they did that – they were buying something because they believed (or had been told) that the share price was going to keep going higher.
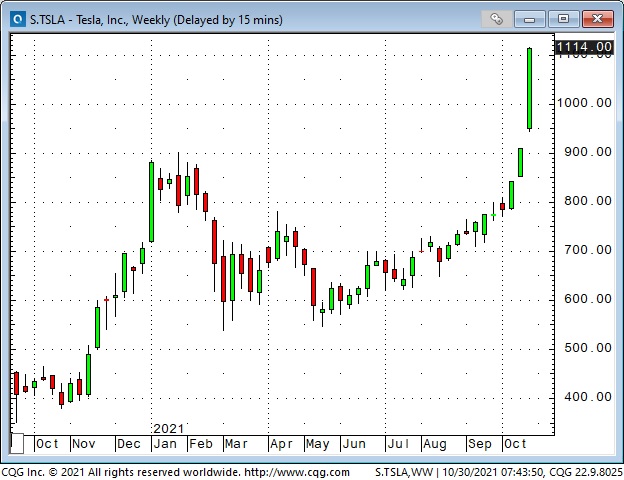
Tesla may be the modern-day version of Sun Microsystems. If we assume annual revenues are ~$40 per share, then, with the stock trading at ~$1,200 per share, the market is pricing Tesla at ~30X revenue. Can you imagine Elon Musk, two years from now, asking, “What were you thinking?
People will believe the most preposterous stories – so long as the price keeps going up. Bob Hoye many years ago
My comment: Nobody ever said it better. Thank you, Bob
This is Barney. He’s a 2-month old Golden Retriever / Border Collie.

Subscribe: You have free access to everything on this site. Subscribers receive an email alert when I post something new – usually 4 to 6 times a month.
Victor Adair retired from the Canadian brokerage business in 2020 after 44 years and is no longer licensed to provide investment advice. Therefore, this blog, and everything else on this website, is not intended to be investment advice for anyone about anything.
Each week Josef Schachter gives you his insights into global events, price forecasts and the fundamentals of the energy sector. Josef offers a twice monthly Black Gold (SER) newsletter covering the general energy market and 30 energy, energy service and pipeline & infrastructure companies with regular updates. We also hold quarterly webinars and provide Action BUY and SELL Alerts for paid subscribers. Learn more.
EIA Weekly Data: The EIA data of Wednesday November 3 was decidedly bearish. Commercial Crude Stocks rose 3.3MB (forecast was for a rise of 1.75Mb). If not for Net Imports falling 221Kb/d or by 1.5Mb on the week, overall storage would have risen by 4.8Mb on the week. Total Motor Gasoline inventories fell 1.5Mb on the week as US Refinery Runs rose 1.2% to 86.3% and from 85.1% in the prior week. This compares to the 86.0% pre-pandemic level of 2019. Distillate Fuel Inventories rose by 2.2Mb on the week. Crude Production recovered to a post-pandemic high of 11.5Mb/d or up by 200Kb/d.
In detail:
- Commercial Crude Oil Stocks rose by 3.3Mb to 434.1Mb. Energy bulls point to this being 50.3Mb below last year’s pandemic level, but it is close to the 438.9Mb seen at this time in 2019 and the 426.0Mb at the same time in 2018. So we do not concur that there is a shortage of oil in the US, the largest energy consuming nation.
- Demand for all products rose modestly last week. Total Product Demand rose 166Kb/d to 19.997Mb/d (demand was 21,597Mb/d at the same time in 2019). Other Oils demand fell by 538Kb/d to 3.389Mb/d. Gasoline consumption rose 181Kb/d to 9.504Mb/d (but is below the 9.784Mb/d consumed in 2019 at this time) while Jet Fuel Consumption rose 231Kb/d to 1.682Mb/d (1.833Mb/d consumed in 2019 at this time). Cushing Inventories fell by 0.9Mb/d to 26.4 Mb/d compared to 47.7Mb two years ago, before the pandemic. While Cushing is seeing lower storage, the Gulf Coast saw an increase of 1.9Mb to 249.3Mb and is 21.7Mb above its level of 227.6Mb in 2019 pre-pandemic. So storage at Cushing should not be worried about.
Baker Hughes Rig Data: The data for the week ending October 29th showed the US rig count rose by two rigs (fell one rig in the prior week). Of the total of 544 rigs working last week, 444 were drilling for oil and the rest were focused on natural gas activity. This overall US rig count is up 84% from 287 rigs working a year ago. The US oil rig count is up 101% from 221 rigs last year at this time. The natural gas rig count is up a more modest 39% from last year’s 72 rigs, now at 100 rigs.
Canada had a rise of two rigs (a decline of four rigs in the prior week) to 166 rigs. Canadian activity is now up 93% from 86 rigs last year. There were five more oil rigs working last week and the count is now 98 oil rigs working, up from 40 last year. There are 68 rigs working on natural gas projects now, up from 46 last year.
The material increase in rig activity over a year ago in both the US and Canada should continue to translate into rising liquids and gas production over the coming months, especially with the DUC count (drilled but uncompleted well count) falling sharply. The data from many companies on their plans for Q4/21 and forecasts for 2022 support this rising production profile expectation. We expect to see US crude oil production reach 12.0Mb/d this quarter. Companies are taking advantage of attractive costs and want to lock up experienced rigs and crews as staffing issues are getting tougher for the sector.
Conclusion:
We expect to see additional weekly builds in Commercial Crude Stocks over the next few weeks before winter fuel dem
and picks up.
Bearish pressure on crude prices:
1. Covid caseloads are growing around the world. In the US the death rate is over 747K deaths (up 10,000 during the last week). Worldwide the death count is now 5.0M. Deaths are rising in Eastern Europe particularly in Bulgaria, Slovenia, Romania, Russia and Ukraine.
2. Many US corporate and government employees are not planning on getting vaccinated and are now being put on unpaid leave and may soon lose their jobs. Millions more will have a shotgun decision in early December when the cut-off kicks in. NO JAB, NO JOB is the vaccination mantra. The US military is being significantly affected as many personnel are not planning on getting the vaccine in the required timeline and are planning court battles. The new “super-strain” Delta variant, known as AY.4V, is worrisome as it may have faster transmissivity. The normal winter flu season may soon impact Covid caseloads.
3. Energy demand is under pressure as high prices for most food, rent, taxes, child care, health expenses, auto costs and other daily necessities make spending decisions tougher for consumers. This gouge in prices will surely impact consumers’ buying behaviour in the coming months. The spending pie of consumers is shrinking and some spending habits of the past will have to be dropped. Demand destruction is on the way. Consumer Confidence is weakening and is nearing levels that have forewarned of recessions. Real US GDP grew 6.7% in Q2/21 and was seen at less than 2% in Q3/21. Recent economic releases indicate that we may already be in the early stages of a recession.
4. China has seen a rising wave of new infections in 19 of its 31 provinces (11 were hit as of last week). Many industrial plants in China have been closed due to the high cost of fuel and the Government’s plan to lower emissions in the Beijing area for the upcoming 2022 winter Olympics from February 4th to the 20th. Clean air is needed for the event and China wants to show it is making progress on its climate initiatives. This will dampen China’s consumption of fossil fuels over the next four to six months. Thermal coal prices have fallen over 50% in the last few weeks. Chinese PMI has fallen below 50 for the second month in a row.
Bullish pressure on crude prices:
- Speculative long investors (options traders, hedge and commodity funds) and a short squeeze on bearish positions in the futures and options markets on crude and natural gas have spiked up prices. Recently speculative buyers of nearby US$100/b options have increased them from under 20,000 contracts to >141,000 contracts for December 2021. In addition, large numbers of US$200 priced options for December 2022 are being bought. This excessive bullish view is very persistent and is a contrarian signal historically.
- Spot natural gas prices in Europe have backed off after President Putin confirmed that Russia would meet all European winter needs once they open the Nord Stream 2 Pipeline, which is now being filled and undergoing pressure tests before certification. Russian pressure seems to have worked on getting Europe to move quickly to certify the new line. This new pipeline doubles Russia’s annual export capacity to Europe. In the US, NYMEX today is US$5.63/mcf – and in Canada AECO is C$5.66/mcf as snow covers much of Alberta. All have backed off from recent highs as weekly US storage injections are now above the five year average and over 2020 .
CONCLUSION:
WTI backed off nearly 4% or US$3.25/b today to US$80.80/b (for the December contract and below US$80/b for the January 2022 contract) as the Commercial Crude Oil Stocks build number was higher than consensus. We see prices as having US$20-25/b of speculative value which should disappear as Commercial Crude Stocks continue their seasonal build. The question for us is what is happening to world wide demand as the two largest economies in the world slow down? We may be moving from stagflation to recession in 2022 in many countries. If the data comes out supporting recession conditions, the price slide could be quick and painful for leveraged speculative longs in crude oil futures and options.
Energy Stock Market: The S&P/TSX Energy Index currently trades at 162. The S&P Energy Bullish Percent Index backed off from the 100% level to 80.95% now. Energy stocks could fall 30-40% in the coming months with leveraged entities the hardest hit.
Our November Interim Update comes out tomorrow Thursday November 4th with details on the general stock market and its expected impact on the energy sector as well as reviews and updates on five early Q3/21 reporting companies. Our November SER Monthly will be out on Thursday November 25th and will cover the bulk of the 30 companies that we cover.
We will be holding our 90 minute Q4/21 quarterly Black Gold Webinar on Wednesday November 10th at 7PM MT. We will discuss in detail our view on the general stock market, the energy market and our bearishness on both areas for the near term. We will also go over those companies that have reported their Q3/21 results by the time of our cutoff for the webinar. We will have two Q&A sessions to go over our presentation materials and subscriber questions.
Over the next few months any number of events could lead to a domino effect of debt-laden companies getting into trouble and financial markets declining materially. The Dow Jones Industrials Index is now at 35,980 and could fall to below 30,000 during Q4/21 and to <25,000 during Q2/22. If you want to receive ongoing coverage of these negative market impacts, become an SER quarterly or annual subscriber. For new people, the quarterly offering is a good way to peruse our product before you determine which subscription format makes the most sense for your needs.
If you want access to all our SER reports or want to join our webinar then you will need to become a subscriber. Go to https://bit.ly/34iKcRt to subscribe.
If you enjoy reading our weekly ‘Eye on Energy’ feel free to forward it off to friends and colleagues. We always welcome new subscribers to our complimentary macro energy newsletter.
Tesla soars – stock indices hit new All-Time Highs
Tesla’s market cap was ~$1.14 Trillion at the end of October- up ~$340B for the month. $340B is more than the total market cap of 481 of the companies in the S+P 500. Massive buying of (very) short-dated call options helped accelerate this week’s rally following Monday’s news that (recently bankrupt car rental company) Hertz would buy 100,000 Tesla cars over the next 14 months – an order valued at ~$4B.
The broad market indices were inspired by the Tesla rally and closed the month at new All-Time Highs. The Nasdaq and the S+P were up ~7% in October – their best monthly performance YTD.
Short-term interest rates are sharply higher – yield curves are flatter
Most “Western” Central Banks have maintained that inflation was “transitory,” but recently, some of them (BoE, BoC, RBNZ, RBA) seem to be changing their minds. They have started to reduce (or halt) QE programs and have begun to raise interest rates or pencil in increases for 2022. The Fed is expected to announce formal plans to reign in their QE program at next week’s scheduled meeting.
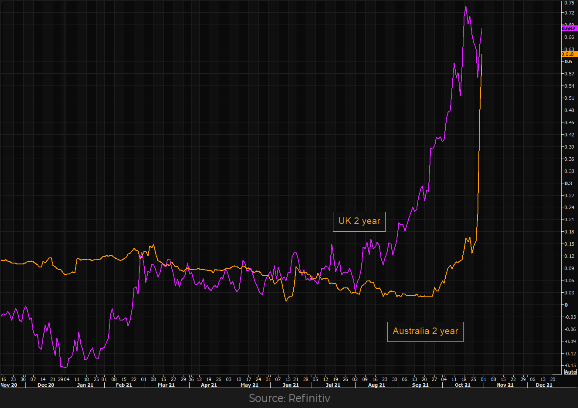
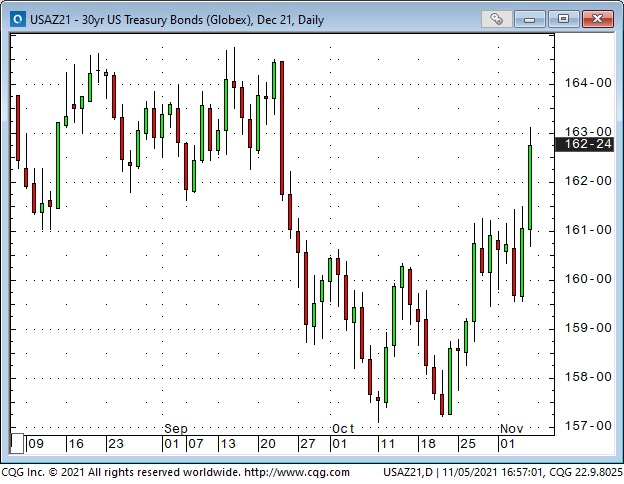
Bond yields trended higher after hitting All-Time Lows in August 2020, but they have been steady/better recently, while short rates have soared, causing a dramatic flattening of the yield curve. The “street” has been hugely bearish of bonds (while analysts like David Rosenberg and Lacy Hunt have been bullish) mainly because of inflation fears. Is the flattening curve a sign that the bond market sees weaker economic growth ahead? Does the bond market fear that CBs may be tightening into a recession?
Big moves in the currency markets
The US Dollar Index hit a 13 month high three weeks ago, slipped lower for the next 12 days, but closed the month with a powerful rally on Friday. COT data as of Oct 26 show that net spec positioning remains long the USD Vs. most currencies – especially against the Yen and the AUD.
The Euro is ~58% of the USDX, and the EURUSD chart is virtually a mirror image of the USDX. However, since mid-September, the Euro has plunged Vs. the Swiss Franc and the British Pound.
The Japanese Yen has been especially weak against the USD (down ~10% YTD) and down >5% since mid-September.
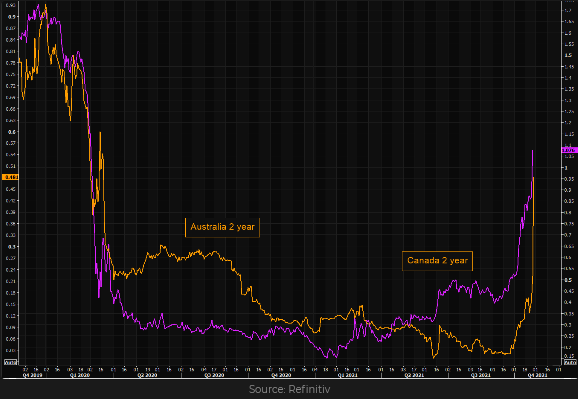
The Canadian dollar is one of the few actively traded currencies that has rallied against the USD this year (the Russian Ruble and the Chinese RMB are also up YTD.) The CAD rallied nearly a full cent following the surprise tightening from the BoC on Wednesday (CDN 2Y yields now ~1.05% Vs. US 2Y yields at 0.52%), but the CAD could not sustain those gains as the USD surged Vs. all currencies on Friday.
The red-hot commodity rally takes a breather
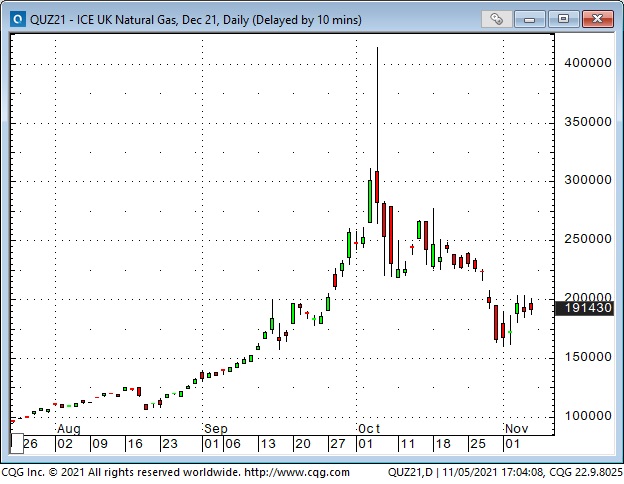
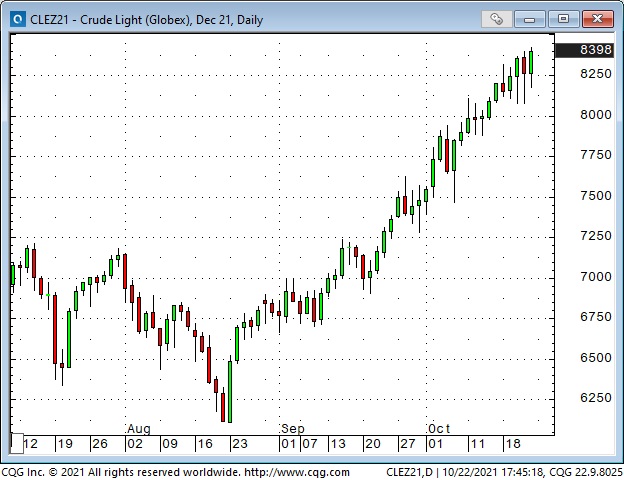
WTI crude oil touched a 7-year high last week around $85 but fell back ~6% at this week’s $81.50 lows. Chinese coal and iron ore prices are sharply lower. US NatGas prices have fallen back a bit after hitting 13-year highs, while UK NatGas prices are down ~60% from the record highs hit four weeks ago – albeit at prices that would have been All-Time highs six weeks ago.
My short term trading
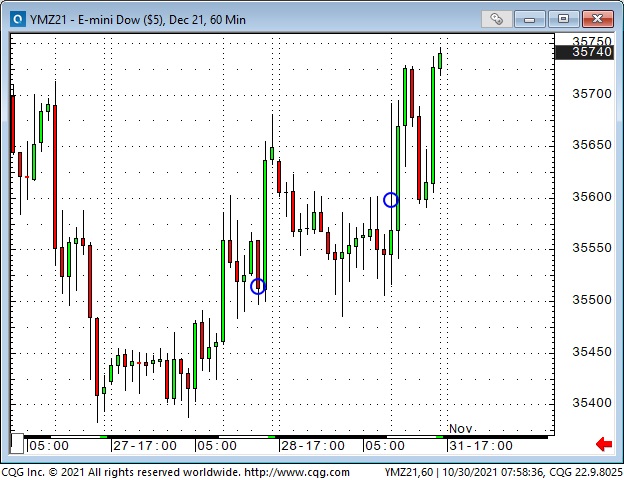
I started this week flat – but per the “on my radar” section of last week’s Notes, I was looking for an opportunity to short stock indices. I sat through the (Tesla-inspired) rally during the Monday day and overnight sessions. I shorted the S+P on Tuesday after it fell back from ATH, bounced and then slumped lower. In a short-term time frame, I was selling a market that was falling away from a lower high.
The market fell overnight Tuesday, dropping below both the Monday overnight lows and the Tuesday day session lows – my trade seemed to be working. However, the market couldn’t sustain the breakdown, so I covered my position early Wednesday for a slight loss.
I shorted Dow futures during the Thursday day session (the Dow looked to be the weakest of the NAZ, S+P and Dow indices) only to have it rally strongly into the close on earnings announcements. I held the position overnight and saw the market drop slightly below my entry price, but, once again, the market had an excellent opportunity to sell off – but didn’t take it! I covered the trade for another small loss early Friday day. I’m flat at the end of the week. My P+L is down ~0.20% on the week.
In hindsight, my bearish bias was wrong – the NAZ, S+P and Dow all rallied this week. The good news was that I kept my losses very small.
On my radar
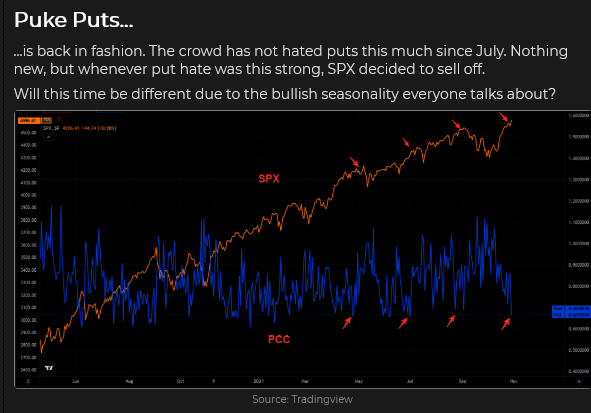
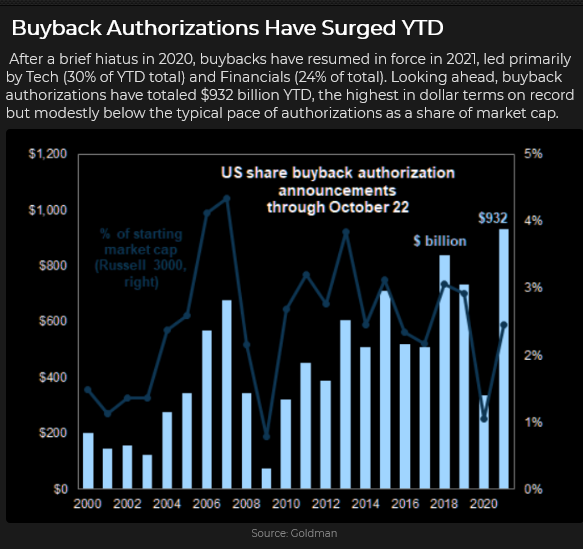
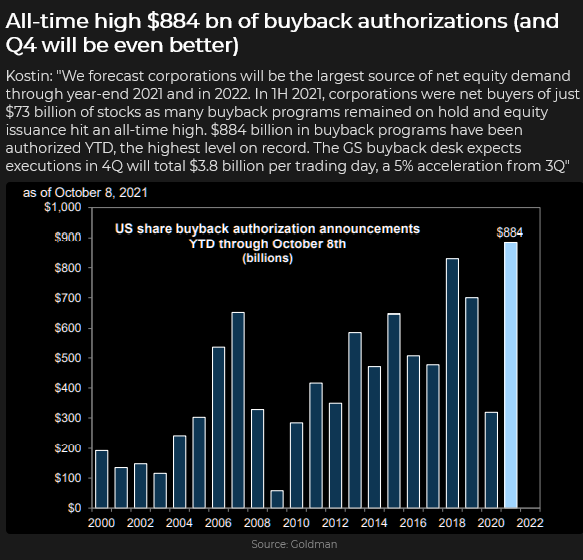
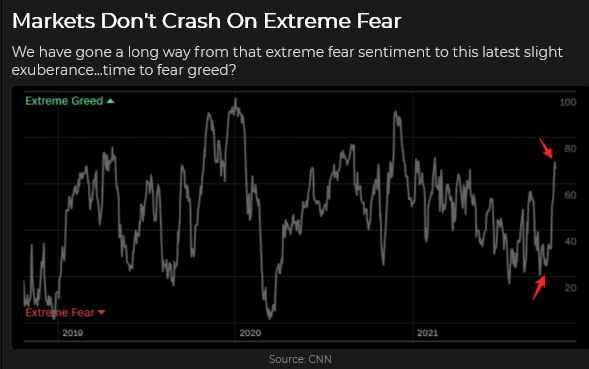
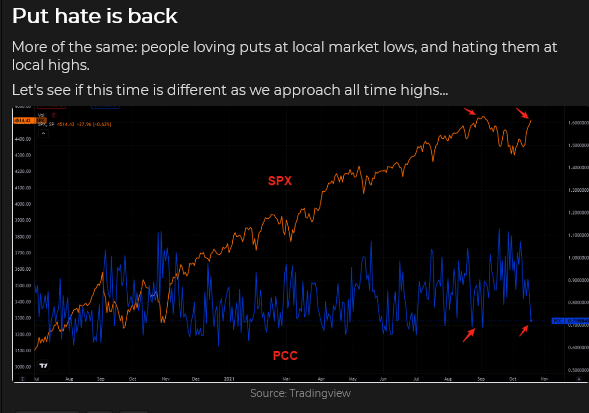
Stock market sentiment (at least in terms of put/call buying) is exceptionally bullish. AAPL and AMZN (~10% of the S+P market cap) had disappointing earnings reports. Seasonality, Buybacks and capital flows are bullish. This week, the Fed statement could jolt the market (the Toronto stock market fell hard on the BoC hawkish surprise.)
It was unusual to see the USD and the US stock market both strong on Friday. For the past two months, the correlation between the USD and the stock markets has been strongly negative. Maybe the FX market had a month-end rebalance – or perhaps the FX market has a different “take” on next week’s Fed meeting.
Like last week, I’ll be looking for opportunities to fade irrational exuberance in stocks and commodities. I won’t sell new highs, but I’ll look to shoot markets in the back if they have started to fall! (h/t Bill Fleckenstein.)
Thoughts on trading – using and moving stops
My friend Peter Brandt says that his net profitability, over time, is much more a result of how he manages his trades – not why he entered the trade. I agree, and like Peter, my trading style results in many small losses (hopefully no significant losses), lots of slightly bigger winning trades, and the occasional big winner. (Peter says that 100% of his net profits, over time, have come from only 15% of his trades.)
Stops are a vital part of my trading process. I develop a bias on the market, but I will wait for price action to create a setup before I take a position. (I won’t trade a market that I know nothing about solely because price action has made a good setup. I realize that some very successful traders can trade a SYMBOL without knowing what is behind the SYMBOL, but that approach doesn’t suit me – maybe someday I’ll change.)
Let’s say my bias is that irrational exuberance has taken the stock indices too high too fast, and I think they are at risk of a reversal. (My bias comes from a variety of technical, fundamental, sentimental and intuitive inputs.) I won’t sell stock indices simply because I think they are “over-valued” – they could quickly become more over-valued. (I’ve never been short Tesla.) I want to see the market turn down before I get short. (Turn down means different things in different time frames – I try to keep the time frames of my trading and analysis in sync.)
Let’s say my time frame is a few days to a few weeks. I’m not looking for the stock market to fall to zero – I’d be delighted to catch a move of 50 – 100 points in the S+P or 500 – 1,000 points in the Dow, and I think that could happen within my time frame. I don’t want to sell the market simply because it has dropped from a high – at the least, I want to see a pattern where the market has fallen from a high, bounced to make a lower high and has now turned lower again. (Ideally, the market has made an “M” top – with a lower right shoulder – on more than one time frame.)
Let’s say I see a good setup developing. The first thing I’m going to ask myself is, “If I short the market here, where will I put my stop?” I want the stop to be where I know I’m wrong on the trade – the stop isn’t defining a dollar amount of risk. If my stop point is too far away from the potential entry point (too much money is at risk), I either don’t make the trade, or I look for another way to make the trade. For instance, I reduce my position size or look at an option strategy to reduce risk (for example, buy puts or write puts against a short futures position), but that creates a whole new series of risks that will need to be managed!
Let’s say I short the market and enter a stop. I understand that the market could gap higher than my stop (over a weekend or an extreme event), and I will get filled at a worse level than my stop. Those things sometimes happen.
I think of a stop as the “limit” on how much I’m willing to lose when I enter the trade. As time passes and prices change, and different “news” hits the market, my stop point needs to be re-assessed.
For instance, on both short trades I made this week, I covered my positions before the market rallied to my stops because “things had changed” since I had entered the market. Specifically, prices had fallen below my entry points but had not continued lower. (The market had an excellent opportunity to drop – but didn’t take it.) I no longer wanted to be short, so I covered the trades and cancelled my stops.
If prices had kept falling, I would have re-assessed my stop point – I would likely have lowered my stop to a new level that made sense at that time. Rinse and repeat if and when prices kept falling.
Quotes from the notebook
“Wait for the market to set up in a way that you like and then try to put on a position as close as possible to your stop-out point to reduce capital risk relative to the potential return.” Mac Kaylan – Vancouver 1998
My comment: Before I knew Mac, I traded based on my market opinions. For instance, if I liked gold, I’d buy gold. I’d use stops, but Mac got me thinking more about using setups not only to limit losses but to “time” my entry points.
“Conventional Wisdom is one of the greatest oxymorons in history!” Howard Marks
“Conventional Wisdom matters because it can become a self-fulfilling prophecy.” George Friedman
My comment: I agree with both of these quotes! My friend Kevin Muir likes to say that if something (in the market) is obvious, then it’s obviously wrong! That’s the oxymoron part. The truth is, something (in the market) can be wrong and get even worse – before it gets right. That’s the self-fulfilling prophecy part.
“There are buyers higher and sellers lower.” Tommy Thorton Hedge Fund Telemetry
My comment: This is a beautiful insight into momentum. Why would you pay more for something tomorrow when you can buy it cheaper today? Why? Because it’s going up!
“You gotta get your mind right.” The Warden to Luke (and near the end of the movie – Luke himself says this) in the film Cool Hand Luke starring Paul Newman as Luke 1967
My comment: In that amazing movie, the warden wanted Luke to see the “error of his ways” – the mistakes he was making by trying to break out of prison. He tried to break Luke’s spirit – to make him a docile prisoner, but perhaps he was also pointing out a fact – there was no escaping from that prison and until Luke truly understood that running was impossible – until he genuinely “got his mind right” he was going to experience a lot of pain.
From a trading perspective, “getting your mind right” would mean being in sync with the market – rather than fighting it and experiencing a lot of pain.
Subscribe: You have free access to everything on this site. Subscribers receive an email alert when I post something new – usually 4 to 6 times a month.
Victor Adair retired from the Canadian brokerage business in 2020 after 44 years and is no longer licensed to provide investment advice. Therefore, this blog, and everything else on this website, is not intended to be investment advice for anyone about anything.
Each week Josef Schachter gives you his insights into global events, price forecasts and the fundamentals of the energy sector. Josef offers a twice monthly Black Gold (SER) newsletter covering the general energy market and 30 energy, energy service and pipeline & infrastructure companies with regular updates. We also hold quarterly webinars and provide Action BUY and SELL Alerts for paid subscribers. Learn more.
EIA Weekly Data: The EIA data of Wednesday October 27th was decidedly bearish. Commercial Crude Stocks rose 4.3MB (forecast was for a rise of 1.53Mb). Total Motor Gasoline inventories fell 2.0Mb on the week as US Refinery Runs rose 0.4% to 85.1% from 84.7% in the prior week. This compares to the 87.7% pre-pandemic level of 2019. Crude Production remained at 11.3Mb/d.
In detail:
• Commercial Crude Oil Stocks rose by 4.3Mb to 430.8Mb. Energy bulls point to this being 61.6Mb below last year’s pandemic level, but it is close to the 438.9Mb seen at this time in 2019 and the 426.0Mb at the same time in 2018. So we do not concur that there is a shortage of oil in the largest consuming nation.
• Demand for all products fell materially last week. Total Product Demand fell 2.0Mb/d to 19,832Mb/d (demand was 21,597Mb/d at the same time in 2019) as Other Oils demand fell by 1.13Mb/d to 3.927Mb/d. Gasoline consumption fell 311Kb/d to 9.323Mb/d (below the 9.784Mb/d consumed in 2019 at this time) while Jet Fuel Consumption rose 37Kb/d to 1.452Mb/d (1,833Mb/d consumed in 2019 at this time). Cushing Inventories fell by 3.9Mb/d to 27.3 Mb/d compared to 46.0Mb two years ago, before the pandemic.
Baker Hughes Rig Data: The data for the week ending October 22nd showed the US rig count fell by one rig (rose 10 rigs in the prior week). Of the total of 542 rigs working last week, 443 were drilling for oil and the rest were focused on natural gas activity. This overall US rig count is up 89% from 287 rigs working a year ago. The US oil rig count is up 110% from 211 rigs last year at this time. The natural gas rig count is up a more modest 36% from last year’s 73 rigs, now at 99 rigs. The Permian saw an increase of one rig to 268 rigs and is up 102% from 133 rigs last year at this time.
Canada had a decline of four rigs (up one rig in the prior week) to 164 rigs. Canadian activity is now up 98% from 83 rigs last year. There were five less oil rigs working last week and the count is now 93 oil rigs working, up from 42 last year. There are 71 rigs working on natural gas projects now, up from 41 last year.
The material increase in rig activity over a year ago in both the US and Canada should continue to translate into rising liquids and gas production over the coming months, especially with the DUC count (drilled but uncompleted well count) falling sharply. The data from many companies on their plans for Q4/21 and forecasts for 2022 support this rising production profile expectation. Companies are taking advantage of attractive costs and want to lock up experienced rigs and crews as staffing issues are getting tougher for the sector.
Conclusion:
We expect to see more weekly builds in Commercial Crude Stocks over the next few weeks before winter fuel demand picks up.
Bearish pressure on crude prices:
1. Covid caseloads are growing around the world. In the US the death rate is over 737K deaths (up 11,000 over the last week). Worldwide the death count is now 4.95M. Deaths are rising in Eastern Europe particularly in Belarus, Bulgaria, Latvia, Romania, Russia and Ukraine.
2. Many US corporate and government employees are not planning on getting vaccinated and will lose their jobs. Millions more will have a shotgun decision in early December when the cut-off kicks in. NO JAB, NO JOB is the vaccination mantra. The US military may be affected as many personnel do not plan on getting the vaccine in the required timeline. The new “super-strain” Delta variant known as AY.4V is worrisome as it may have faster transmissivity. The normal winter flu season may soon impact Covid caseloads.
3. Energy demand is under pressure as high prices for most food, rent, taxes, child care, health expenses, auto costs and other daily necessities make spending decisions tougher for consumers. This gouge in prices will surely impact consumers’ buying behaviour in the coming months. The spending pie of consumers is shrinking and some spending habits of the past will have to be dropped. Demand destruction is on the way. Consumer Confidence is weak and is nearing levels that have forewarned of recessions.
4. China’s domestic economy grew by 4.9% in Q3/21 down from the 7.9% rate in the prior quarter. There are forecasts that the real GDP growth in Q4/21 may be miniscule. Consumption of crude is coming down as China cuts oil import quotas from independent refineries. September imports were down 15% from a year earlier. China has seen a wave of new infections in 11 of its provinces. Many industrial plants in China have been closed due to the high cost of fuel and the Government’s plan to lower emissions in the Beijing area for the upcoming 2022 winter Olympics from February 4th to the 20th. Clean air is needed for the event and China wants to show it is making progress on its climate initiatives. This will dampen China’s consumption of fossil fuels over the next four to six months.
Bullish pressure on crude prices:
1. Speculative long investors (options traders, hedge and commodity funds) and a short squeeze on bearish positions in the futures and options markets on crude and natural gas have spiked up prices. It could go higher but as these positions are reversed, the parabolic price spike could reverse sharply on any negative news. Recently speculative buyers of nearby US$100/b options have increased them from under 20,000 contracts to >141,000 contracts for December 2021. In addition, large numbers of US$200 priced options for December 2022 are being bought. This excessive bullish view is very persistent and is a contrarian signal historically.
2. Spot natural gas prices in Europe have backed off after President Putin confirmed that Russia would meet all European winter needs once they open the Nord Stream 2 Pipeline, which is now being filled and undergoing pressure tests before certification. The new lines can double Russia’s annual export capacity to Europe. In the US and Canada, NYMEX today is US$5.97/mcf – and in Canada AECO is C$4.65/mcf. All have backed off from recent highs as weekly US storage injections are now above the five year average and over 2020 .
CONCLUSION:
WTI has backed off US$1.34 to US$83.31/b as the Commercial Crude Oil Stocks build number was higher than consensus. We see prices as having US$20-25/b of speculative value which should disappear as Commercial Crude Stocks continue their seasonal build. The question for us is what is happening to world wide demand as the two largest economies in the world slow down? We may be moving from stagflation to recession in 2022 in many countries. If the data comes out supporting recession conditions, the price slide could be quick and painful for leveraged longs of futures and options.
Energy Stock Market: The S&P/TSX Energy Index currently trades at 158 (only one point above last week). The S&P Energy Bullish Percent Index backed off from the 100% level to 85.71% now. Energy stocks could fall 30-40% in the coming months with leveraged entities the hardest hit.
Our November Interim Report comes out next Thursday November 4th with details on the general stock market and its expected impact on the energy sector and review and updates on the early Q3/21 reporting companies. Our November SER Monthly will be out on Thursday November 25th and will cover the bulk of the 30 companies that we cover.
Over the next few months any number of events could lead to a domino effect of debt-laden companies getting into trouble and financial markets declining materially. The Dow Jones Industrials Index is now at 35,630 and could fall to below 30,000 during Q4/21 and to <25,000 during Q2/22. If you want to receive ongoing coverage of these negative market impacts, become an SER quarterly or annual subscriber. For new people, the quarterly offering is a good way to peruse our product before you determine which subscription format makes the most sense for your needs. We will be holding our 90 minute Q4/21 quarterly Black Gold Webinar on Wednesday November 10th at 7PM MT. We will discuss in detail our view on the general stock market, the energy market and our bearishness on both areas for the near term. We will also go over those companies that have reported their Q3/21 results by the time of our cutoff for the webinar. We will have two Q&A sessions to go over our presentation materials and subscriber questions. If you want access to all our SER reports or want to join our webinar then you will need to become a subscriber. Go to https://bit.ly/34iKcRt to subscribe. If you enjoy reading our weekly ‘Eye on Energy’ feel free to forward it off to friends and colleagues. We always welcome new subscribers to our complimentary macro energy newsletter.
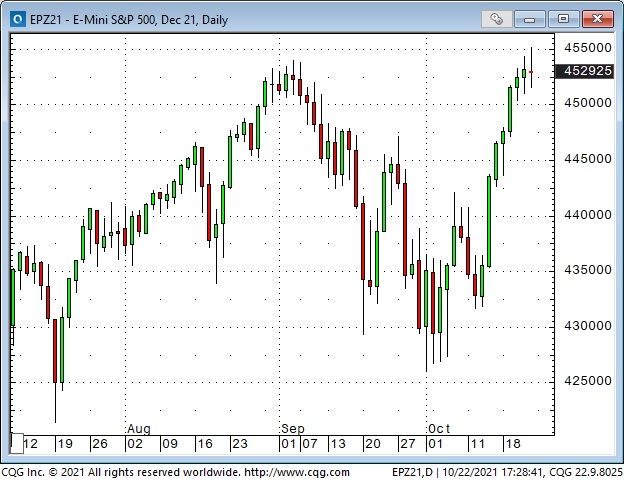
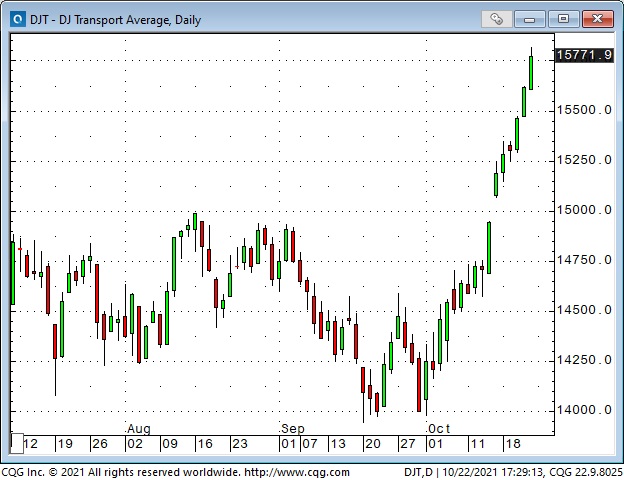
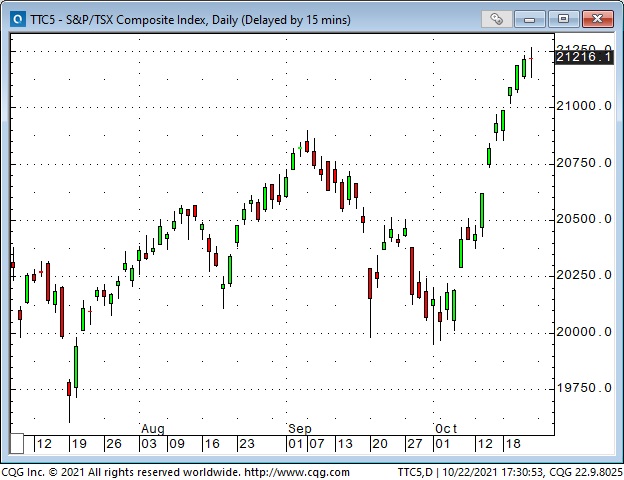
New All-Time Highs for the leading stock indices – but “rotation” rules.
The S+P and the DJIA came roaring back and hit new All-Time highs after that tiny 6% dip in September (capital flows show that retail and hedge funds Bought-The-Dip), but the tech-heavy Nasdaq and the small-cap Russell fell short of making new highs. The Transports and the TSE smoked the other indices.
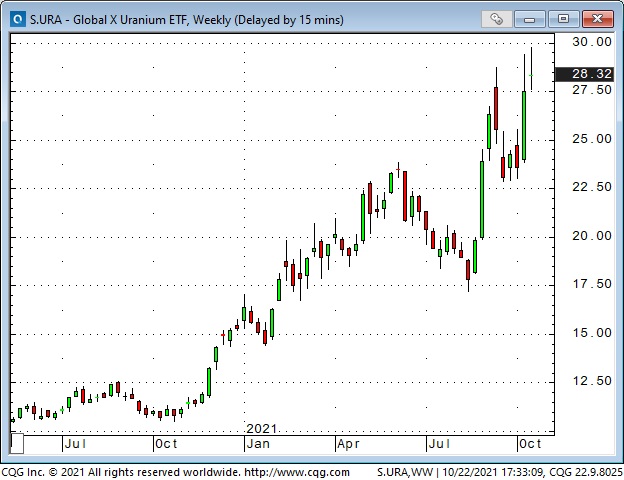
Energy markets continue to rip higher – Crude oil, Gasoline, Heating oil and Uranium are at 7-year highs.
WTI has risen for nine consecutive weeks.
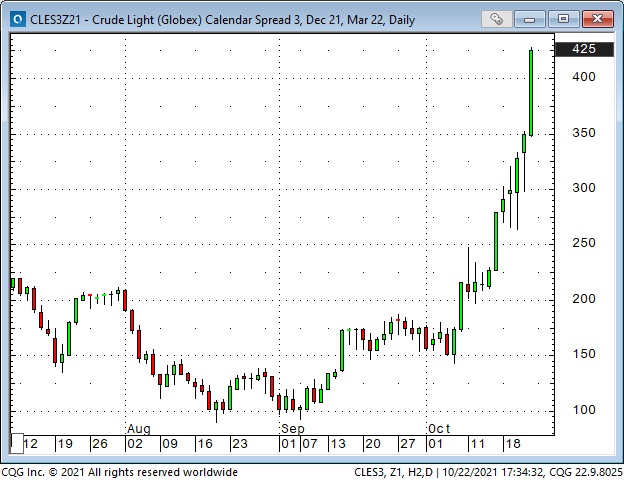
Something big is happening in the WTI forward curve.
The premium of front-month WTI has soared over the deferred months while the entire backwardated curve has steepened. Is this caused by shortages of physical WTI for near-immediate delivery? Is it due to speculators concentrating their buying in front-month contracts? Is it a sign that margin clerks are lifting every offer they can find to liquidate a colossal spec short position? Is it just another example of the Brave New World of energy markets – and players beware? One odd thing – while WTI prices have soared and time spreads have exploded, the implied vol on WTI options has done nothing. It sits around the mid-range of where it has been for the past several months.
This spread chart shows that December WTI traded at a premium of ~$1.50 over March in early October – by Friday, the premium had soared to ~$4.25.
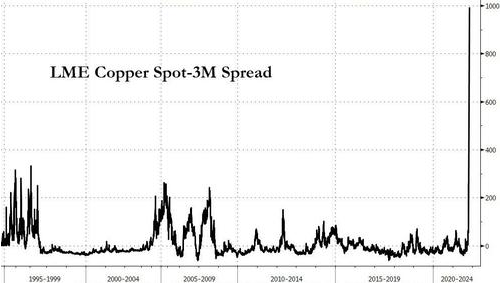
Copper spreads soar on physical shortages.
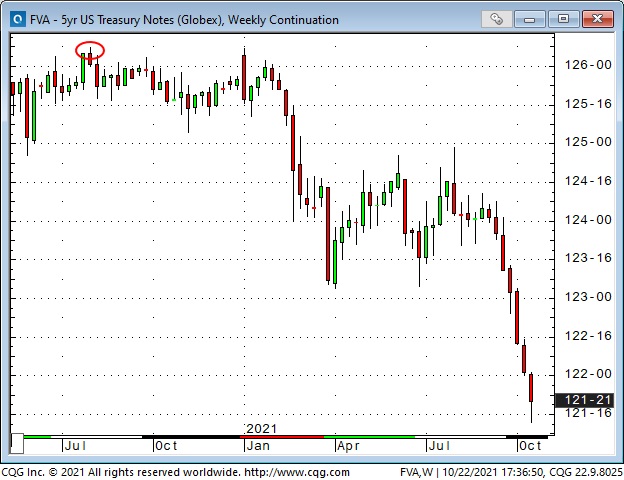
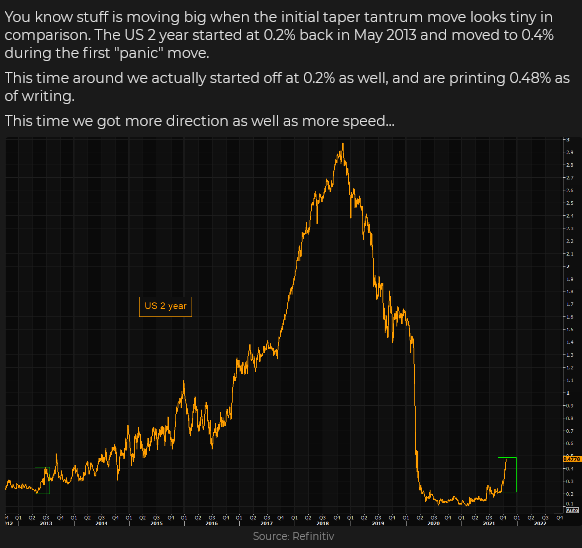
Interest rates are rising – as markets prepare for Central Bank tightening. Short rates are rising faster than long rates.
The long bond hit an All-Time low yield (high price in this chart) in August 2020.
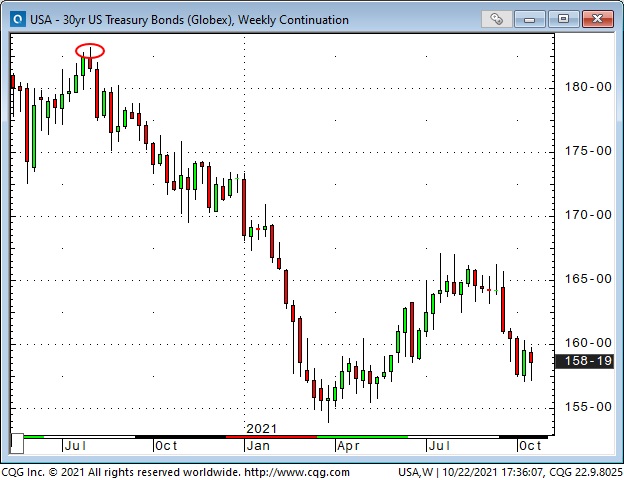
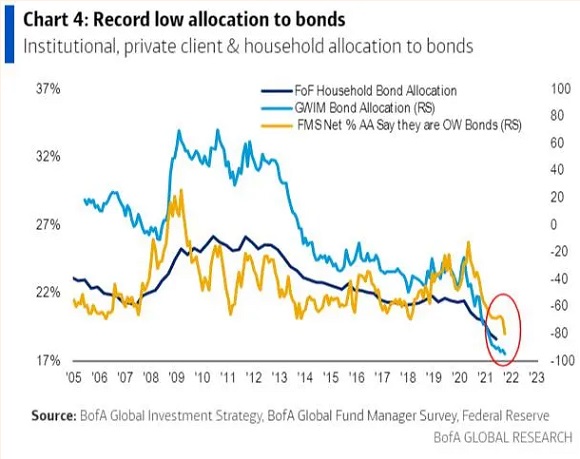
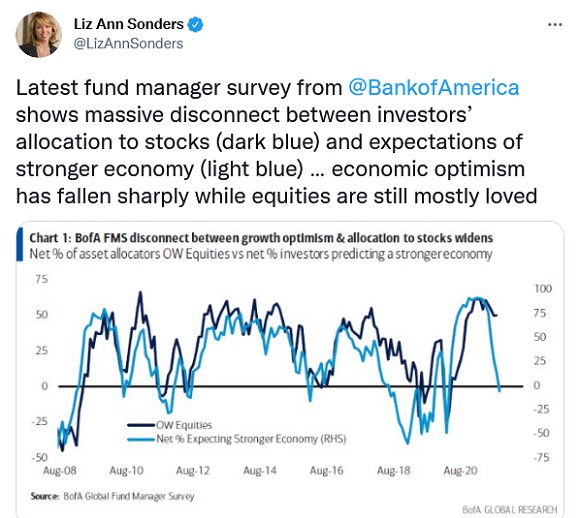
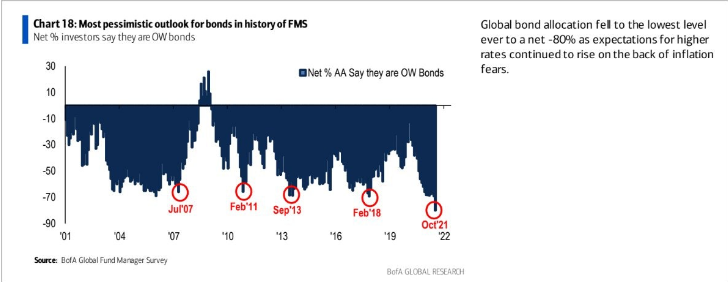
The monthly Bank of America survey of Fund Managers shows them to be the “shortest” of bonds in the survey’s 20-year history.
Short rates are rising faster than long rates.
The US Dollar fell from one-year highs as “risk-on” sentiment floods the markets.
The Yen has been the weakest of the major currencies Vs. the USD – down ~10% YTD. The Korean Won is also down ~10% YTD.
The CAD and the Rusian Ruble (commodity currencies) are two of the few actively traded currencies that have risen YTD Vs the USD. The CAD is at a 6-year high Vs the Yen. Is it as simple as Japan is a vast energy importer while Canada is a net energy exporter?
From the viewpoint of a cynical (or realistic) FX speculator, the price of CADUSD is a function of 1) the relative strength of the USD Vs. other currencies, 2) the relative strength of the commodity markets, especially fossil fuels, and, 3) the relative strength of the stock market. Think of the CAD as a cork floating in the ocean – where the “water” is the USD, the commodity market and the stock market. Canadian domestic inputs have relatively little impact on the CADUSD. CAD short rates are now premium to USD short rates, but that is not nearly as important as the Big Three factors.
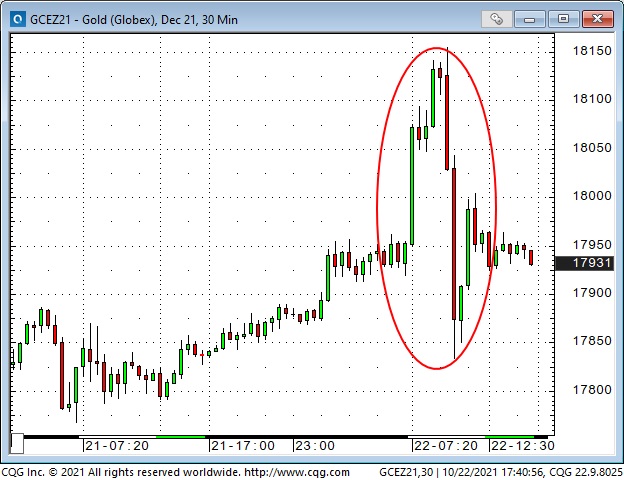
Gold hit a 6-week high above $1,800 on Friday, but…
Gold was up >$30 early during the NY “floor” session on Friday, Oct 22, but tumbled >$30 in just over 30 minutes mid-day when Powell confirmed that the Fed would go ahead with their “taper” plans.
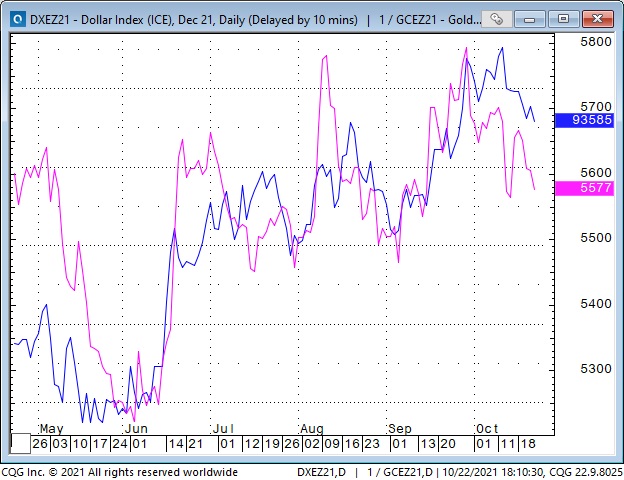
Gold and the USD have had a strong negative correlation YTD. In this chart, gold (pink line) is inverted. The blue line is the US Dollar index.
My short term trading
I started the week flat and did nothing for the first three days. Call it a mini-vacation or say I was patiently waiting for a setup I liked.
Over the past few weeks, I have been both long and short stock indices. I had closed out a long position late last week for a decent profit, and I was looking for the market to roll over this week. I did not short the market Monday through Wednesday because it was trending higher. I thought I saw a topping pattern on Thursday (selective vision), and I got short. I was quickly stopped out for a small loss. The same thing happened on Friday. I’m flat at the end of the week, and my P+L was down ~0.4% on the week.
On my radar
I’m well aware that the seasonal trend of the stock market is higher for the rest of the year – and that the stock market seems very capable of absorbing “bad” news and continuing to rally. I’m not a perma-bear (although I like to fade irrational exuberance), and I have made money buying stock indices recently, but – next week, I’ll be looking for setup opportunities to short stock indices or other examples of speculative excess!
I interviewed Bill Fleckenstein years ago. He gave me some great advice about shorting: “I don’t short markets because I think they’re overvalued. Markets can easily get much more over-valued. I short markets that I have good reason to believe are going to go down. One of the best reasons they may be going down is that they have already started to go down. You want to shoot them in the back.”
Thoughts on trading
I rarely write about crypto. I don’t know what it is, but I’m curious about it in terms of market psychology. Is it, for instance, the posterchild for hot money seeking the new, new thing? Is it the perceived hedge against inflation for the millennial generation, as gold was for the boomers? Is it the modern version of tulipmania, or will digital currencies become the backbone of global finance?
Forty years ago, I was in the main trading room of (what became) one of Canada’s largest bank-owned brokerage firms. They traded “everything” on that floor, but the guy I was visiting traded absolutely nothing but the CADUSD. He wasn’t a market-maker; he was a prop trader, so he only traded when he wanted to. He seemed to be well respected by other traders on the floor, and he “took input” from everybody about what was happening in their markets, but he only traded CADUSD.
I’m interested in all kinds of markets; I’m a Macrotourist – but I don’t “feel the need” to trade all the markets. I also don’t “feel the need” to trade just one market. One of my core beliefs is that successful traders find a way to participate in markets that suits them.
I sometimes wonder if my Old School metrics for understanding things like value, or rate of change, are out-of-step with markets these days.
Quotes from the notebook
“In an inflationary world, you want to have a strong currency if you’re an importer.” Louis Gave, in an interview with Grant Williams 2021
My comment: I listened to that podcast a few days ago and immediately thought this quote was an example of cognitive dissonance. A strong currency would be great because it would make imports cheaper, but don’t net importers ultimately get a weaker currency?
“It is easier to spend money than it is to make it. When there is no money coming in the door, LOVE flies out the window.” My Grandmother 40 years ago
My comment: Forty years ago, commodity brokers were making lots of money, driving new sports cars, while stockbrokers were taking the bus to work, carrying their lunch in a paper bag. We used to have expensive lunches and would say, “It’s only three ticks in the bonds,” when we ordered another $100 bottle of wine. Easy come, easy go, but there are always consequences.
“We couldn’t panic even if we wanted to…there were NO bids to hit!” Steve Leuer S+P floor broker during the August 2015 market break
My comment: If you’re going to panic, panic early!
“If you want to make God laugh…tell him you’ve got a plan.” Woody Allen (and other people)
“Everyone has a plan until they get punched in the mouth.” Mike Tyson 1987
My comment: Making plans is a good idea, but since Anything Can Happen, be prepared that your plans don’t work out.
“You have to assume that the money in your client’s account is all the money he has.” Peter Appleby, Branch Manager, ContiCommodity 1984 – in reply to a broker telling Peter that he was confident his client would come up with the money to meet his margin call.
My comment: When I was a branch manager, I always told my guys to never let a client use more than 50% of his capital to margin trades. Clients who constantly used 100% (or more) of their capital for margin purposes ALWAYS went broke – and took somebody down with them – usually their broker!
Subscribe: You have free access to everything on this site. Subscribers receive an email alert when I post something new – usually 4 to 6 times a month.
Victor Adair retired from the Canadian brokerage business in 2020 after 44 years and is no longer licensed to provide investment advice. Therefore, this blog, and everything else on this website, is not intended to be investment advice for anyone about anything.
-
I know Mike is a very solid investor and respect his opinions very much. So if he says pay attention to this or that - I will.
~ Dale G.
-
I've started managing my own investments so view Michael's site as a one-stop shop from which to get information and perspectives.
~ Dave E.
-
Michael offers easy reading, honest, common sense information that anyone can use in a practical manner.
~ der_al.
-
A sane voice in a scrambled investment world.
~ Ed R.
Inside Edge Pro Contributors

Greg Weldon

Josef Schachter

Tyler Bollhorn

Ryan Irvine

Paul Beattie

Martin Straith

Patrick Ceresna

Mark Leibovit

James Thorne

Victor Adair