
Op/Ed
Major stock indices drop to 10-week lows – then bounce
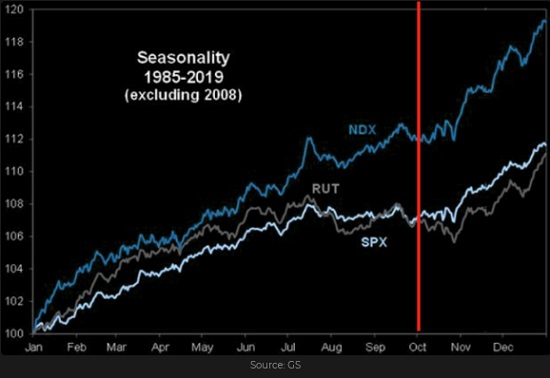
The most significant broad market decline since Biden’s election (S+P and DJIA down ~6%, Nasdaq 100 down ~7.5%) happened right on schedule. For the previous 35 years, September (especially the 2nd half) has typically been the weakest month of the year – followed by the best quarterly returns in Q4. Is the Merck covid pill kicking off another strong fall rally?
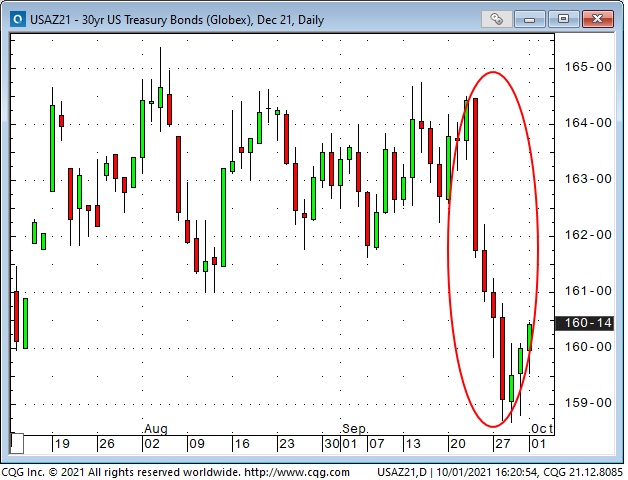
A sharp fall in bond prices accelerated the late September weakness in stocks
Bond yields spiked higher after the Fed signalled that they would soon begin tapering their $120 billion a month QE program. With Central Banks around the world likely to reduce their respective QE programs (totalling ~$300 billion a month), who will buy bonds? Is “persistent” rather than “transitory” the new CB watch-word for inflation?
Stalled stimulus programs in dysfunctional DC add to bearish stock market sentiment
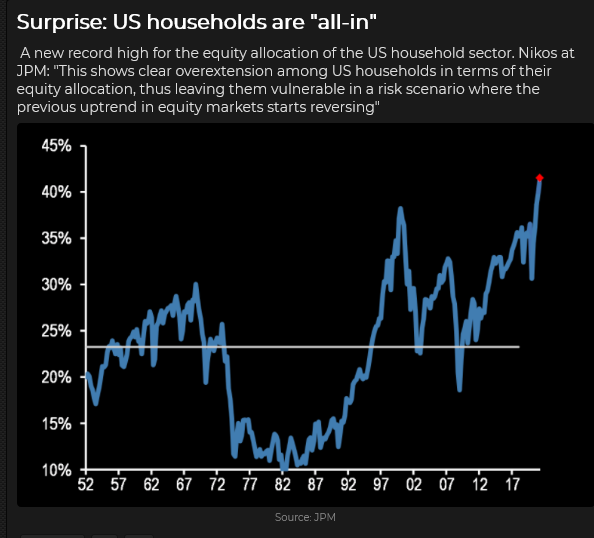
Massive QE and massive government stimulus were the two significant drivers behind the 100% stock market rally off the 2020 lows. With Biden struggling to unite Democrats (let alone soliciting Republicans) to support his key proposals, it looks like much less-than-expected stimulus will be coming from DC. As Joe Manchin (Democratic Senator from W. Virginia) says, “We’ve spent more than $5-Trillion since March 2020. How much is enough?”
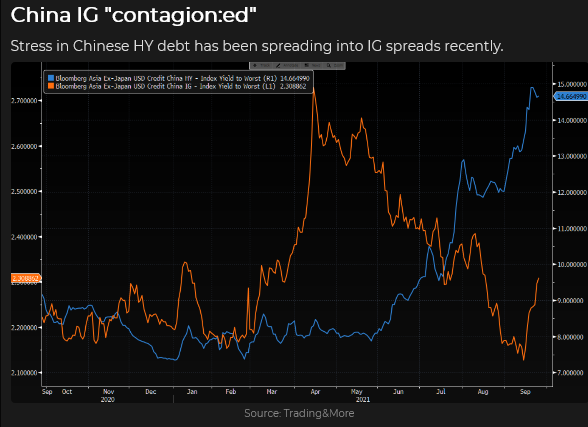
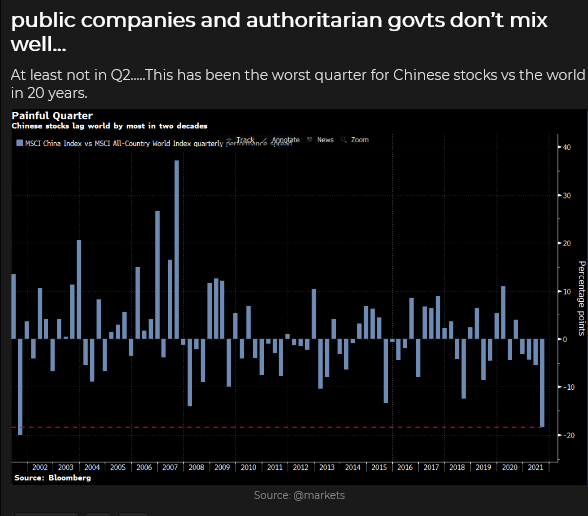
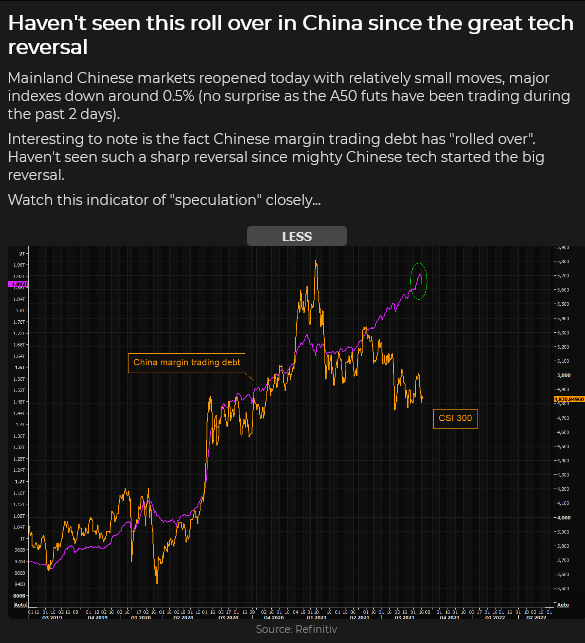
Dramatic changes in Chinese government policies have added to bearish stock market sentiment
Under the banner of “Common prosperity for all,” Xi Jinping is reshaping the social order in China and (please forgive my cynicism) ensuring his position as the Great Leader. Tech shares have tumbled, property shares have wobbled, but the government seems intent on policy compliance.
Widespread energy shortages in China are dampening economic growth to the point where the government this week ordered energy providers to “secure supplies at all costs.”
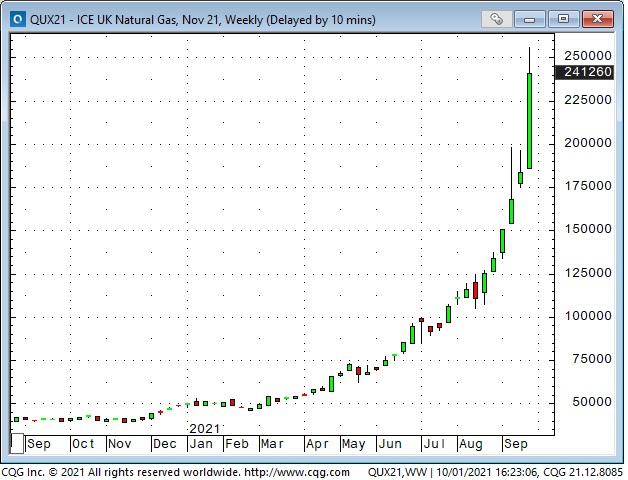
Transitioning to Green Energy will be bumpy
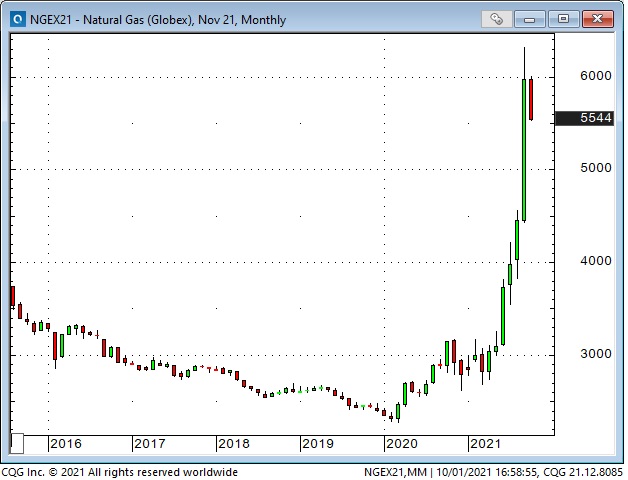
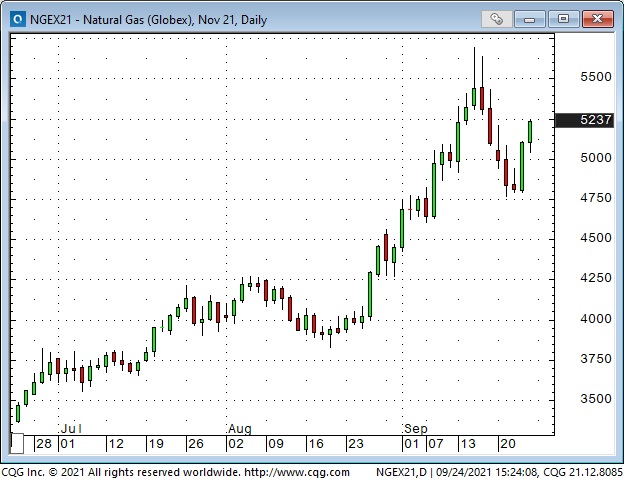
Nat Gas prices in the UK and Europe have been soaring. Inventories are low ahead of the upcoming winter heating season. Electricity prices across Europe are at record highs.
New York Nat gas registered the highest monthly close in September since November 2008.
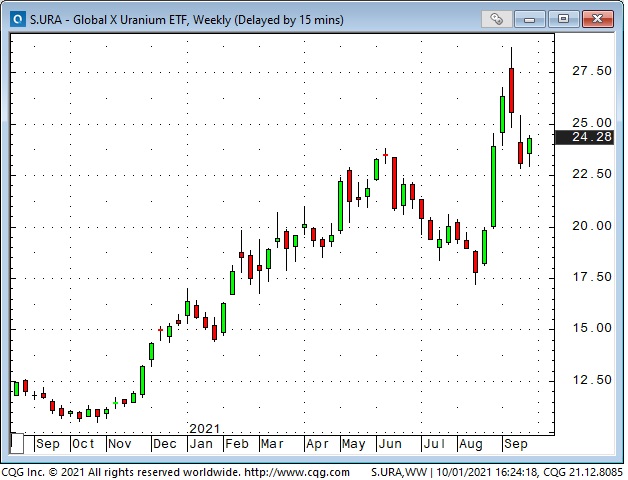
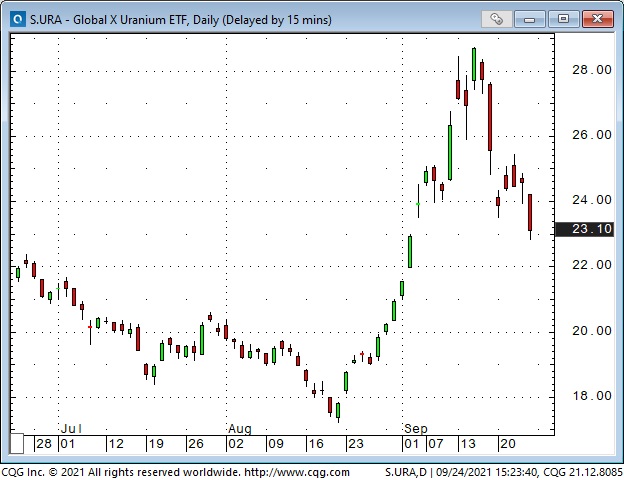
The uranium ETF traded at a 7-year high.
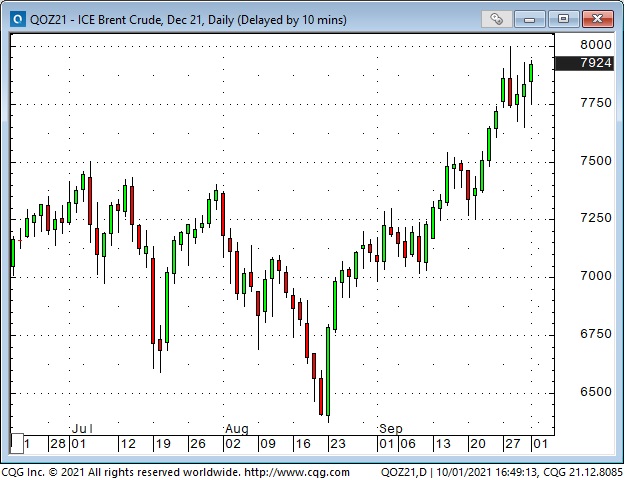
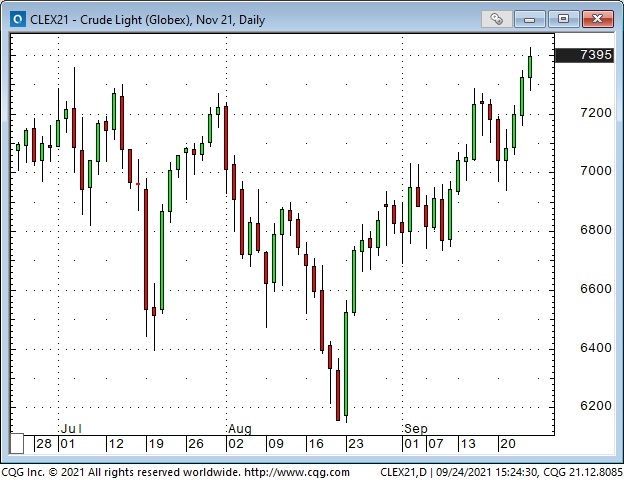
Brent crude traded above $80 for the first time in three years.
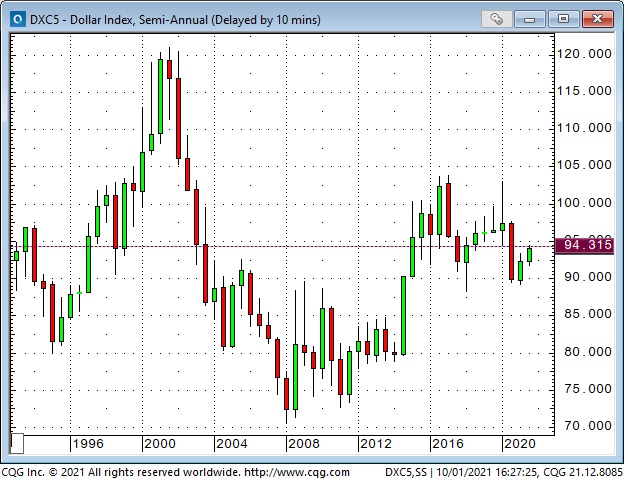
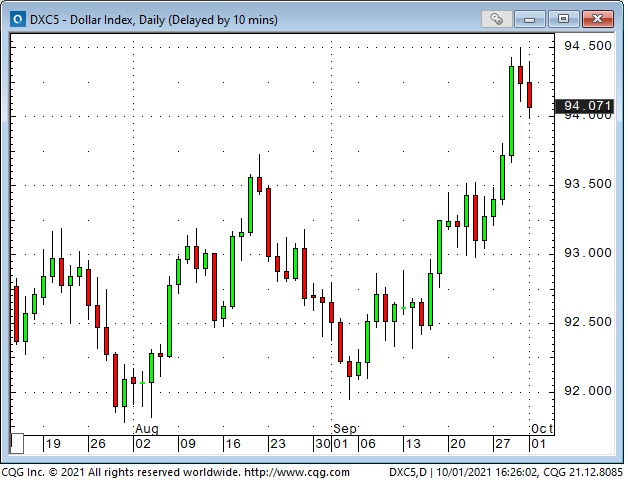
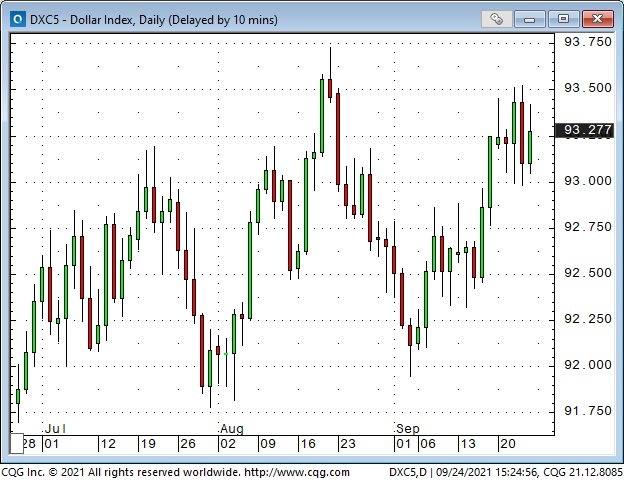
The US Dollar ended September at a 15-month high
I’ve (generally) been bullish on the USD since its “inflection point” the first week of January when the mob stormed the Capitol Building. The USD has rallied ~6% since those January lows and is now near the mid-point of its 20-year trading range.
The USD has been trending higher in September as the stock market has been falling. These are two sides of the same risk-off coin.
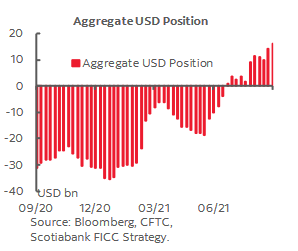
Over the past 12 weeks, speculators have gone from (marginally) net short the USD to long ~$16Billlion as of Sept 28. This is the largest spec net long position since the Covid panic of Feb/March 2020.
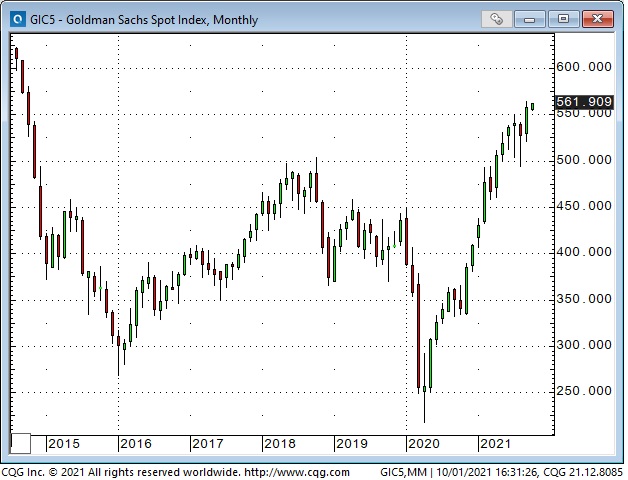
The broad commodity indices have had a great run from last year’s lows
The leading commodity indices hit 20-year lows in April 2020 following a brutal bear market from the 2011 highs. Since last year’s lows, the energy sector has been the best performing sector, but all sectors have had a substantial advance driven by supply/demand imbalances.
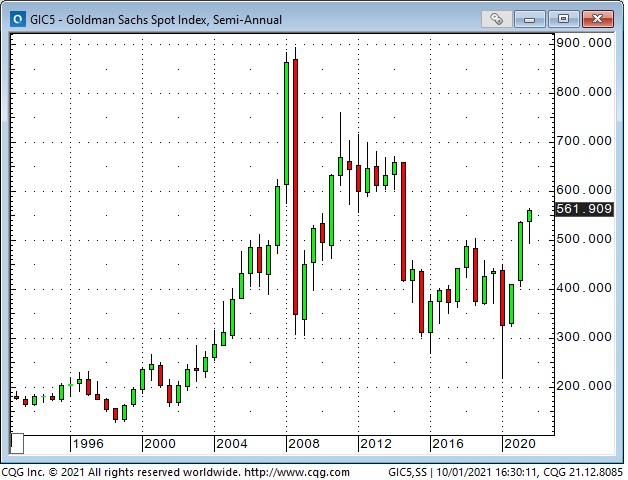
The Goldman Sacs broad commodity index (with a heavy energy weighting) is up ~160% from last year’s lows, while the CRB Index is up ~120%.
My short term trading
I started this week flat. Last week, in the On My Radar section, I wrote that I thought the bounce in the stock indices might have been “reflexive” and that if the rally rolled over, “I would be looking for opportunities to short stock indices, buy the USD, and I might even buy bonds!“
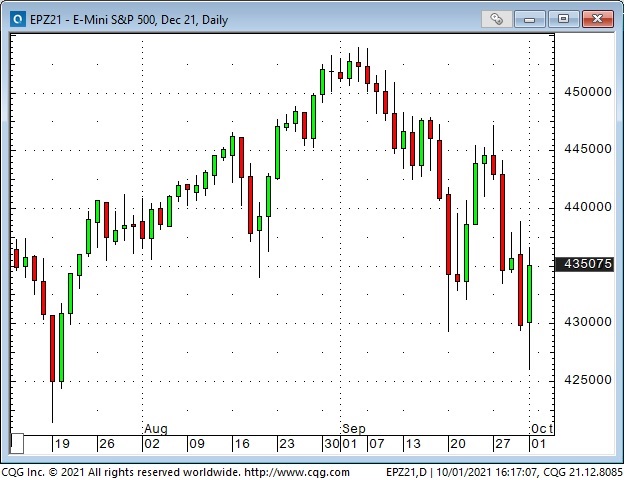
The S+P initially traded higher Sunday night but rolled over such that the Monday day session opened slightly lower than Friday’s strong close. I shorted the market at 4432 (circled) during the Monday day session with a stop just above Friday’s high. The market fell overnight and tumbled hard on the opening of the Tuesday day session. With little follow-through to the weak opening, I covered my short at 4355 (circled) for a gain of ~80 points.
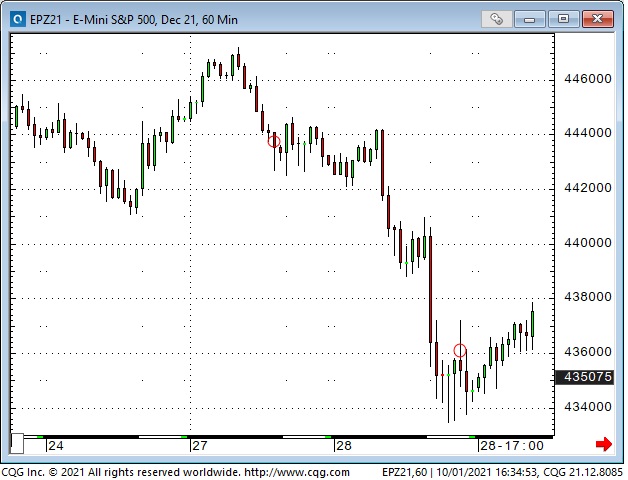
I did not buy the USD, and I did not buy bonds.
On Monday, I bought 74 cent strike long-dated Australian Dollar calls with the AUD trading near 73 cents. The AUD trade was counter to the bearish thinking that got me short of the S+P, so I saw it as a bit of a hedge. The AUD calls had much less net risk than the S+P futures, so I was heavy “net” risk-off.
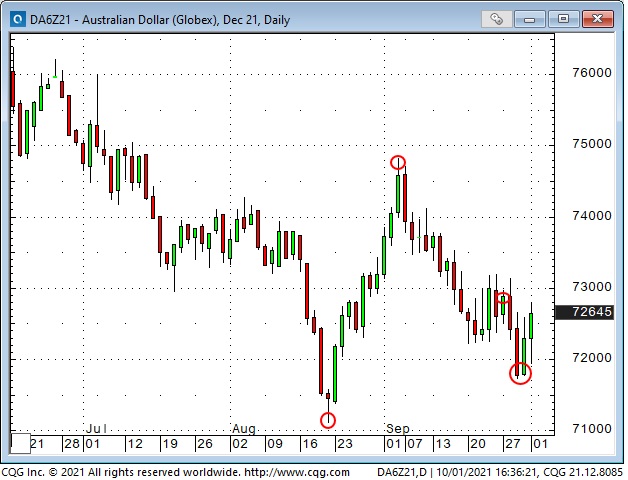
Since early summer, speculators have been aggressively building their net bearish AUD position and are currently holding a record-sized short position. My thinking was that if the AUD rallied above 7325-50 (without first taking out the August lows) that some of those spec shorts might start to cover their positions and drive AUD higher.
Note the low pivot point (circled) on August 19. That date was a Key Turn Date for several markets, including an interim high for the USD. Early September, the next circled date, was a temporary low for the USD and a high for the S+P. For the past few months, the AUD has traded in line with the S+P and opposite to the USD.
The long AUD calls were my only position at the end of the week, and they were slightly underwater. My P+L was up ~0.8% on the week.
My trading was subdued this week because I knew I would be away from my desk and unable to monitor markets for about 14 hours mid-week. My wife and I visited a small remote town to pick a puppy from a newborn litter. Barney will come to live with us in mid-November after spending eight weeks with his mother. Photo below.
On my radar
As noted above, Q4 has typically been the strongest quarter of the year for the major stock market indices for the past 35 years. After making new lows, the strong rebound on Friday may be the start of another leg in the rally. I may be a buyer if the strength continues into next week.
Biden will have to soon decide about re-appointing Powell. If he does not re-appoint Powell, then the next Fed Chair will be even more dovish, which will not be good news for the USD but will be good news for gold. The stock market will probably embrace an even more dovish Fed Chair.
The drama around the energy markets “feels” overdone, short-term, but is probably only a taste of the difficulties that will be encountered during the multi-year government-inspired transition from fossil fuels to green energy.
The surge in the commodity indices also “feels” overdone, short-term. The supply-chain dislocations and shortages are undoubtedly real, but, as always, the question is, “How much is in the price?”
Thoughts on trading
For the past 20 years or so I’ve jotted down brief notes or quotes about trading in a special notebook. The Denise Shull quote that I used in last week’s Notes is the latest entry in my notebook.
I’ve probably got enough “material” in my notebook to write a book, so I’ll start sharing some of those nuggets in this space every week. The point in doing that will be to inspire my readers to think twice about some of the ideas – and maybe they will be better traders as a result. So here we go:
“Wall Street’s job is to sell people things they should not buy. Like “short volatility.” Michael Lewitt – the Credit Strategist – February 2018
“Volatility will remain low as long as interest rates remain low. I can’t argue with that.” JMP Clarke 2018 (Jim and I had been discussing how option vol was lower than it otherwise would be – because so many people were selling vol to “earn income” in a low-interest rate, reaching-for-yield world. We agreed that few of those people had any idea of their risk exposure.)
“Nobody gets paid for originality – you get paid for making money.” Christan Siva-Jothy – Prop Trader – Inside the House of Money 2005
“Every day, I assume every position I have is wrong.” PT Jones Market Wizards 1989
“When a market is going down, you have no idea how far down is.” Dennis Gartman, 1990’s
“I’ve never thought in terms of beating a benchmark. If I used a benchmark, and I was down, but not as much as my benchmark, I would not see that as a “win.” I know most money managers use benchmarks, but, for me, Absolute Returns are the only real measure of performance.” Victor Adair, 2005
“Nobody ever thanks you for not taking a holiday.” Peter Appleby 2008

Subscribe: You have free access to everything on this site. Subscribers receive an email alert when I post something new – usually 4 to 6 times a month.
Victor Adair retired from the Canadian brokerage business in 2020 after 44 years and is no longer licensed to provide investment advice. Therefore, this blog, and everything else on this website, is not intended to be investment advice for anyone about anything.
Each week Josef Schachter will give you his insights into global events, price forecasts and the fundamentals of the energy sector. Josef offers a twice monthly Black Gold (SER) newsletter covering the general energy market and 30 energy, energy service and pipeline & infrastructure companies with regular updates. We also hold quarterly webinars and provide Action BUY and SELL Alerts for paid subscribers. Learn more.
EIA Weekly Data: The EIA data on Wednesday September 29th surprised energy bulls with increases in Commercial Crude OIl Stocks of 4.6Mb (forecast was for a decline of 2.5Mb), an increase in Total Stocks of 10.9Mb (excluding SPR changes), an increase in US crude production of 500Kb/d as Offshore US crude production (recovers post the hurricanes), and Total Demand fell by 754Kb/d to 20.4Mb. We have been highlighting these potentials over the last number of issues and they all are now occurring. This should put a cold shower on the crude oil bulls and drive crude prices down below US$70/b in the near future to below US$60/b as we have been forecasting.
In detail:
- Last week 500Kb/d came back on and overall US production is now 11.1Mb/d, just below the 11.5Mb/d produced before the first hurricane closed offshore production. There are still 400Kb/d to come back on stream. Some of the production, approximately around 200-250Kb/d, may take some time to return as Shell announced that major infrastructure repairs are needed.
- Commercial Crude Oil Stocks rose by 4.6Mb on the week and would have risen by 870Kb more if not for net exports falling by 124Kb/d. Gasoline Inventories rose by 0.2Mb and Refinery Activity rose 0.6 points to 88.1% from 87.5%, as Gulf Coast refineries increased activity. This is now above pre-pandemic levels of 86.4%, this time in 2019. In the coming months we expect to see US crude oil production rising and reaching 12.0Mb/d as the drilling pace picks up sharply and much of the remaining shut in offshore production returns.
- Demand for all products fell last week. Total Product Demand fell 754Kb/d to 20.4Mb/d as consumption of propane and other oils fell. This compares to 21.2Mb/d consumed at this time in 2019 before the pandemic. Gasoline consumption picked up 502Kb/d to 9.4Mb/d (same as in 2019 at this time) while Jet Fuel Consumption fell 60Kb/d to 1.43Mb/d (1.5Mb/d consumed in 2019 at this time). Cushing Inventories rose by 0.2Mb/d to 34.0Mb compared to 56.1Mb last year and 40.7Mb two years ago.
This was a very bearish report and as we see more seasonal inventory builds in the coming weeks crude oil should fall over US$10/b during Q4/21.
Baker Hughes Rig Data: The data for the week ending September 24th showed the US rig count rose by nine rigs (rose nine rigs in the prior week). Of the total of 521 rigs working last week, 421 were drilling for oil and the rest were focused on natural gas activity. This overall US rig count is up 100% from 261 rigs working a year ago. The US oil rig count is up 130% from 183 rigs last year at this time. The natural gas rig count is up a more modest 32% from last year’s 75 rigs, now at 99 rigs. The Permian saw an increase of one rig (up five last week) to 260 rigs and is up 108% from 125 rigs last year at this time.
Canada had a rise of eight rigs (up 11 rigs in the prior week) to 162 rigs. Canadian activity is now up 128% from 71 rigs last year. There were 96 oil rigs working last week, up from 33 last year. There are 65 rigs working on natural gas projects now, up from 38 last year.
The material increase in rig activity over a year ago in both the US and Canada should continue to translate into rising liquids and gas production over the coming months once the impact of the hurricane/storm season is over. The data from the many companies and their plans for the rest of 2021 and forecasts for 2022 support this rising production profile expectation.
Conclusion:
We should see weaker crude oil consumption reports and weekly builds in Commercial Crude Stocks around the world as inventories rebuild to meet the winter 2021-2022 needs. Normal fall season builds are 2-3Mb per week. If we see any increases over 5Mb in any week, that would put meaningful downward pressure on crude prices. The current spike in prices was speculative in nature and is not sustainable. Bulls may see this week as an aberration but if we see repeats of builds and strong builds over 2-3Mb/week, then crude prices are very vulnerable. Just remember how Lumber rose from US$441 in October to US$1733 in May 2021 and then fell to US$448 in August when demand waned as high prices killed off demand.
Bearish pressure on crude prices:
- The Mu variant is following the deadly Delta variant and is gaining victims around the world. This variant started in Colombia and now is impacting 39% of all people infected with the pandemic disease. This variant is now seen in more than 40 countries and in 49 US States. A London immunologist at the Imperial College in London says “that the early research indicates it appears to be highly effective at evading immunity”. Delta caseloads are growing around the world. Just note the challenges faced in Alberta. Formal vaccine documents are to be the norm in Canada going forward. In the US the death rate is now back over 2,000/day and over 688K deaths have been reported. Worldwide the death count is now 4.75M.
- The Saudis are pricing crude oil for October delivery to Asia at US$1/b lower than previous months, as the fight for market share in the patchy economies in the area continues. China demand is especially sloppy. China plans on selling 7.4Mb from their state crude reserves on September 24th to cool off prices. Russia has announced that they plan on adding nearly 7% in additional production in 2022. OPEC meets next Monday (October 4th) and plans to approve their 400Kb/d increase in production for November. However major consuming nations are pressuring them to increase production even further as high prices are negatively impacting their economies. The King and Crown Prince are being pressured to increase production by the Presidents of the US and China and we don’t see the Saudis ignoring this pressure. OPEC countries like Saudi Arabia, Iraq, Kuwait and the UAE together could add 3-4Mb/d quite quickly if they want to.
Bullish pressure on crude prices:
- Forest fires and the lack of wind in the North Sea and other areas have crippled wind power from onshore and offshore facilities, cutting off much of this renewable electricity supply. This has driven natural gas prices to over US$20/mcf in Europe and over US$30/mcf in parts of Asia (NYMEX today US$5.62/mcf – AECO C$2.48/mcf). Prices for natural gas should drift over the near term but should exceed recent highs if this winter is colder than normal and storage is low. Goldman Sachs sees Brent rising another US$10/b in Q4/21 to US$90/b.
- Some OPEC countries like Nigeria, Libya and the Congo are having problems keeping crude oil production up due to their lack of funding for operations.
- The UK has a shortage of energy product delivery drivers and is now opening its border to 5,000 EU accredited individuals. In addition they plan on utilizing the military logistics system to increase deliveries. Hoarding has occurred as people worry about running out of fuel for their vehicles. Recently a purchase limit of 30 pounds worth of petrol has been implemented by many petrol stations.
- Russia has held back supplies of natural gas to Europe as they pressure Germany to open the new NordStream 2 pipeline. The Greens and the Free Democrats, planning to join the new Government, are against the project. Opening the pipeline should end the shortage of natural gas on the continent. Once the political maneuvering is over this should start up.
CONCLUSION:
WTI has risen to US$75.48/b due to the rising price of natural gas, the shortage of electricity in many OECD and developing countries, and massive speculative interest. It appears that high prices again are the solution for high prices as was seen in Q2/08 when crude spiked to US$147/b and then fell to US$34/b in Q1/09, and in April 2020 when prices went negative and ended the rout in crude prices, recovering to US$42/b just a few months later. Many industrial plants in China have been closed due to the high cost of fuel and the Government’s plan to lower emissions in the Beijing area for the upcoming winter Olympics from February 4th to the 20th. Clean air is needed for the event and China wants to show it is making progress on its climate initiatives. This will dampen China’s consumption of fossil fuels going forward. Supplier plants producing items for Apple and TESLA have suspended production. Supply chain issues are getting worse.
A breach of US$70/b is likely before the end of October. The health of the largest world economic zones (the US, China and the EU) and how large the seasonal crude oil storage builds are will impact how much crude prices will retreat. During Q4/21 we see WTI prices breaching US$60/b. This may sound heretical to energy bulls but just remember that the pendulum does swing and that inflection point is here now. Proof is evident from today’s EIA report.
Energy Stock Market: The S&P/TSX Energy Index currently trades at 144 as natural gas stocks rose sharply over the last week following the whirlwind of gaping natural gas prices in the spot market.
We expect that as crude oil prices decline, the recent low for the Energy Index at 109.72 will be breached. The key level to watch is US$61.74/b. If this occurs in Q4/21 then the Energy Index should head towards 100. We recommend caution, lowering exposure and holding cash for the next low risk entry point. The energy and energy service companies with the most downside are those with stretched balance sheets and have missed production, revenue or EBITDA forecasts. Take profits on decent up days and raise cash.
Subscribe to the Schachter Energy Report (SER) and receive access to our two monthly reports, all archives, Webinars, Action Alerts, TOP PICK recommendations when the next BUY signal occurs, as well as our Quality Scoring System review of the 30 companies that we cover. We go over the markets in much more detail and highlight individual companies’ financial results in our reports. Our October Interim Report comes out on Thursday October 7th and covers the weakening general stock market and its expected impact on the energy sector.
The Evergrande Chinese property developer insolvency problem appears to be the catalyst for the overall stock market decline in China and many other countries around the world. The US$305B of debts that they can’t pay has large portions owed to foreign investors and lenders. Interest payments due last week were not paid and after the 30 day grace period is over it will push the entity into bankruptcy or Beijing controlled restructuring. The size of this problem is massive as they were building 1.6M apartments and homes that they don’t have funds to finish and as well, have taken large deposits from buyers. Protests at company offices are picking up by irate home buyers and suppliers. In any year they employ over 3M people in their construction activities and directly employ over 200,000 people. This could spiral out of control and become the ‘Lehman’ event to start a new financial crisis. Banks and other financial institutions as well as local governments are very vulnerable. Beijing is in the process of setting up protective barriers to contain the damage this could do to the real estate wealth focus of the country.
Other market pressures are the debt ceiling battle in the US, rising bond yields which lower the value of the stream of earnings, the problem of Congress’s approval of the two stimulus bills and the planned 40 new or increased taxes to pay for the social infrastructure’s US$3.5T price tag. This is very politically tough as the Republicans won’t support the social infrastructure Biden proposal and some Democrats are also opposed. Liberals and progressives want a bigger package and moderates want to see it lower and paid for. The next few weeks could see defeats which could rock the financial markets.
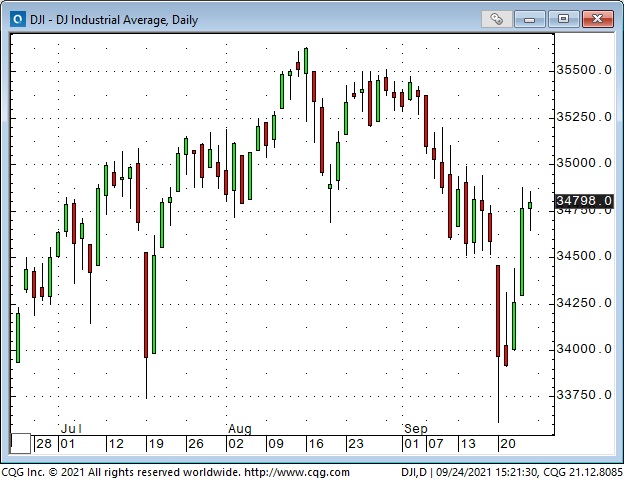
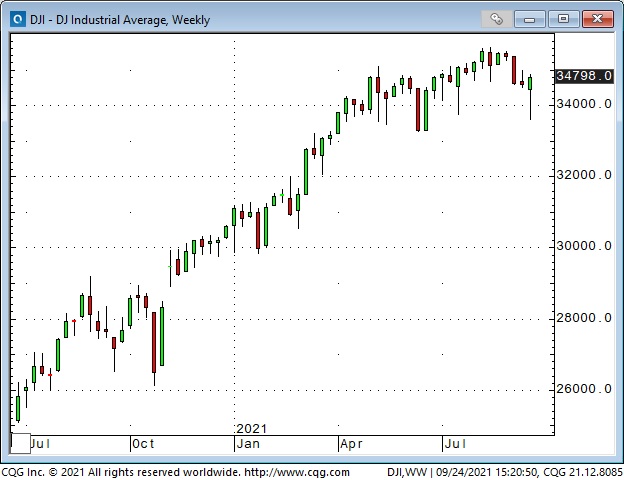
We cover this in detail in our Schachter Energy Report. Over the next few months any of these events could lead to a domino effect of over leveraged companies getting into trouble and financial markets declining materially. The Dow Jones Industrials Index now at 34,460 could fall to below 30,000 in Q4/21 and to <25,000 in Q1/22. We have already seen two big down days of more than 500 points for the Dow Jones Industrials Index and expect many more in the coming months. Yesterday the Dow fell 1.6% or 569 points while the overvalued NASDAQ fell 2.8% or 423 points.
If you want to receive ongoing coverage of this possibility, become an SER quarterly or annual subscriber. For new people, the quarterly offering is a good way to peruse our product before you determine which subscription format makes the most sense for your needs.
If you want access to all our SER reports then you will need to become a subscriber. Go to https://bit.ly/34iKcRt to subscribe.
If you enjoy reading our weekly ‘Eye on Energy’ feel free to forward it off to friends and colleagues. We always welcome new subscribers to our complimentary macro energy newsletter.
Evergrande Monday
The Dow Jones futures contract dropped >1,300 points from last Friday’s highs to Monday’s lows and then rallied back > 1,300 points to Thursday’s highs – a ~2,600 point round trip in five trading sessions.
Here’s my take: The leading stock indices had rallied >100% from the March 2020 lows without so much as a 5% correction since October 2020. Monetary and fiscal stimulus had been the principal drivers of the rally; the rally was showing many signs of speculative excess, and any “catalyst” could trigger a correction. Looking ahead, the market could see that the Fed was going to start “taking away the punch bowl” (even if only a spoonful at a time), and the increasingly dysfunctional environment in Washington meant that fiscal stimulus was going to be scaled back. (Fiscal fatigue, as my friend Kevin Muir, calls it.)
In August, I wondered if developments in China would be contagious, but North American markets seemed “complacent,” with stock indices inching higher and higher while volatility metrics were near multi-year lows.
Last week I wrote: “The answer (to the contagious question) appeared to be “No,” in August, but now that the “stress” of September has arrived, the answer might be, “Yes, but with a delay.”
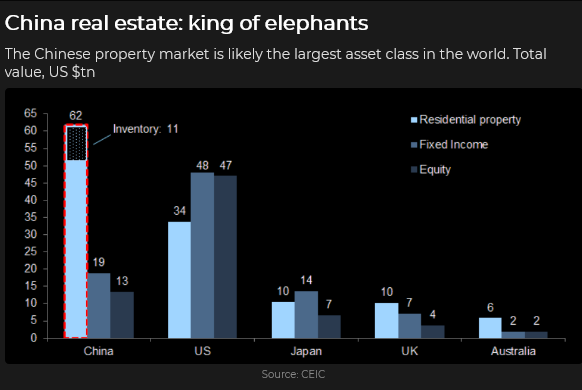
It was easy to imagine contagion within the over-levered Chinese real estate market, especially considering the recent “anti-capitalist” bend of the CCP (“homes are for living in – not for speculation”). It was also not difficult to imaging that contagion within China could trigger corrections in other markets.
The critical question seems to be, “What will the CCP do?” They are reshaping Chinese society (“common prosperity for all”) and seem more concerned with policy compliance than short-term market reactions. I expect more companies will “fail” with executives arrested, but I do not expect the CCP will allow chaos.
The market seems to have drawn the same conclusion (as Evergrande moved from a page 16 story in August to a front-page feature on Monday) and has bounced back from the lows.
What’s next?
The stock indices have historically been weak in September (especially the 2nd half), and then they rally into year-end. That may happen, but I can also imagine that the decline from the early September All-Time highs is only the first leg of a more significant correction.
An alternative view to the seasonal norm would be that this week’s rally has been a “reflexive” bounce from a market that is “used to” going up and that if it rolls over without making new highs and takes out this week’s lows, a deeper correction may develop.
Interest rates
As the S+P futures plunged ~180 points from last Friday’s highs to this Monday’s lows, Treasury bonds barely moved – they stayed inside the relatively narrow range they’ve been in since mid-July. I thought that was curious. Where was the “haven” bid for bonds when the stock market was in free fall? Even the Japanese Yen was getting a little “haven” bid.
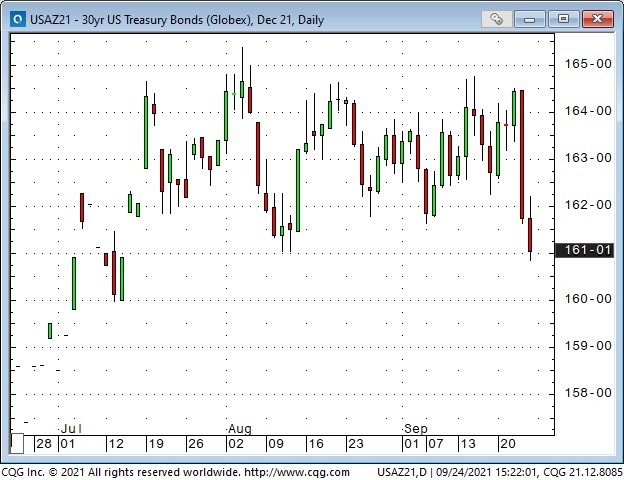
Then the bonds rallied on Wednesday following what seemed to be a hawkish tilt from the Fed. I was genuinely perplexed. But bonds sold off hard on Thursday and Friday.
Not only were nominal yields rising, but real yields were also rising.
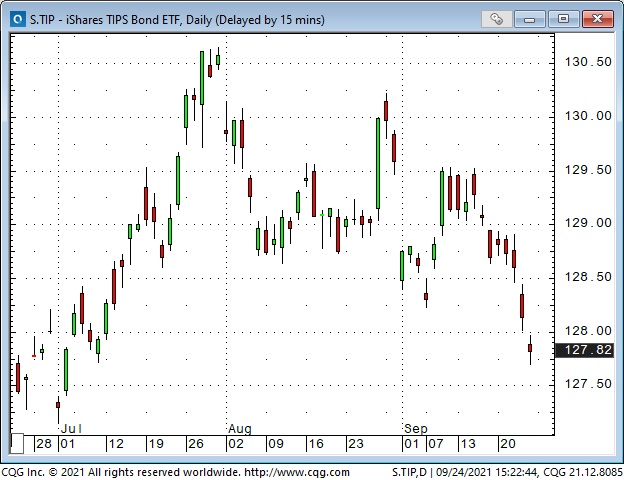
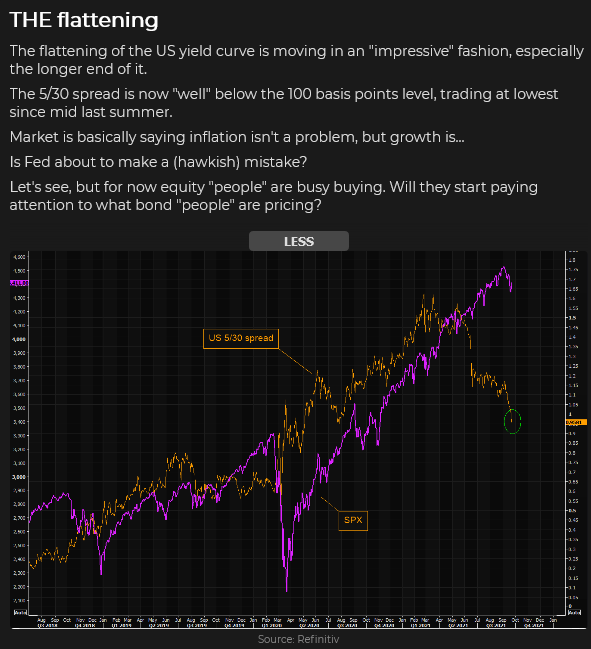
The yield curve has been flattening (don’t worry about inflation, the economy is slowing?)
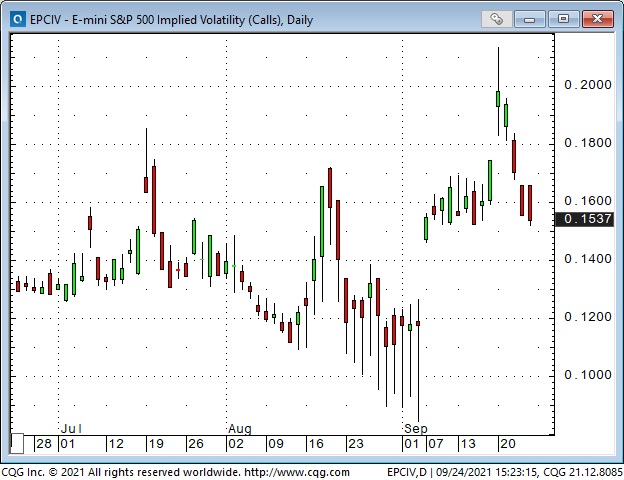
volatility spike
I think of the S+P futures market as the best barometer for market risk on/off sentiment, but I also watch several different volatility metrics. S+P Vol gapped higher as markets got “back to work” after Labor day, then jumped to a 4-month high on Evergrande Monday, only to quickly retreat as the stock market rallied Tuesday through Friday.
Energy
Uranium prices have corrected after their sharp rally, New York Nat Gas has backed off from its highs, but crude oil and gasoline are aggressively bid.
Currencies
The US Dollar has sustained its rally from early September – especially against European currencies and the Yen.
The Canadian Dollar: strength/weakness in the S+P often impacts the CAD – this week, the CAD traded almost tick-for-tick with S+P futures. The relative strength/weakness of the USD Vs. other currencies also affects the CAD – but this week, as the USD was steady, the CAD rallied against most other currencies, perhaps because the commodity indices rallied to fresh 7-year highs – with a big boost coming from energy prices.
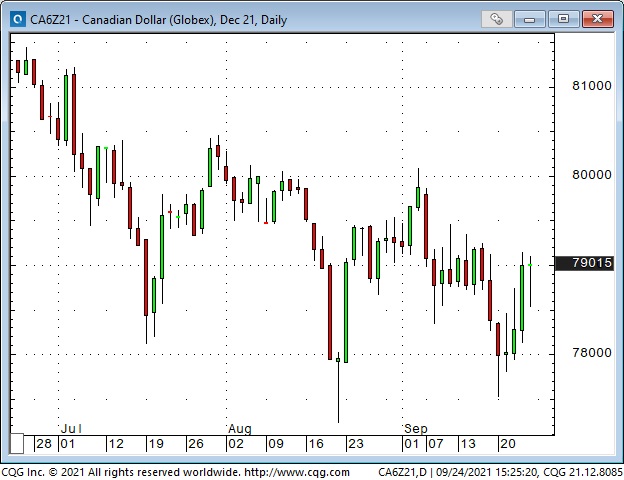
The Commitments of Traders report issued by the CFTC on Friday after the close (based on Tuesday, Sept 21 data ) shows the net long USD position to be the largest since Q1 2020. Large speculators were the shortest CAD they have been in over a year (remember they were hugely long in mid-June just after the CAD hit a 6-year high.) The AUD has a record net short position.
My short term trading
I started the week with a net short CAD position (short futures and short OTM puts.) I had been unable to bring myself to sell S+P futures in the hole the previous Friday but thought that the CAD would drop if the S+P kept falling.
The CAD tumbled with the S+P on Monday, and I wrote deeper OTM puts against my futures position. That was the high point of the week as far as my unrealized gains were concerned.
Monday evening (Pacific Time), I realized that I had a risk management problem. There was “no market” for my options. I had lowered the stop on my short futures position, but if the stop was hit, I would be net long the CAD (due to the short options) – with no way to cover them.
Sometime after midnight (as the European markets opened), bids and offers appeared in the CAD options – but the bid/offer spreads were WIDE and implied Vol had jumped – sharply increasing the prices of the options I was short. Mama Mia!
I covered all my CAD positions Tuesday and made a little money on the trade. By then, I had the idea that the panic that had caused the sharp sell-off on Monday had run its course, and I started buying Dow and S+P futures. I had my stops too tight and took small losses.
As much as I was right on my idea that the panic was over, I lost money buying the indices because the intra-day price swings were so much bigger and faster than they had been before the panic – and I couldn’t adjust how wide I needed to place my stops.
At the end of the week, my net P+L on realized trades was flat. I had come into the week bearish; the market had dropped, I had changed to bullish, the market had rallied, and, net, I didn’t make any money. Have I ever told you that trading is not a game of perfect? I ended the week flat.
On my radar
I think there has been a change in market psychology. As noted above, this week’s rally from Monday’s lows might have been reflexive. If the market rolls over and, especially if it takes out this week’s lows, I would be looking for opportunities to short stock indices, buy the USD, and I might even buy bonds!
Thoughts on trading
My trading time horizon got too short this week. My sweet spot is more of a swing trading time frame – a few days to a few weeks. I had experimented with shorter-term time frames where I would enter a market close to the point where I would stop myself out – using only price action to make trading decisions. (No supply/demand analysis etc.) I thought this would likely generate lots of small losses with occasional big wins. It probably works well for some people, but it doesn’t seem to suit me.
Finding the right time frame (that suits you) is one of the most important things for a trader. I don’t think all of my trading has to happen within the same time frame – the market doesn’t always move at the same speed – but I think there has to be a “pace” to my trading that allows for reflection – not just intuition.
I’ll wrap up this week’s Notes with a quote from Denise Shull’s recent interview on RTV. She runs the ReThink Group, providing performance coaching for traders and professional athletes. She said, “People think they make decisions based upon their analysis – but actually, they make decisions based upon how they “feel” about their analysis.”
Subscribe: You have free access to everything on this site. Subscribers receive an email alert when I post something new – usually 4 to 6 times a month.
Victor Adair retired from the Canadian brokerage business in 2020 after 44 years and is no longer licensed to provide investment advice. Therefore, this blog, and everything else on this website, is not intended to be investment advice for anyone about anything.
Each week Josef Schachter will give you his insights into global events, price forecasts and the fundamentals of the energy sector. Josef offers a twice monthly Black Gold (SER) newsletter covering the general energy market and 30 energy, energy service and pipeline & infrastructure companies with regular updates. We hold quarterly subscriber webinars and provide Action BUY and SELL Alerts for paid subscribers. Learn more.
EIA Weekly Data: The EIA data on Wednesday September 22nd highlighted the continued return of US offshore production. Last week 500Kb/d came back on and overall US production is now 10.6Mb/d. There are still 900Kb/d to come back on stream to get back to the 11.5Mb/d of overall US crude production from before the hurricane season started. Some of the production, 200-250Kb/d, may take some time to return as Shell announced that major infrastructure repairs are needed. Commercial Crude Oil Stocks fell 3.5Mb on the week, below the fear number of a 6Mb decline. US exports rose 185Kb/d, or by 1.3Mb last week impacting the crude stock inventory. Gasoline Inventories rose by 3.5Mb as Refinery activity rose 5.4 points to 87.5% from 82.1%, as Gulf Coast refineries increased activity. We expect to see US crude oil production rising and reaching 12.0Mb/d before year end as the drilling pace picks up sharply and most of the remaining shut in offshore production returns.
Demand for all products rose last week. Total Product Demand lifted 1.23Mb/d to 21.1Mb/d as consumption of distillates and propane rose. Gasoline consumption picked up only a modest 4Kb/d to 8.9Mb/d while Jet Fuel Consumption rose by 111Kb/d to 1.49Mb/d. Cushing Inventories fell last week by 1.5Mb to 33.8Mb compared to 54.3Mb last year and 40.9Mb two years ago.
Baker Hughes Rig Data: The data for the week ending September 17th showed the US rig count rose by nine rigs (rose six rigs in the prior week). Of the total of 512 rigs working last week, 411 were drilling for oil and the rest were focused on natural gas activity. This overall US rig count is up 101% from 255 rigs working a year ago. The US oil rig count is up 130% from 179 rigs last year at this time. The natural gas rig count is up a more modest 37% from last year’s 73 rigs at 100 rigs. The Permian saw an increase of five rigs to 259 rigs and is up 111% from 123 rigs last year at this time.
Canada had a rise of 11 rigs (down nine the prior week) to 154 rigs. Canadian activity is now up 140% from 64 rigs last year. There were 95 oil rigs working last week, up from 30 last year. There are 59 rigs working on natural gas projects now, up from 34 last year.
The material increase in rig activity over a year ago in both the US and Canada should continue to translate into rising liquids and gas production over the coming months once the impact of the hurricane/storm season is over. The data from the many companies that reported Q2/21 results and their plans for the second half of 2021 support this rising production profile expectation.
Conclusion:
Now that the summer driving season is over, we should soon see weaker crude oil consumption and weekly builds in Commercial Crude Stocks around the world as inventories rebuild to meet the winter 2021-2022 needs. Normal fall season builds are 2-3Mb per week but if we see any increases over 5Mb in any week, that would put meaningful downward pressure on crude prices. The current spike in prices is speculative in nature and is not sustainable in our view.
Bearish pressure on crude prices:
- The Mu Variant is spreading around the world. This variant started in Colombia and now is impacting 39% of all people infected with the pandemic disease. This variant is now seen in more than 40 countries and in 49 US States. A London immunologist at the Imperial College in London says “that the early research indicates it appears to be highly effective at evading immunity”. Delta caseloads are growing around the world. Just note the challenges faced in Alberta. Formal QR code vaccine passports are to be the norm in Canada going forward.
- The Saudis are pricing crude oil for October delivery to Asia at US$1/b lower than previous months, as the fight for market share in the patchy economies in the area continues. China demand is especially sloppy. China plans on selling 7.4Mb from their state crude reserves on September 24th to cool off prices. Russia has announced that they plan on adding nearly 7% in additional production in 2022.
Bullish pressure on crude prices:
- Hurricanes, extreme heat waves, forest fires, crippling droughts and shortage of electricity for air conditioning across the US and Canada, are all aiding consumption of natural gas. It is a big beneficiary of this increase in electricity demand as hydro has, in many cases, low water levels. NYMEX natural gas prices have backed off and are now at US$4.83/mcf as air-conditioning demand wanes. AECO prices have taken a two for one sale to C$2.02/mcf but still attractive for this time of year. Prices for natural gas should continue to drift over the near term but should exceed recent highs this winter.
- Some OPEC countries like Nigeria, Libya and the Congo are having problems keeping crude oil production up due to their lack of funding for operations.
CONCLUSION:
WTI has fallen over the last week from a high of US$73.14/b to US$71.49/b as US offshore production has returned and mixed economic news has come out of the two largest energy consumers; the US and China. With more US offshore production expected to return in the coming weeks and significant new crude oil wells coming on from the active drilling in the shale basins, we see US production reaching 12.0Mb/d before year end. A breach of US$70/b is likely before the end of this month. October is likely to be a nasty month for prices depending upon the health of the largest world economic zones (the US, China and the EU) and how large the seasonal crude oil storage builds are. During Q4/21 we see WTI prices breaching US$60/b.
Energy Stock Market: The S&P/TSX Energy Index currently trades at 132, down slightly on the week. We expect that as crude prices decline the recent low for the Energy Index at 109.72, will be breached. The key breach level is US$61.74/b and the Energy Index should head towards 100.
When, not if, WTI breaks US$60/b, the S&P/TSX Energy Index is likely to breach 80 resulting in a painful 45% decline from the peak in mid-June. Over-invested bulls are likely to get hurt pretty badly. We recommend caution and holding cash for the next low risk entry point on that portion of one’s portfolio which is energy focused. The energy and energy service companies with the most downside are those with stretched balance sheets and have missed production, revenue or EBITDA forecasts. Take profits on decent up days and raise cash.
Subscribe to the Schachter Energy Report (SER) and receive access to our two monthly reports, all archives, Webinars, Action Alerts, TOP PICK recommendations when the next BUY signal occurs, as well as our Quality Scoring System review of the 30 companies that we cover. We go over the markets in much more detail and highlight individual companies’ financial results in our reports. Our September SER Monthly Report comes out tomorrow Thursday September 23rd and covers the weakening general stock market.
The Evergrande Chinese property developer insolvency problem could be the catalyst for the expected decline we see ahead. They have over US$300B of debts that they can’t pay and large portions are owed to foreign investors and lenders. Near term interest payments if not paid later this week could push the entity into bankruptcy or Beijing controlled restructuring. The size of this problem is massive as they are building 1.6M apartments and homes that they don’t have funds to finish and as well, have taken large deposits from buyers. Protests at company offices are picking up by irate home buyers and suppliers. In any year they employ over 3M people in their construction activities and directly employ over 200,000 people. This could spiral out of control and become the ‘Lehman’ event to start a new financial crisis. We cover this in more detail in our Schachter Energy Report. Over the next few months this could lead to a domino effect of over leveraged companies getting into trouble and financial markets declining materially. The Dow Jones Industrials Index now at 34,350 could fall to below 30,000 in Q4/21 and to <25,000 in Q1/22. If you want to receive ongoing coverage of this possibility, become an SER quarterly or annual subscriber. For new people, the quarterly offering is a good way to peruse our product before you determine which subscription format makes the most sense for your needs.
On Monday, September 20th, the Dow Jones Industrials Index fell 614 points to 33,970 as this disaster in China was prominent in the news. If more excessively debt-laden entities fail and banks and lenders take big hits, then counterparty risk could be a material problem for the markets. We do not see this as a one day event. Multiple large point declines are likely to occur in Q4/21.
If you want access to all our SER reports then you will need to become a subscriber. Go to https://bit.ly/34iKcRt to subscribe.
If you enjoy reading our weekly ‘Eye on Energy’ feel free to forward it off to friends and colleagues. We always welcome new subscribers to our complimentary macro energy newsletter.
Each week Josef Schachter will give you his insights into global events, price forecasts and the fundamentals of the energy sector. Josef offers a twice monthly Black Gold (SER) newsletter covering the general energy market and 30 energy, energy service and pipeline & infrastructure companies with regular updates. We hold quarterly subscriber webinars and provide Action BUY and SELL Alerts for paid subscribers. Learn more.
EIA Weekly Data: The EIA data on Wednesday September 15th continued to be impacted by Hurricane Ida followed by Hurricane Nicholas (now a tropical storm). Demand fell while US production only recovered 100Kb/d. Total US production was 10.1Mb/d (up 100Kb/d on the week) but is down from 11.5Mb/d, produced before the recent hurricanes. It was expected that half of the shut in offshore crude oil production would be back on by now but the continued storm season has delayed the restart. It may take into late September for the refineries and offshore production facilities to return to normal operating levels. Commercial Crude Oil Stocks fell 6.4Mb on the week versus the forecast of 3.5Mb. Gasoline Inventories fell 1.9Mb. Refinery activity rose 0.2 points to 82.1% from 81.9%, as some Gulf Coast refineries restarted. Some of the refineries still remain without electricity. We expect to see US production rising and reaching 12.0Mb/d before year end.
Demand for all products fell last week. Total Product Demand fell a modest 43Kb/d to 19.9Mb/d. Gasoline consumption fell a sharp 716Kb/d to 8.89Mb/d with Jet Fuel Consumption falling by 246Kb/d to 1.38Mb/d. Cushing Inventories fell last week by 1.1Mb to 35.3Mb compared to 54.3Mb last year and 38.7Mb two years ago.
Baker Hughes Rig Data: The data for the week ending September 10th showed the US rig count rose by six rigs (fell 11 rigs last week) as Hurricane Ida subsided and Louisiana was able to bring back four rigs. Of the total of 503 rigs working last week, 401 were drilling for oil and the rest were focused on natural gas activity. This overall US rig count is up 98% from 254 rigs working a year ago. The US oil rig count is up 123% from 180 rigs last year at this time. The natural gas rig count is up a more modest 42% from last year’s 71 rigs at 101 rigs. The Permian saw an increase of four rigs to 254 rigs and is up 105% from 124 rigs last year at this time.
Canada had a decline of nine rigs (up five rigs the prior week) to 143 rigs. Canadian activity is now up 2.75x from 52 rigs last year. There were 87 oil rigs working last week, up from 19 last year. There are 56 rigs working on natural gas projects now, up from 33 last year.
The material increase in rig activity over a year ago in both the US and Canada should continue to translate into rising liquids and gas production over the coming months once the impact of the hurricane/storm season is over. The data from the many companies that reported Q2/21 results and their plans for the second half of 2021 support this rising production profile expectation.
OPEC Monthly Oil Market Report:
The OPEC Monthly Oil Market Report for September was released on the 13th. The highlights were a 110Kb/d reduction in their forecast for demand in Q4/21 from 99.82Mb/d to 99.70Mb/d due to the Delta variant’s impact on consumption. We think this reduced forecast is still too high. Overall production rose by 151Kb/d to 26.76Mb/d with increases from Angola (43Kb/d), Iraq (90Kb/d), Saudi Arabia (69Kb/d) and UAE (55Kb/d). This was offset by production declines in Nigeria of 114Kb/d. This increase of 151Kb/d was far below the 400Kb/d that OPEC+ had promised and has added to the speculative spike in crude prices. OPEC expects demand to rise in 2022 to 100.8Mb/d from 96.7Mb/d this year. We see demand now at around 97Mb/d as the biggest consuming nations, the US and China, have weakening demand (note the weaker US demand for gasoline and jet fuel in the EIA report coverage). The OPEC forecast for 2022 is in our view, very optimistic. It assumes that there are no new waves of the pandemic or mutations that can evade the current vaccines.
Conclusion:
Now that the summer driving season is over, we are seeing weaker consumption and soon after the storm season is over there should be weekly builds in Commercial Crude Stocks around the world, as inventories build to meet the winter 2021-2022 needs. Normal fall builds are 2-3Mb per week but if we see any builds over 5Mb in any week, that would put meaningful downward pressure on crude prices. The current spike in prices is speculative in nature and is not sustainable in our view.
Bearish pressure on crude prices:
- The EU is recommending that non-essential travel to the US be halted due to the rapid rise in US caseloads. This will lower air travel and the demand for Jet Fuel, and as a result, lower crude oil prices will occur. Cancellations of passenger flights in the US have caused many US airlines to lower September capacity by 8-10%. The recent Labour Day holiday season may increase case counts in the coming weeks. Consumer Confidence in the US has fallen sharply in recent weeks. In August it fell to 113.8 from 125.1 in July and is the lowest level since February 2021. In China, retail sales grew only a very modest 2.5% (just inflationary levels not volume growth) and was below the 7% forecast. China’s construction spending fell 3.2% last month.
- The Mu Variant is spreading around the world. This variant started in Colombia and now is impacting 39% of those infected with the pandemic disease. This variant is now seen in more than 40 countries and in 49 US States. A London immunologist at the Imperial College in London says “that the early research indicates it appears to be highly effective at evading immunity”.
- The Saudis are pricing crude oil for October delivery to Asia at US$1/b lower than previous months as the fight for market share in the patchy economies in the area continues. China demand is especially sloppy. To arrest the higher prices, China plans on selling 7.4Mb from their state crude reserves on September 24th to cool off prices.
Bullish pressure on crude prices:
- Hurricane Ida and now Nicholas shuttered in most of the offshore Gulf of Mexico oil and gas production. Over 1.7Mb/d of crude was shut in, which equates to over 90% of offshore production. Only 100Kb/d has since recovered. It may take weeks for all this production to be reinstated.
- Hurricanes, extreme heat waves, forest fires, crippling droughts and shortage of electricity for air conditioning across the US and Canada are all aiding consumption of natural gas. It is a big beneficiary of this increase in electricity demand as hydro has, in many cases, low water levels. NYMEX natural gas prices are now at US$5.56/mcf. AECO prices are at an attractive C$4.66/mcf. US natural gas prices have spiked as one facility in the Gulf coast that produces LNG for export is now closed due to the storms. Russia also seems to be having production problems and their exports to Europe have suffered and prices in that market have rocketed higher.
CONCLUSION:
WTI has lifted to US$72.63/b (up US$2.17/b today) due to the continued shut-in of most of the US offshore crude production and OPEC adding less new volumes in August versus expectation. With the summer driving season over and the normal fall build season starting shortly, we expect WTI crude oil prices to reverse and go down again. We see a breach of US$60/b as likely in the next few weeks. How low we go will depend upon the health of the largest economies (the US, China and the EU) and how large the seasonal crude oil storage builds are.
Energy Stock Market: The S&P/TSX Energy Index currently trades at 133, up 5 points on the day due to the sharp increase in crude prices. We expect as crude prices reverse that the recent low for the Energy Index at 109.72, when crude fell to US$61.74/b, will be breached. Once WTI breaches US$61.74/b, we should be heading towards 100 for the Energy Index.
When, not if, in our view, WTI breaks US$60/b the S&P/TSX Energy Index is likely to breach 80 resulting in a painful 45% decline from the peak in mid-June. Over-invested bulls are likely to get hurt pretty badly. We recommend caution and holding cash for the next low risk entry point on that portion of one’s portfolio which is energy focused. The energy and energy service companies with the most downside are those with stretched balance sheets and have missed production, revenue or EBITDA forecasts. Take profits and raise cash.
Subscribe to the Schachter Energy Report (SER) and receive access to our two monthly reports, all archives, Webinars, Action Alerts, TOP PICK recommendations when the next BUY signal occurs, as well as our Quality Scoring System review of the 30 companies that we cover. We go over the markets in much more detail and highlight individual companies’ financial results in our reports. Our September SER Monthly Report comes out on Thursday September 23rd and covers the recent increase in crude prices as well as the weakening general stock market.
If you want access to our SER reports then you will need to become a subscriber. Go to https://bit.ly/34iKcRt to subscribe.
If you enjoy reading our weekly ‘Eye on Energy’ feel free to forward it off to friends and colleagues. We always welcome new subscribers to our complimentary macro energy newsletter.
-
I know Mike is a very solid investor and respect his opinions very much. So if he says pay attention to this or that - I will.
~ Dale G.
-
I've started managing my own investments so view Michael's site as a one-stop shop from which to get information and perspectives.
~ Dave E.
-
Michael offers easy reading, honest, common sense information that anyone can use in a practical manner.
~ der_al.
-
A sane voice in a scrambled investment world.
~ Ed R.
Inside Edge Pro Contributors

Greg Weldon

Josef Schachter

Tyler Bollhorn

Ryan Irvine

Paul Beattie

Martin Straith

Patrick Ceresna

Mark Leibovit

James Thorne

Victor Adair