
Op/Ed
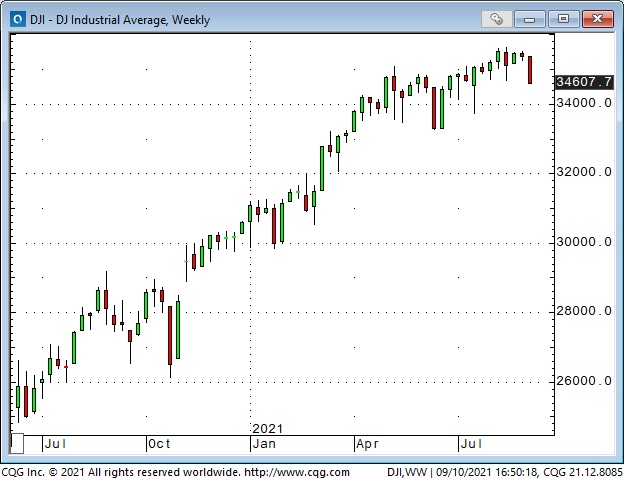
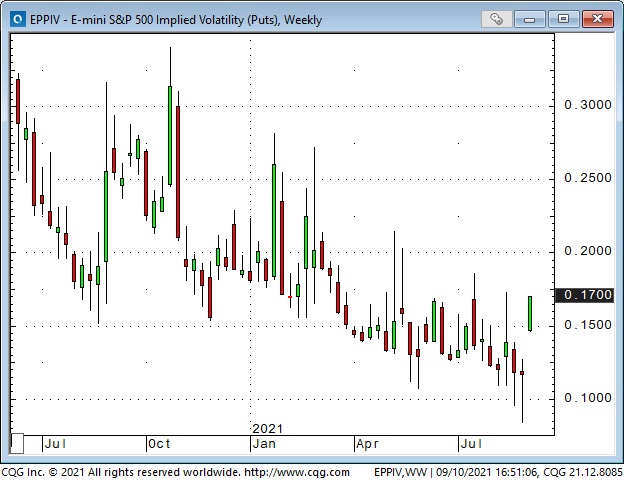
Stock indices trended lower all week to end the week right on their lows. Option Vol spiked higher
In late August, my primary trading view was that the summer’s complacent, pro-risk market sentiment was due for a correction. “Everybody” was a buyer. Stock index option Vol was at the rock-bottom lows of the past few years.
The DJIA closed this week ~760 points (~2%) below last Friday’s close. The S+P and DJIA futures registered five consecutive lower daily closes for the first time since February 2020.
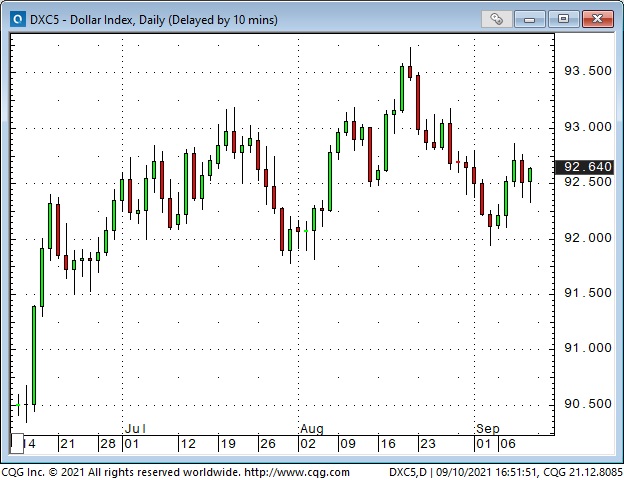
The US Dollar rallied this week as sentiment turned risk-off
The US Dollar Index hit a 9-month high on August 20th as stock indices reversed up from a 3-day mini-correction. For the next two weeks, the USDX trended lower as stocks rallied. The negative correlation between stock indices and the USDX has been strong for the past couple of months – which means when the market is in a Pro-risk mood stocks rally and the USDX falls – and vice versa!
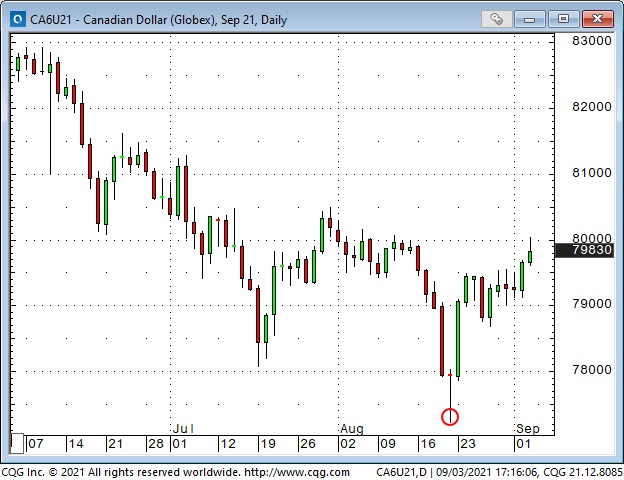
The Canadian Dollar has had a very tight negative correlation with the USDX since April.
Historically, the CAD is negatively correlated to the USDX, but the relationship has been especially tight since April. The CAD has also had a strong historically positive correlation with commodity and stock indices – which means that when the market is in a Pro-risk mood the CAD goes up, along with commodity and stock indices and the USDX goes down – and vice versa!
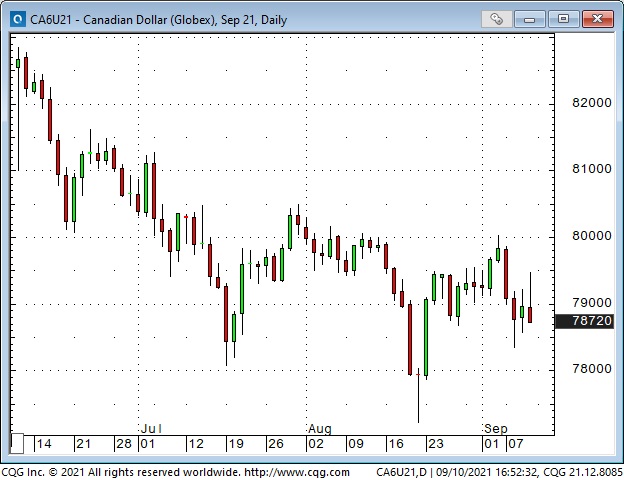
The CAD fell as stock indices fell early this week but rallied in anticipation of the Canadian employment report on Friday. The report was in line with bullish expectations, but the CAD fell back as stock indices tumbled and both markets ended the day on their lows.
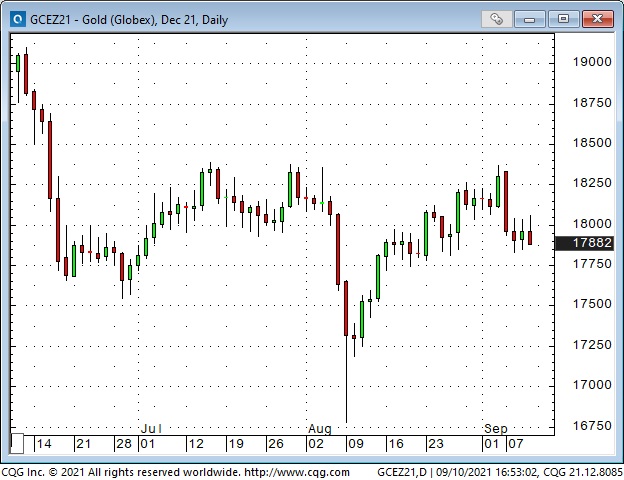
Gold Traded lower this week as the USD was bid
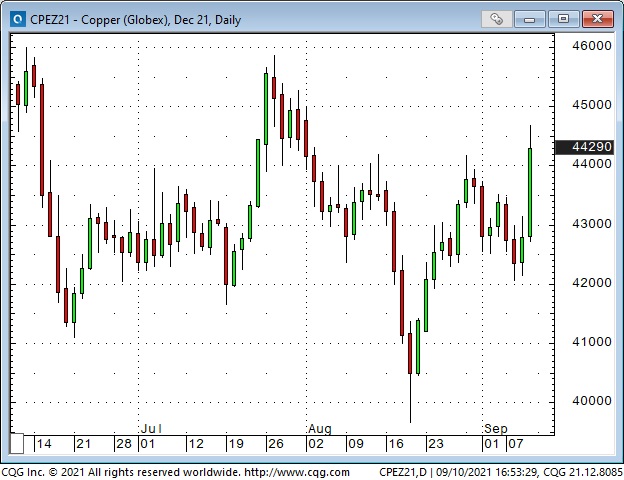
Copper had its biggest one-day jump in months
Copper seems to be influenced from time to time by the swings in equity market risk sentiment, and it did weaken early this week, but it surged higher on Friday even as the stock indices made new lows for the week. Perhaps the soaring price of aluminum (following the coup in bauxite-rich Guinea) contributed to copper’s gains.
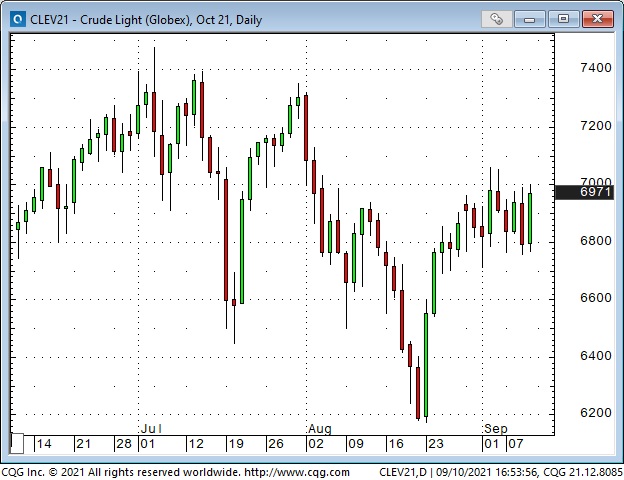
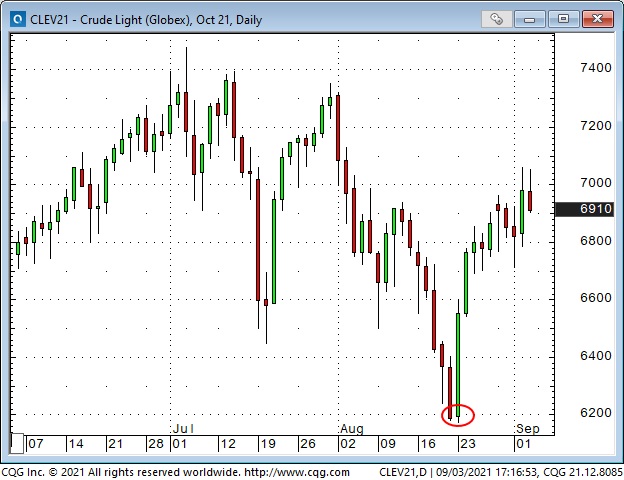
This week’s close on WTI crude oil was the best since late July
WTI has chopped back and forth mostly between $68 and $70 for the past ten days after rallying more than $8 from the August lows. US production cuts and refinery shutdowns due to hurricane IDA have been a factor, as has anticipation of Covid’s impact on consumption.
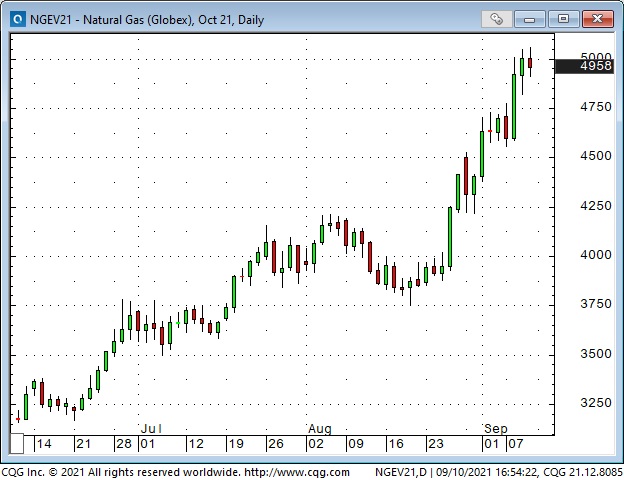
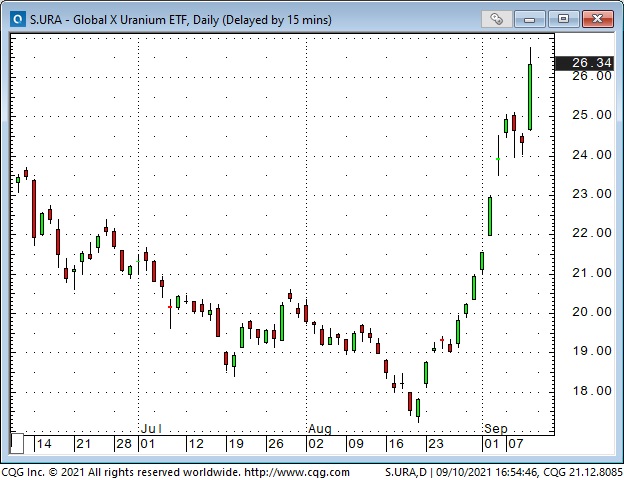
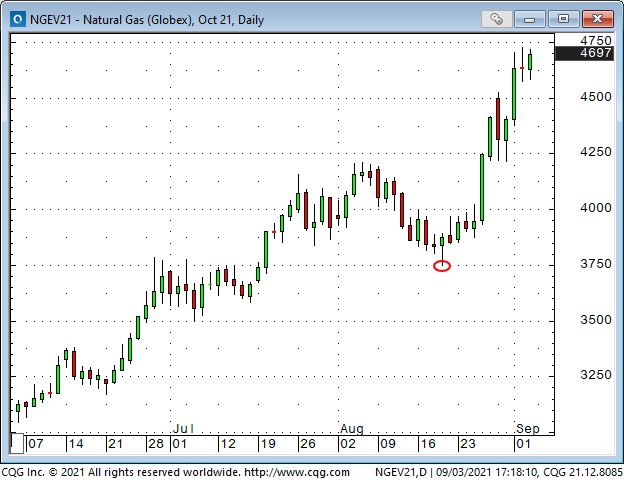
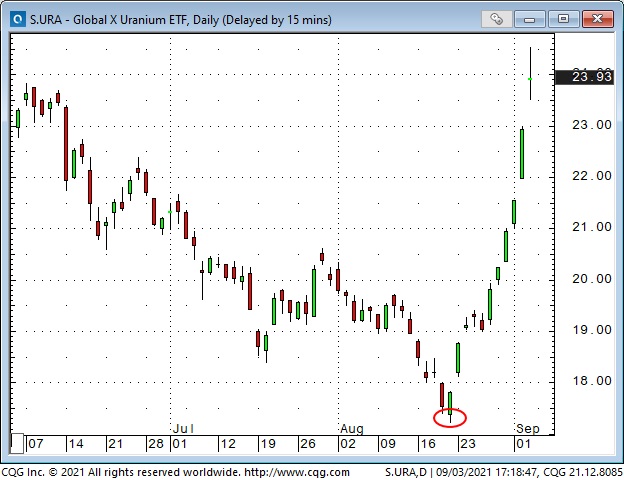
Nat Gas and Uranium continued their powerful rally.
My short-term trading
I ended last week short Dow futures. I was stopped out of the trade, for a small loss, during the Sunday overnight session, but re-shorted the market during the holiday Monday session. I covered that trade for about a 200 point gain on Tuesday. I got short again Thursday and picked up another 200 or so points.
I was happy to not be short during the Thursday overnight session as the market rallied over 200 points on Biden’s push for more vaccinations and his telephone conversation with Xi.
My “Big Miss” for the week was not getting short again on Friday when the market jumped higher on the cash opening but almost immediately reversed course and the DJIA fell ~500 points to register its lowest close in six weeks.
In keeping with my observation that trading is not a game of perfect, I bought equity index futures a couple of times during the week looking for a bounce. The net result of those trades was a small loss.
My net P+L gain on the week (this is always realized gains or losses, and does not include unrealized gains or losses) was ~1.5%. In hindsight, I could have done better just sitting with the short trade I put on Monday – but, I didn’t. I’m flat at the end of the week, but looking forward to next week!
As noted in the “On my radar” section of last week’s notes, I was looking for a correction once we got past Labor Day – but the correction came at me faster than I expected and even though I had a good week I feel I should have done better. Welcome to trading!
On my radar
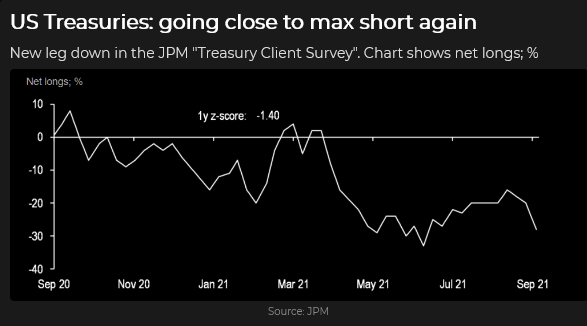
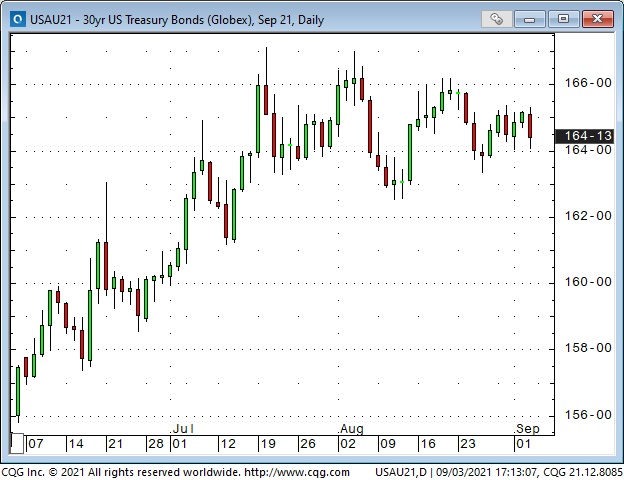
I’ve been looking at the bond market. The chart below shows that clients of JPM are short bonds. Maybe they think interest rates and/or inflation are going up, maybe they think the economy is going to heat up. Maybe they got short bonds last year and are still holding the trade. But the chart shows that they’ve increased their short position over the last five months, so those trades are probably underwater. If the stock market falls will the bond market rise? If the bond market rises will the people who are short bonds start buying back their positions? Should I be buying bonds?
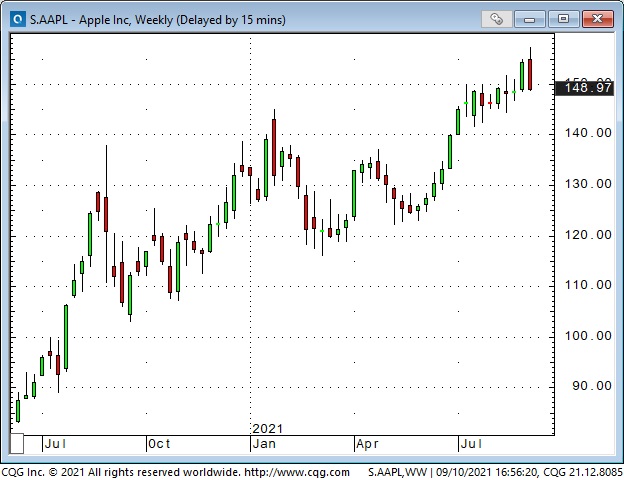
Apple introduces their new phone and watch next week. AAPL hit new ATHs this week and also had its biggest down week since February. If the new product debut is not well received that could be a problem for the market.
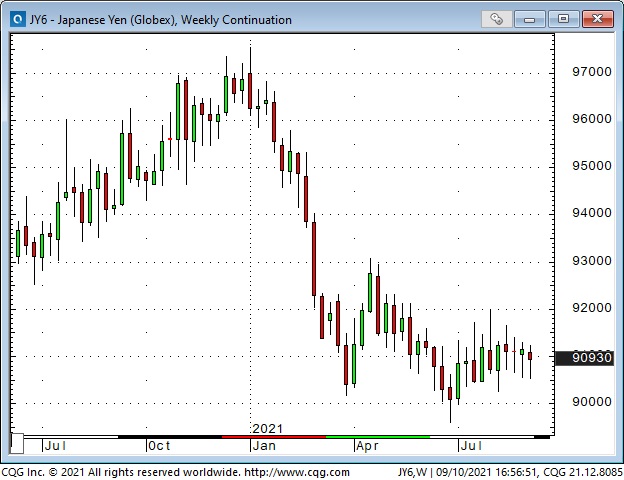
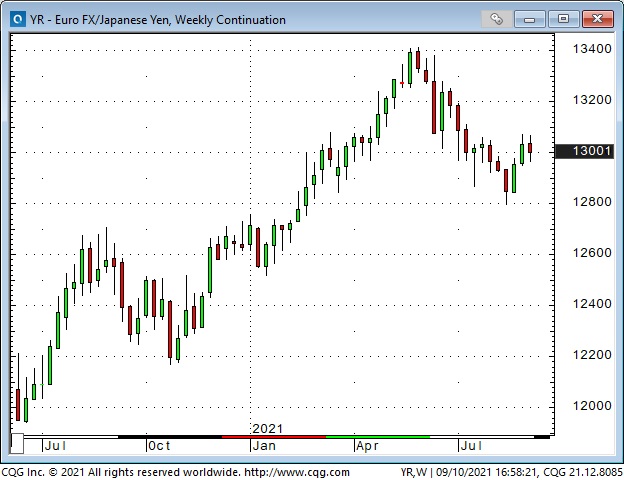
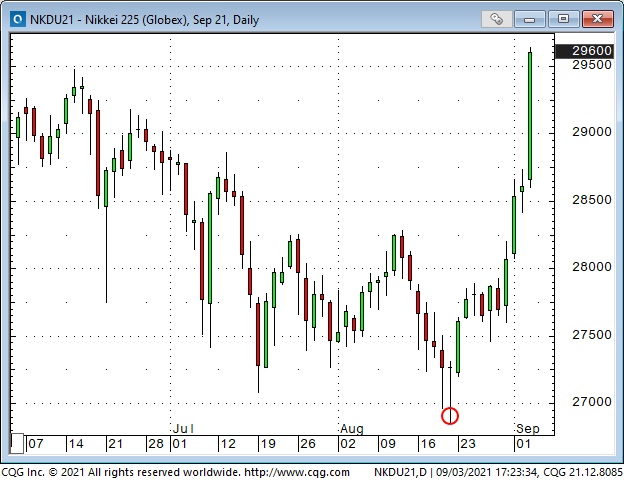
The Yen has a very large spec net short position that was mostly put on Between January and April when the Yen fell against the USD. Since then the Yen has gone sideways. If the pro-risk market sentiment that has taken stocks to All-Time Highs starts to wobble will the Yen get a “safe haven” bid? Will those Yen shorts become buyers? Is the best trade to buy Yen against the USD or against the Euro?
In this chart, a rising market means the Euro is going up Vs. the Yen.
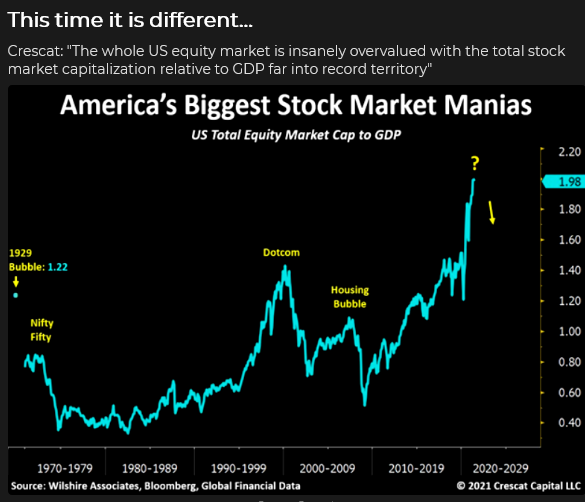
The S+P is down ~90 points (2%) from last week’s All-Time Highs. So far, the “dip” is less than what we saw in each of June, July and August. (The last time the S+P fell by more than 10% was September 2020.) I think there is more to go, maybe much more, but that brings up the subject of “time horizon.”
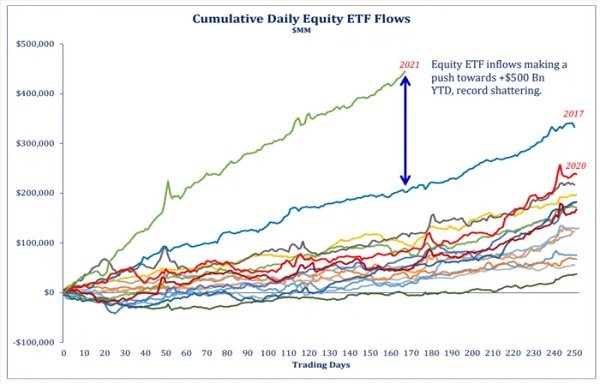
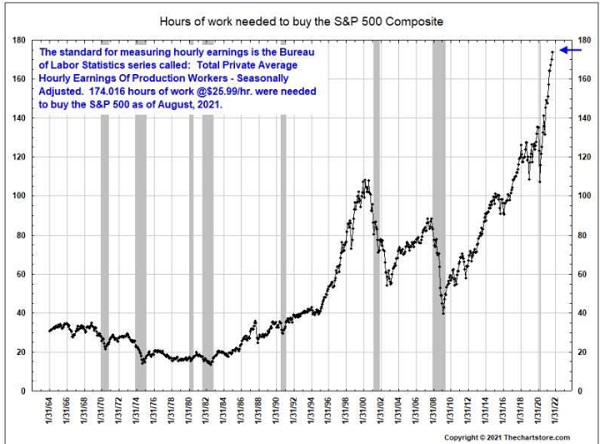
This chart, created by Strategas Research Partners, was in the FT this week. In a nutshell, it shows that the flow of capital into the stock market YTD has been MUCH bigger than in any recent years. One of the reasons given for why all of this money is flowing into equities is because of the persistence of the rally, up over 100% from the March 2020 lows, with barely any pullback.
When I look at this chart I think of Bob Farrell’s 10 Rules – especially Rule #5: The public buys the most at the top and the least at the bottom.
This next chart shows that most of the retail money flowing into the stock market is passive – which means that people make regular monthly purchases, regardless of price, because they believe that, over time, the market only goes up. Passive money buys the indices, which, these days, are heavily weighted by a handful of Big Tech stocks.
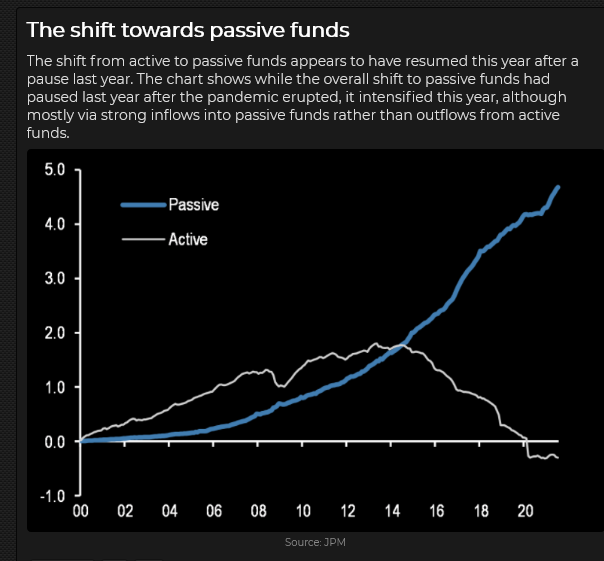
I think passive investors will be “slow” to bail out of the market if it goes down. They won’t even notice a 5 or 10% decline. They will just keep buying. I wonder if the stock market goes down for six consecutive months if they will start selling. I don’t know.
So, getting back to “time horizon,” it’s possible that we’ve seen the high for the year. Short-term speculators will look for opportunities to get short. Longer-term investors (especially those with a long-only mandate) may get more defensive, sell some stocks to buy other stocks. Passive investors will just keep buying the indices. The financial market commentariat will find “reasons” why the market is weaker.
Thoughts on trading
I know I could be/should be a better golfer than I am. I feel the same way about trading, even though I know in my heart-of-hearts that trading, just like golf, is not a game of perfect.
One of my core beliefs about trading is that you have to find a way to trade that suits you. That probably means a lot of years of trial and error, but that’s how it goes. I know I will never be a “check-list” trader; a guy who has a list of conditions that a trade must meet before he pulls the trigger. I’m intuitive. I’m more like a poet than an engineer. But I also have a healthy respect for risk. I will probably always trade “too small” because I don’t want to get hit with a devastating loss. Some guys swing for the fences, I just try to keep getting on base.
I’ve noticed that when I get on a winning streak that my time horizon gets shorter. If I was trading week-to-week swings I start looking to take advantage of intra-day swings. That usually ends with a flurry of small not-well-thought-out trades – that result in net losses!
I read about retail buying a lot of short-dated options – to gain extra leverage. I almost always look at buying options as a way to reduce, not increase leverage or risk. I’m not comfortable when I’m naked short premium because I imagine I’m taking a big risk to earn a small premium. (I know some folks like to be naked short options, and that works for them.) If I’m right about the direction of a market move I want to earn a profit that is much bigger than what I think my potential loss will be if I’m wrong.
I’m more comfortable doing a covered write. For instance, I’ll buy futures and sell short-dated OTM calls against the futures. The short calls reduce the risk on the futures and also give me the opportunity to take in some time premium. However, the short calls also cap the max gain I can make on the trade, but if the market moves in my direction I can just do the trade again; buy more futures at a higher price and write more calls at a higher strike.
Subscribe: You have free access to everything on this site. Subscribers receive an email alert when I post something new – usually 4 to 6 times a month.
Victor Adair retired from the Canadian brokerage business in 2020 after 44 years and is no longer licensed to provide investment advice. Therefore, this blog, and everything else on this website, is not intended to be investment advice for anyone about anything.
Anyone looking to purchase property in Canada who is not a citizen or permanent resident of this country may not have much time left.
After Canadians go to the polls on September 20, some potential homebuyers may have to wait to buy a property in Canada as both the governing Liberals and opposition Conservatives have pledged to ban foreign buyers from purchasing residential homes in Canada for at least the next two years.
The proposals build upon provincial taxes imposed on foreign homebuyers in the hottest housing markets of British Columbia and Ontario in 2016 and 2017, respectively. While experts have long debated whether those policies have helped address the housing affordability crisis that has since spread beyond the confines of the Vancouver and Toronto regions, one prominent policy director warns a federally-imposed ban could backfire…read more.
Each week Josef Schachter will give you his insights into global events, price forecasts and the fundamentals of the energy sector. Josef offers a twice monthly Black Gold (SER) newsletter covering the general energy market and 30 energy, energy service and pipeline & infrastructure companies with regular updates. We hold quarterly subscriber webinars and provide Action BUY and SELL Alerts for paid subscribers. Learn more.
EIA Weekly Data: The EIA data on Wednesday September 9th was heavily impacted by Hurricane Ida. Demand and production both fell with crude prices remaining high as the return of the majority of the offshore oil production is delayed. On the Commercial Crude side Inventories fell by only 1.5Mb (forecast was for a decline of 4.6Mb). The big decline was in Gasoline Inventories which fell 7.2Mb as refinery activity fell by 9.4 points to 81.9% from 91.3%, as Gulf Coast refineries remain closed. US crude oil production fell by 1.5Mb/d to 10.0Mb/d as 1.75Mb/d of offshore production was shut in. It may take into late September for the refineries and offshore facilities to return to normal operating levels. Some of the refineries still remain without electricity. We still see US production rising and reaching 12.0Mb/d before year end, with volumes returning to 11.5Mb/d+ once this Hurricane impact is over.
Demand for Jet Fuel, Distillates, Fuel OIl and Propane fell sharply as Hurricane Ida reached landfall. Total Product Demand fell 2.87Mb/d to 19.95Mb/d. Gasoline consumption rose a modest 30Kb/d to 9.61Mb/d with Jet Fuel Consumption falling by 176Kb/d to 1.62Mb/d. Cushing Inventories rose last week by 1.9Mb to 36.4Mb compared to 54.4Mb last year and 39.3Mb two years ago.
Baker Hughes Rig Data: The data for the week ending September 3rd showed the US rig count falling by 11 rigs (up five in the prior week) as Hurricane Ida forced 14 rigs to shut down in Louisiana. Of the total of 497 rigs working last week, 394 were drilling for oil and the rest were focused on natural gas activity. This overall US rig count is up 94% from 256 rigs working a year ago. The US oil rig count is up 118% from 181 rigs last year at this time. The natural gas rig count is up a more modest 42% from last year’s 72 rigs. The Permian saw an increase of one rig to 250 rigs and is up 100% from 125 rigs last year at this time.
Canada had a five rig rise last week to 152 rigs. Canadian activity is now up 2.9x from 52 rigs last year. There were 92 oil rigs working last week, up from 19 last year. There are 60 rigs working on natural gas projects now, up from 33 last year.
The material increase in rig activity over a year ago in both the US and Canada should continue to translate into rising liquids and gas production over the coming months. The data from the many companies that reported Q2/21 results support this rising production profile expectation.
Conclusion:
Starting in the next few weeks of September, now that the summer driving season is over, there should be weekly builds in Commercial Crude Stocks around the world as inventories build to meet the winter 2021-2022 needs. If we see repetitive weekly rises of 3-5Mb to US Commercial Crude storage levels, WTI crude should decline below US$60/b. Normal fall builds are 2-3Mb per week but if we see any builds over 5Mb in any week, that would put meaningful downward pressure on crude prices.
Bearish pressure on crude prices:
1. The EU is recommending that non-essential travel to the US be halted due to the rapid rise in US caseloads. This will lower air travel and the demand for Jet Fuel, and as a result lower crude oil will occur. Cancellations of passenger flights in the US have caused many US airlines to lower capacity by 8-10% starting this month. The recent Labour Day holiday season may increase case counts in the coming weeks.
2. Low vaccination rate countries in Asia are imposing new growth-sapping restrictions due to the fast rise in the new, more lethal and faster spreading variants. Vietnam has the most aggressive lockdowns announced this week. Supply chains from Asia are impacting the global supply chains and making the economic recovery difficult. Those industries most harmed are those that need electronic chips which may be in short supply for a year according to recent reports.
3. Countries such as Argentina, Australia, Bangladesh, Central African Republic, China (14 of 32 provinces seeing spikes – including Wuhan where the outbreak started, as well as in the capital Beijing) are having rising caseloads. Death counts are now up to 4.59M worldwide and are over 651K in the US. The total worldwide caseload is now 221.9M people of which the US has 40.3M cases. Recent US single-day caseload records have occurred in Hawaii, Oregon, South Carolina, and Alabama. Florida has the highest Covid hospitalization rate then anywhere in the US. The US now has 53.2% of all eligible people fully vaccinated and 60% with an initial dose. President Biden is pushing now (mandating) all federal employees and contractors to get vaccinated.
4. The Mu Variant is spreading around the world. This variant started in Colombia and now is impacting 39% of those infected with the pandemic disease. This variant is now seen in more than 40 countries and in 49 US States. A London immunologist at the Imperial College in London says “that the early research indicates it appears to be highly effective at evading immunity”.
5. The Saudis are pricing crude oil for October delivery to Asia at US$1/b lower than previous months as the fight for market share in the patchy economies in the area.
Bullish pressure on crude prices:
1. Hurricane Ida (a Category 4 Hurricane) shuttered in most of the offshore Gulf of Mexico oil and gas production. Over 1.7Mb/d of crude was shut in which equates to over 90% of offshore production. It may take weeks for all this production to be reinstated.
2. Hurricanes, extreme heat waves, forest fires, crippling droughts and shortage of electricity for air conditioning across the US and Canada are all aiding consumption of natural gas. It is a big beneficiary of this increase in electricity demand as hydro has, in many cases, low water levels. NYMEX natural gas prices are now at US$4.97/mcf. AECO prices have drifted but are still at an attractive C$3.49/mcf.
3. Libya is facing disruptions in crude supplies again as two large export ports are closed by protestors. Libya produced 1.165Mb/d in July 2021, the last data point on their production levels.
CONCLUSION:
WTI has lifted from US$61.74/b three weeks ago to US$69.36 (up 6 cents today) due to Hurricane Ida and the shutting in of most of the US offshore crude production. With the summer driving season over and the normal fall build season starting shortly, we expect WTI crude oil prices to start to go down again. We had forecasted that WTI would decline below US$65/b in August (which it did) and now see a breach of US$60/b as likely in the next few weeks. How low we go will depend upon the health of the largest economies (the US, China and the EU) and how large the seasonal crude oil storage builds are. Our worst case scenario is for downside for WTI crude to US$48-54/b during Q4/21.
Energy Stock Market: The S&P/TSX Energy Index trades currently at 125 and is down nearly 14% from the high of 145 in mid-June. The recent low for the Energy Index was 109.72 when crude fell to US$61.74/b. Once WTI breaches US$61.74/b later this month, we should be heading towards 100 for the Energy Index.
The energy sector is facing attacks and becoming the climate battle punching bag by the Liberals, the NDP and the Green Party as the Federal election cycle is now underway. Canadian energy stocks are likely to face more pressure than energy stocks in the US during the September election cycle.
When, not if, WTI breaks US$60/b the S&P/TSX Energy Index is likely to breach 80 resulting in a painful 45% decline from the peak in mid-June. Over-invested bulls are likely to get hurt pretty badly. We recommend caution and holding cash for the next low risk entry point on that portion of one’s portfolio which is energy focused. The energy and energy service companies with the most downside are those with stretched balance sheets and have missed production, revenue or EBITDA forecasts. Some of the hardest hit energy and energy services companies are down 40-50% so far from the 2021 highs.
Subscribe to the Schachter Energy Report (SER) and receive access to our two monthly reports, all archives, Webinars, Action Alerts, TOP PICK recommendations when the next BUY signal occurs, as well as our Quality Scoring System review of the 30 companies that we cover. We go over the markets in much more detail and highlight individual companies’ financial results in our reports. Our September SER Report comes out tomorrow Friday September 10th and continues the review of Q2/21 results with the coverage of the last ten companies on our list. It also includes an update of the Insider Trading Report.
If you want access to our SER reports then you will need to become a subscriber. Go to https://bit.ly/34iKcRt to subscribe.
If you enjoy reading our weekly ‘Eye on Energy’ feel free to forward it off to friends and colleagues. We always welcome new subscribers to our complimentary macro energy newsletter.
Powell’s “Substantial Further Progress” – is not happening yet – and neither is the taper
The combination of much weaker-than-expected employment and consumer confidence reports means that the Fed will delay the taper.
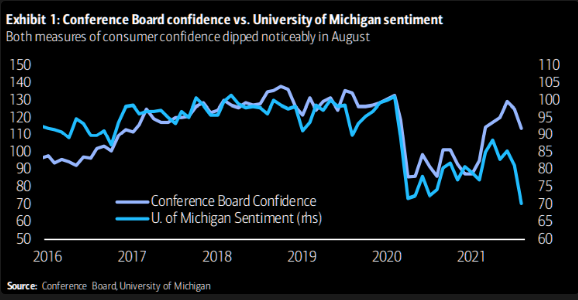
Price action was dull all week – nobody wanted to strap on a major position given the risk that markets could react violently to the employment report first thing Friday morning. But once that report was out – and it was WAY weaker than expectations – the market reaction was muted, although the S+P, the Nasdaq and the TSE all registered record-high weekly closes.
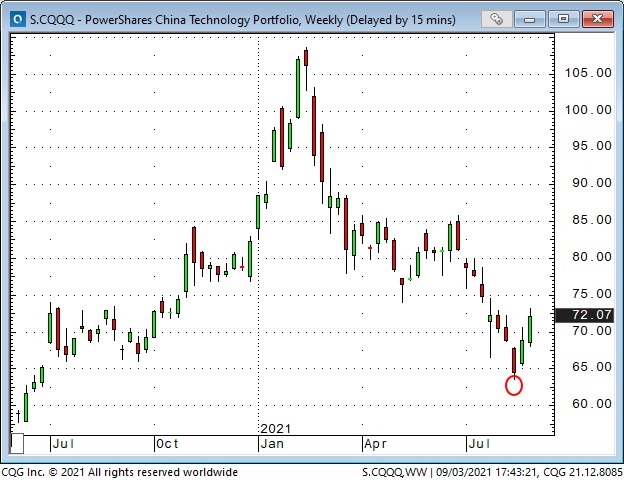
The S+P, the Nasdaq, and the TSE are up ~20% YTD. The Dow and the Russell small-cap index are up ~15%. The MSCI Emerging Market Index is up ~3% (China has been a drag, with the Chinese tech sector down ~12% YTD, down ~ 40% from the February highs.)
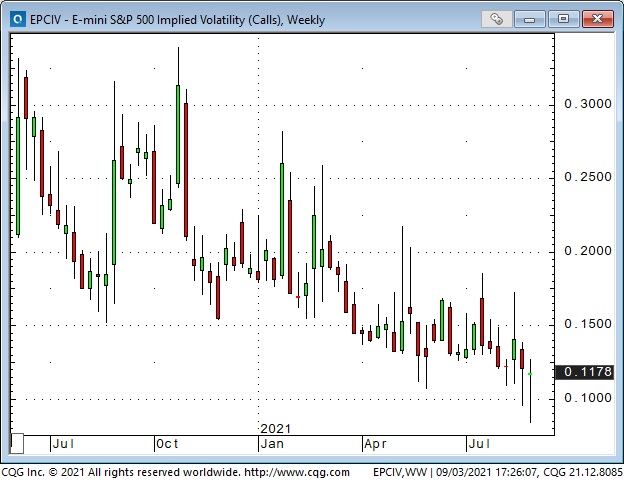
Implied option volatility is LOW
Option volatility across asset classes is historically LOW. One of the underlying reasons is that in recent years people have seen option writing as just another “reaching for yield” trade (that works well until it blows up in your face.) Let’s assume that writing options for yield established a lower benchmark vol level. But even given that lower benchmark, vol is LOW. I think this very low vol level signifies complacency – as in, what could possibly go wrong?
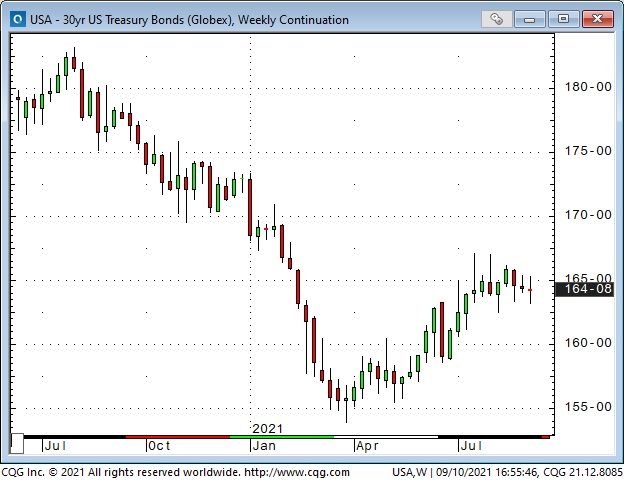
The bond market didn’t like the employment report
The headline miss on the employment report was bond friendly, but yields jumped on much larger-than-expected wage gains. I’ve thought that many of the current inflationary pressures could be “transitory,” but if wage gains persisted, that (and rising rents) would mean sustained higher inflation. It’s beginning to look as though stagflation could be a real possibility.
The US Dollar didn’t like the weak employment report
The US Dollar Index (USDX) hit a 9-month high on August 20, but it has closed lower 10 of the last 11 trading days. The USDX has been weaker as the equity and commodity markets have been stronger – a classic “pro-risk” market profile.
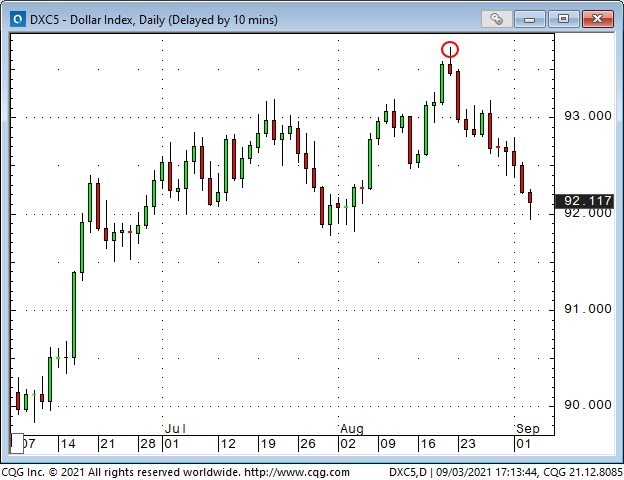
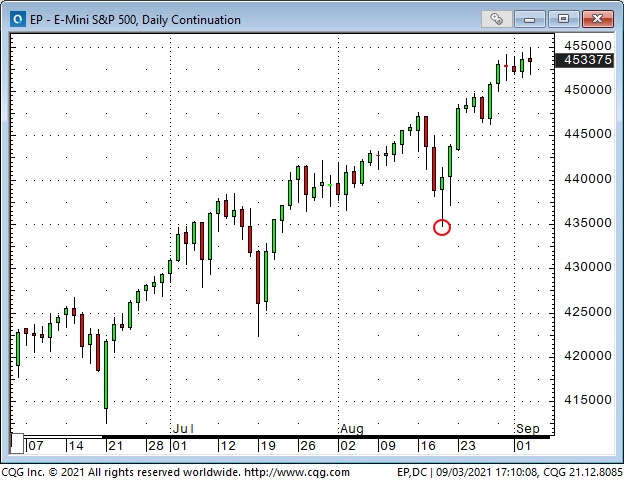
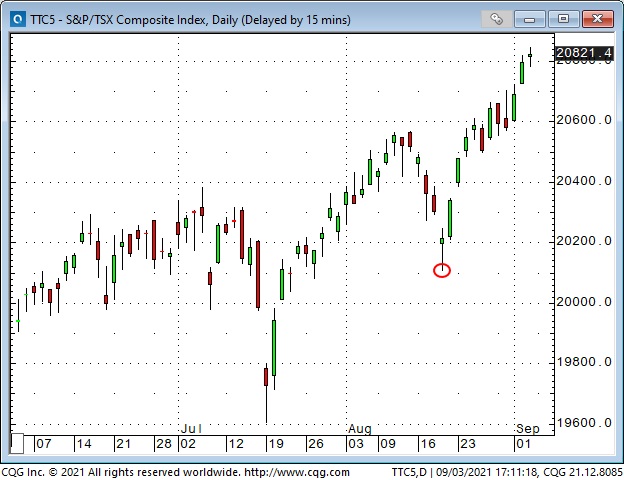
August 20 was a Key Turn Date
I’ve circled August 20 on a number of the charts in this report. That was the day many markets turned from “risk-off” to “risk-on.”
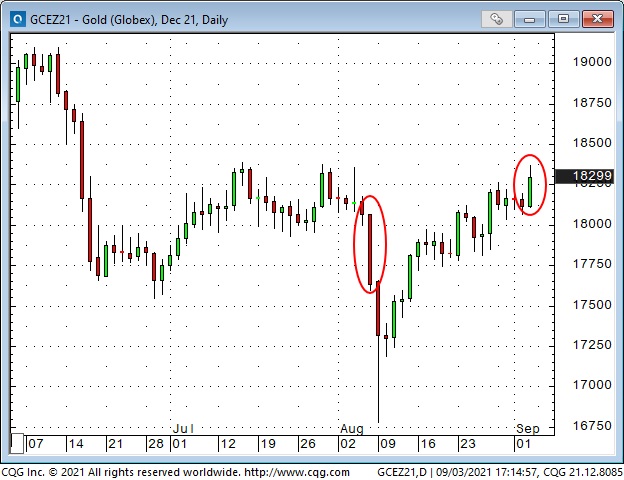
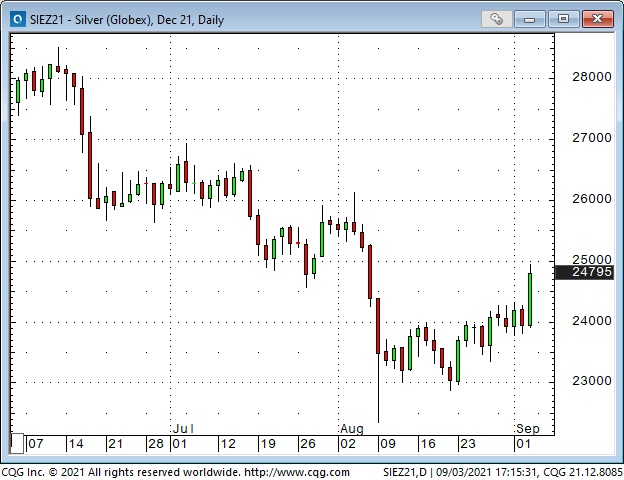
Gold traded to a 1-month high on the weak employment report
Last month’s strong employment report (August 6) sparked a sharp tumble in precious metals – this month’s report had the opposite effect. The prospect of higher interest rates last month caused gold to break below the July lows. The “margin cleck selling disaster” on the following Sunday afternoon drove gold (briefly) to 5-month lows. All in all, gold dropped and rebounded ~$150 in the last five weeks. Silver dropped nearly $4 but has only bounced back ~$2.50. No surprise – the weaker USD the past three weeks has made it easier for precious metals to rally.
The Canadian Dollar rallied as the USD fell
The USDX hit a 9-month high on August 20 and reversed lower – the CAD hit a 9-month low on August 20 and reversed nearly 3-cents higher. The CAD rally was concurrent with the rally in stocks and commodities. The correlation between price action in the CAD and stocks and commodities has been very strongly positive since the April 2020 Covid panic; the correlation with the USD over that same time period has been very strongly negative.
Traders need to be aware of strong correlations between markets to avoid concentration. For instance, for the past 18 months, being long the S+P, long the commodity index or long the CAD was essentially the same trade – you were concentrating your risk in a “pro-risk” profile, not diversifying risk in different assets.
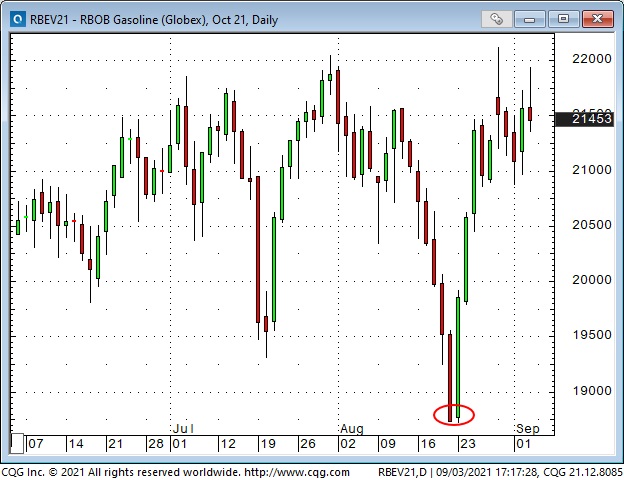
Fossil fuels rallied on the recent pro-risk mood
WTI crude bounced back ~$8 (13%) from the August 20 lows (the day the USDX peaked), but gasoline and heating oil had stronger rallies as hurricane-related refinery outages caused supply shortages.
Nat Gas and Uranium may have been off your radar (and off mine), but they’ve had powerful rallies since, you guessed it, August 20!
What will be the knock-on effects of the major policy changes taking place in China?
In my July 31 Notes and again on August 21, I wondered if the weak stock markets in China could lead to weaker stock markets elsewhere. So far, that’s not happening; in fact, you have to wonder if money leaving Chinese markets isn’t flowing into other markets and boosting those prices.
I’m looking for possible contagion from China because the government of the world’s 2nd largest economy is making major policy changes that will be in place for years. Jack Ma got wacked last year for criticizing regulations that stifled fintech innovation. Imagine what “innovation” will look like in the China that Xi Jinping envisions. I think there is a bigger risk to markets, due to policy changes in China than is currently priced into markets.
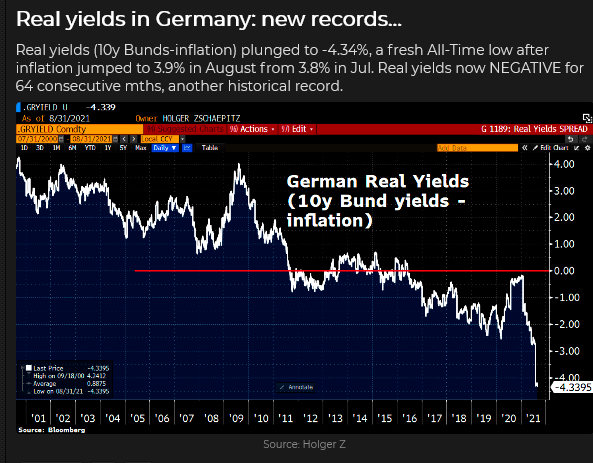
For instance, exports to China are an important part of the German economy. If “Common prosperity for all” means BMW, Audi and Mercedes sell fewer cars in China, does the Euro weaken Vs. the USD? Will the CAD (next door to the USA) outperform the AUD (highly dependant on exports to China?)
My short term trading
It was the last week of summer, and markets felt dull. There was also the possibility that whatever position I took could get crushed by the looming employment report at the end of the week. So I didn’t do much. I shorted the Dow a couple of times early in the week – it seems to be the weakest of the different share indices – and I was stopped for tiny losses both times. Honestly, these weren’t well-thought-out trades; they were more a case of, “Don’t just sit there, do something.” ( I know I’m not supposed to do that, but…)
I let an hour go by after the release of Friday’s UE report (I waited for the thrashing around to die down), and then I shorted the Dow again. The Dow has been unable to take out the mid-August highs while the S+P and Nasdaq are well above those levels. (Old trading axiom: if you want to be short a market, sell the weakest sector of that market.) Short Dow futures is my only position going into the 3-day weekend. My net P+L on the week was down ~0.20%.
On my radar
From a trading perspective, the Christmas season and late summer are awkward times of the year. Trading is thin, and there are other things to do. There are trading opportunities, but I look forward to getting past Labor Day, just like I look forward to the New Year.
I think markets have been complacent throughout late summer; I think they may be stressful as we get into fall. If I’m right about that, I will want to be doing the opposite of the pro-risk trades. That doesn’t mean I automatically sell stocks and commodities and buy USD and bonds – but if the pro-risk mood fades, I will be looking for setups to make those trades.
Thoughts on trading
When I started this new website over a year ago, my one golden rule was that it would always be a work in progress – nothing was set in stone. As time passed, I wanted to do less “reporting” and write more about what I was doing and why. I also wanted to be clear that what I was doing was what suited me – I didn’t want to imply that what I was doing was the best thing to be doing! I absolutely believe that everybody who chooses to be a trader has to find their own way – find a way that suits them – and that will take a lot of trial and error!
I keep asking myself, “Why do you believe what you believe?” I might think that my beliefs have been formed by an impartial study of the “evidence,” but was there some subliminal bias in selecting the “evidence” I chose to study? Was there a “confirmation bias?” (How could there NOT have been?)
Am I trying to guess where a market might go, or am I trying to guess what the other participants in that market will do if such-and-such happens? How much of my “analysis” is already in the price?
My answer is that I can’t know where the market will go. I can’t know who the other people are trading this market or what they will do. I can’t trade without a bias. I absolutely have to be prepared that the market will do exactly the opposite of what I expect.
My friend Peter Brand keeps repeating that managing trade risks is more important to your success than your trade selection process. Let that sink in.
The romance novels of traders “seeing” something that nobody else saw and becoming rich because of that are truly romance novels. You may stumble into a trade that makes you a lot of money and good for you; that happens sometimes. It doesn’t mean you’re the next boy wonder. Just be sure you don’t see a “sure thing” coming and blow up your account waiting for it to kick in!
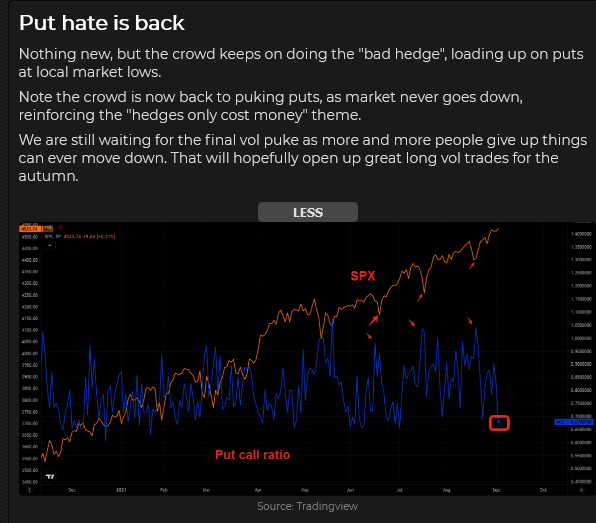
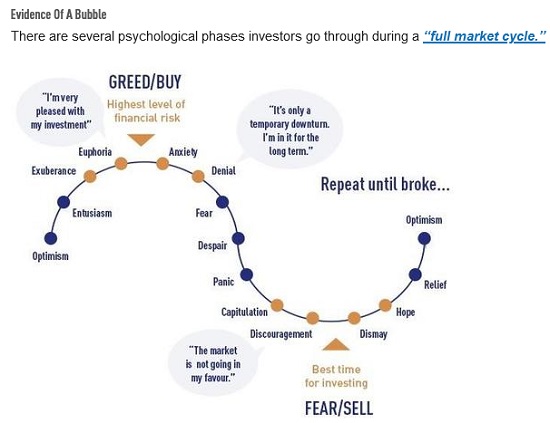
One last thing: in terms of where we are in the fear and greed cycle, I think we are at Euphoria. I don’t know how long it takes before we get to Anxiety or how much higher the stock market may go between now and then. Be careful out there!
Subscribe: You have free access to everything on this site. Subscribers receive an email alert when I post something new – usually 4 to 6 times a month.
Victor Adair retired from the Canadian brokerage business in 2020 after 44 years and is no longer licensed to provide investment advice. Therefore, this blog, and everything else on this website, is not intended to be investment advice for anyone about anything.
Forgive me if you have heard this term before: “transitory,” meaning inflation is supposedly temporary.
Year-over-year, when you look at the base effect on prices, it makes sense to be patient. During the height of the pandemic, gas prices hit lows of around 60 cents a litre. Because no one was driving and oil prices were way below current levels. So, naturally, gas prices are higher now. This is just one example of why year-over-year comparisons don’t always work in highly volatile components.
However, inflation is currently a hot topic for investors, economists and politicians in the midst of the federal election campaign. Prices have been going higher and compromising the discretionary income of Canadians…read more.
-
I know Mike is a very solid investor and respect his opinions very much. So if he says pay attention to this or that - I will.
~ Dale G.
-
I've started managing my own investments so view Michael's site as a one-stop shop from which to get information and perspectives.
~ Dave E.
-
Michael offers easy reading, honest, common sense information that anyone can use in a practical manner.
~ der_al.
-
A sane voice in a scrambled investment world.
~ Ed R.
Inside Edge Pro Contributors

Greg Weldon

Josef Schachter

Tyler Bollhorn

Ryan Irvine

Paul Beattie

Martin Straith

Patrick Ceresna

Mark Leibovit

James Thorne

Victor Adair