
Op/Ed
Each week Josef Schachter gives you his insights into global events, price forecasts and the fundamentals of the energy sector. Josef offers a twice monthly Black Gold (SER) newsletter covering the general energy market and 30 energy, energy service and pipeline & infrastructure companies with regular updates. We also hold quarterly webinars and provide Action BUY and SELL Alerts for paid subscribers. Learn more.
EIA Weekly Data: The EIA data on Thursday October 20th was mixed with some data supportive of current prices and some not so. Commercial Crude Stock fell 0.4MB (forecast was for a rise of 1.86Mb) and there would have been a rise of 4.6Mb if not for Net Imports falling 715Kb/d or 5.0Mb on the week. The biggest sub-component was Exports that rose 546Kb/d or 3.8Mb on the week. Total Motor Gasoline inventories fell 5.4Mb on the week as US Refinery Runs declined 2.0% to 84.7% from 86.7% in the prior week. This compares to the 85.2% level of pre-pandemic 2019.
Crude production fell 100Kb/d to 11.3Mb/d. But it is up 1.4Mb/d above last year.
In detail:
• Commercial Crude Oil Stocks fell by 0.4Mb to 426.5Mb. Energy bulls point to this being 61.6Mb below last year’s pandemic level, but it is close to the 433.2Mb seen at this time in 2019 when gasoline and jet fuel was higher, so we don’t see crude inventories as low for this time of year.
• Refinery Activity fell 2.0 points to 84.7% from 86.7% last week. Demand for all products rose materially last week. Total Product Demand rose 1.957Mb/d to 21,832Mb/d as Other Oils demand rose by 1.05Mb/d to 5.056Mb/d. Gasoline consumption rose 449Kb/d to 9.634Mb/d (above the 9.59Mb/d consumed in 2019 at this time) while Jet Fuel Consumption rose 80Kb/d to 1.414Mb/d (2,088Mb/d consumed in 2019 at this time). Cushing Inventories fell by 2.4Mb/d to 31.2Mb compared to 60.4Mb last year and 44.5Mb two years ago, before the pandemic.
Baker Hughes Rig Data: The data for the week ending October 15th showed the US rig count rose by 10 rigs (rose five rigs in the prior week). Of the total of 543 rigs working last week, 445 were drilling for oil and the rest were focused on natural gas activity. This overall US rig count is up 93% from 282 rigs working a year ago. The US oil rig count is up 117% from 205 rigs last year at this time. The natural gas rig count is up a more modest 32% from last year’s 74 rigs, now at 89 rigs. The Permian saw an increase of one rig (up by three rigs last week) to 267 rigs and is up 105% from 130 rigs last year at this time.
Canada had a rise of one rig (up two rigs in the prior week) to 168 rigs. Canadian activity is now up 110% from 80 rigs last year. There were 98 oil rigs working last week, up from 40 last year. There are 70 rigs working on natural gas projects now, up from 40 last year.
The material increase in rig activity over a year ago in both the US and Canada should continue to translate into rising liquids and gas production over the coming months. The data from many companies on their plans for Q4/21 and forecasts for 2022 support this rising production profile expectation. Companies are taking advantage of attractive costs and want to lock up experienced rigs and crews as staffing issues are getting tough for the sector.
Conclusion:
We should see more weekly builds in Commercial Crude Stocks over the next few weeks before winter fuel demand picks up.
Bearish pressure on crude prices:
1. Covid caseloads are growing around the world. Formal vaccine documents are to be the norm in Canada going forward. In the US the death rate is around 2,000/day and over 726K deaths have been reported so far. Worldwide the death count is now 4.91M. This pandemic has taken more lives in the US than the 1918-1919 Spanish Flu (675,000 estimated). Deaths are rising in Romania and Russia. Many US government employees such as the military, police (50% in Chicago), medical staff, front line staff and many in the service sector are rejecting required vaccination and losing their jobs. The UK is now seeing 40-50,000 new cases daily and some are the new “super-strain” Delta variant known as AY.4V which has reached 8% of their cases. It has now been seen in the US as well. The worry is about the faster transmissivity of the new variant. There is also worry about the normal winter flu season impacting Covid caseloads.
2. Energy demand is under pressure as high prices for most food, rent, taxes, child care, health expenses, auto costs and other daily necessities make spending decisions tougher for consumers. This gouge in prices will surely impact consumers’ buying behaviour in the coming months. The spending pie of consumers is shrinking and some spending habits of the past will have to be dropped. Demand destruction is on the way. Consumer Confidence is falling sharply and is nearing levels that have forewarned of following recessions.
3. Global ports remain clogged with containers and delivery problems that could last into 2023 according to the CEO of Dubai’s DP World, the largest operators of ports. Shoppers are being advised to buy their Christmas gifts early from what is currently available in the stores. The stuff on ships may not reach shops until the New Year.
4. China’s domestic economy grew by 4.9% in Q3/31 down from the 7.9% rate in the prior quarter. Industrial production rose a very muted 3.2%. Consumption of crude is coming down as China cuts oil import quotas from independent refineries. September imports were down 15%.
5. The US has now had two quarters of negative industrial production and some economists are now talking about a recession starting in early 2022 if both stimulus bills are not passed and President Biden becomes a lame duck.
Bullish pressure on crude prices:
1. Speculative long investors (options traders, hedge and commodity funds) and a short squeeze on bearish positions in the futures and options markets on crude and natural gas have spiked up prices. It could go higher but as these positions are reversed, the parabolic price spike could reverse sharply on any negative news. Recently speculative buyers of nearby US$100/b options have increased them from under 20,000 contracts to 140,000 contracts. This bullish view is very persistent and is a contrarian signal historically.
2. Spot prices in Europe have backed off after President Putin confirmed that Russia would meet all European winter needs once they open the Nord Stream 2 Pipeline, it is now being filled and is undergoing pressure tests before certification. The new lines can double Russia’s annual export capacity to Europe. In the US and Canada, NYMEX today is US$5.09/mcf – and in Canada AECO C$4.89/mcf. All have backed off from recent highs.
CONCLUSION:
WTI has risen to US$83.77/b as the Commercial Crude Oil Stocks number was lower than consensus. We see prices as having US$15/b of speculative value which should disappear as Commercial Crude Stocks continue their seasonal build. The question for us is what is happening to world wide demand as the two largest economies in the world slow down? We may be moving from stagflation to recession in 2022 in many countries.
Many industrial plants in China have been closed due to the high cost of fuel and the Government’s plan to lower emissions in the Beijing area for the upcoming winter Olympics from February 4th to the 20th. Clean air is needed for the event and China wants to show it is making progress on its climate initiatives. This will dampen China’s consumption of fossil fuels over the next four to six months.
Energy Stock Market: The S&P/TSX Energy Index currently trades at 157 (same as last week). The S&P Energy Bullish Percent Index has stayed at 100% for two weeks now. This is a clear SELL signal. Energy stocks could fall 30-40% in the coming months.
Our October SER Monthly Report comes out this Thursday October 21st with details on the general stock market and its expected impact on the energy sector.
Over the next few months any number of events could lead to a domino effect of debt-laden companies getting into trouble and financial markets declining materially. The Dow Jones Industrials Index is now at 35,596 and could fall to below 30,000 in Q4/21 and to <25,000 during Q2/22. We have already seen three down days of more than 500 points for the Dow Jones Industrials Index and expect many more in the coming months as the bullish and greed enthusiasm swings to fear and liquidation.
If you want to receive ongoing coverage of these negative market impacts, become an SER quarterly or annual subscriber. For new people, the quarterly offering is a good way to peruse our product before you determine which subscription format makes the most sense for your needs.
We will be holding our 90 minute Q4/21 Black Gold Webinar on Wednesday November 10th at 7PM MT. We will discuss in detail our view on the general stock market, the energy market and our bearishness on both areas for the near term. We will also go over those companies that have reported their Q3/21 results by the time of our cutoff for the webinar. We always have two Q&A sessions to go over our presentation materials and subscriber questions.
If you want access to all our SER reports then you will need to become a subscriber. Go to https://bit.ly/34iKcRt to subscribe.
If you enjoy reading our weekly ‘Eye on Energy’ feel free to forward it off to friends and colleagues. We always welcome new subscribers to our complimentary macro energy newsletter.
Each week Josef Schachter gives you his insights into global events, price forecasts and the fundamentals of the energy sector. Josef offers a twice monthly Black Gold (SER) newsletter covering the general energy market and 30 energy, energy service and pipeline & infrastructure companies with regular updates. We also hold quarterly webinars and provide Action BUY and SELL Alerts for paid subscribers. Learn more.
EIA Weekly Data: The EIA data on Thursday October 14th surprised energy bulls once again with a huge increase in Commercial Crude Oil Stocks of 6.1Mb (forecast was for a rise of 0.7Mb), and an increase in US crude production of 100Kb/d as US production recovered to 11.4Mb/d. This is just short of the 11.5Mb/d before the hurricanes started. We have been highlighting these negative issues for crude oil over the last number of issues and they are clearly occurring. This will eventually put a cold shower on the crude bulls and drive WTI prices down below US$70/b in the near future.
In detail:
- Commercial Crude Oil Stocks rose by 6.1Mb on the week to 427.0Mb. Energy bulls point to this being 62.1Mb below last year’s pandemic level, but it is close to the 434.9Mb seen at this time in 2019 when demand was higher. So we don’t see crude inventories as low for this time of year. Gasoline inventories fell by 2.0Mb to 223.1Mb and are close to the 226.2Mb in storage at this time in 2019. This crude oil inventory number would have been 10.0Mb higher or up a total of 16.1Mb if not for net imports declining by 1.441Mb/d or by 10.0Mb on the week.
- Refinery Activity fell 2.9 points to 86.7% from 89.6% last week. This level is now above the pre-pandemic levels of 83.1% at this time in 2019. The lower refinery activity was the reason for the lower gasoline inventories.
- Demand for all products fell materially last week. Total Product Demand fell 1.651Mb/d to 19.875Mb/d (20.905Mb/d consumed in 2019 at this time). Gasoline consumption fell 241Kb/d to 9.186Mb/d (9.354Mb/d consumed in 2019 at this time) while Jet Fuel Consumption fell 360Kb/d to 1.334Mb/d (1.613Mb/d consumed in 2019 at this time). Cushing Inventories fell by 175Mb/d to 33.6Mb compared to 59.4Mb last year and 43.0Mb two years ago before the pandemic.
This was a very bearish weekly EIA report and as we see more seasonal inventory builds in the coming weeks, crude oil should fall US$10-15/b during Q4/21. Energy bulls are following momentum and are ignoring the industry data.
OPEC October Monthly Oil Market Report: On October 13th OPEC released their October Monthly forecast report. The key highlights were a large increase in September production and a lowering of their demand forecasts for the end of 2021 and the beginning of 2022. The increase in September production was 486,000 b/d (above their agreed to increase of 400,000 b/d). The biggest increase was from Nigeria which raised production by 156,000 b/d to 1.451Mb/d last month versus having production difficulties in August when production fell by 114,000 b/d to 1.271Mb/d. Saudi Arabia increased production by 139,000 b/d to 9.678Mb/d and Iraq raised production by 84,000 b/d to 4.139Mb/d.
Russia also increased production last month by around 100,000 b/d. So there does not appear to be a real shortage of crude, just a shortage of crude in high demand areas due to supply chain issues.
OPEC lowered Q3/21 demand forecast by 130Kb/d to 98.467Mb/d but raised Q4/21 demand by 120Kb/d to 99.7Mb/d. For 2022, they raised overall demand growth to 4.15Mb/d or to 100.76Mb/d versus 96.6Mb/d in 2021. This moving of the demand goal line into the future has been a regular occurrence this year. We see their current forecast as too optimistic due to the data on demand coming out of the US and China, the two largest energy consuming nations.
OPEC is forgetting history. Every time they have allowed a price spike to occur and did not keep prices from impacting demand, prices fell greater than 50% (just check 2008, 2014, 2018 and 2020). Demand is sluggish in the US due to weak consumer spending and is falling in China as they work to clear up the air quality ahead of the 2022 February winter Olympics, starting in less than four months.
Baker Hughes Rig Data: The data for the week ending October 8th showed the US rig count rose by five rigs (rose seven rigs in the prior week). Of the total of 533 rigs working last week, 433 were drilling for oil and the rest were focused on natural gas activity. This overall US rig count is up 98% from 269 rigs working a year ago. The US oil rig count is up 124% from 193 rigs last year at this time. The natural gas rig count is up a more modest 36% from last year’s 73 rigs, now at 99 rigs. The Permian saw an increase of three rigs (up by three rigs last week) to 266 rigs and is up 105% from 130 rigs last year at this time.
Canada had a rise of two rigs (up three rigs in the prior week) to 167 rigs. Canadian activity is now up 109% from 80 rigs last year. There were 95 oil rigs working last week, up from 39 last year. There are 72 rigs working on natural gas projects now, up from 41 last year.
The material increase in rig activity over a year ago in both the US and Canada should continue to translate into rising liquids and gas production over the coming months. The data from many companies on their plans for Q4/21 and forecasts for 2022 support this rising production profile expectation.
Conclusion:
We should see more weekly builds in Commercial Crude Stocks around the world as inventories rebuild to meet the winter 2021-2022 needs. Normal fall season builds are 2-3Mb per week. If we see any increases over 5Mb in any week (like the 6.1Mb/16.1Mb increase this week), that would put meaningful downward pressure on crude prices. The current spike in crude oil and natural gas prices is speculative in nature and is not sustainable.
Bearish pressure on crude prices:
- Covid caseloads are growing around the world. Formal vaccine documents are to be the norm in Canada going forward. In the US the death rate is >2,000/day and over 716K deaths have been reported. Worldwide the death count is now 4.87M. This pandemic has taken more lives in the US than the 1918-1919 Spanish Flu (675,000 estimated).
- Demand is under pressure as high prices for most food, rent, taxes, child care, health expenses, auto costs and other daily necessities make spending decisions tougher for consumers. So this gouge in prices will surely impact consumers’ buying behaviour in the coming months. The spending pie of consumers is shrinking and some spending habits of the past will have to be dropped. Demand destruction is on the way. This week’s EIA report confirms this.
- Global ports remain clogged with containers and delivery problems and could last into 2023 according to the CEO of Dubai’s DP World, the largest operators of ports. Some key US ports are going to 24 hours per day work schedules to clear the container blockage. However industry experts say this will not help in the short run.
Bullish pressure on crude prices:
- Speculative long investors (hedge and commodity funds) and a short squeeze on bearish positions in the futures and options markets on crude and natural gas have spiked up prices. It could go higher but as these positions are reversed, the parabolic price spike could reverse sharply on any negative news.
- Spot prices in short supply areas like Europe have lifted natural gas prices to over US$32/mcf in Europe and over US$36/mcf in parts of Asia (NYMEX today US$5.87/mcf – AECO C$4.81/mcf) as wind power is not fulfilling its need.
- Russia has increased supplies of natural gas to Europe by 15% from a year ago and will be able to meet all winter needs (recent Putin statement) once they get permission to fully open the new NordStream 2 pipeline. The Russians are starting to fill the pipeline with gas as it tests for structural integrity and plans for shipping gas for the upcoming winter, shortly after approvals are received. The German regulator still needs two months to complete certification. They should hurry in case the weather gets colder faster than expected. The Danish Energy Agency has accepted that the line can be put into operation.
CONCLUSION:
WTI has risen to US$80.62/b despite the rise in Commercial Crude Oil Stocks. We see prices as having US$15/b of speculative value which should disappear as Commercial Crude Stocks continue their seasonal build. The question for us is what is happening to world wide demand as the two largest economies in the world slow down?
Many industrial plants in China have been closed due to the high cost of fuel and the Government’s plan to lower emissions in the Beijing area for the upcoming winter Olympics from February 4th to the 20th. Clean air is needed for the event and China wants to show it is making progress on its climate initiatives. This will dampen China’s consumption of fossil fuels over the next four to six months.
Energy Stock Market: The S&P/TSX Energy Index currently trades at 157 as natural gas stocks rose sharply over the last week following the whirlwind gaping natural gas prices in the international spot market. The S&P Energy Bullish Percent Index has reached 100% again. This is a clear SELL signal. Energy stocks could fall 30-40% in the coming months.
Our October SER Monthly Report comes out next Thursday October 21st with details on the weakening general stock market and its expected impact on the energy sector.
Market pressures from many directions are a drag that are likely to change the current effervescent mood of investors. Some of these are:
- The debt ceiling battle – phase two deadline in early December,
- Rising bond yields,
- The problem of Congress’s approval of the two stimulus bills and the US$3.5T price tag,
- The planned new or increased taxes,
- Rising inflation (5.4% for US CPI in September and a whopping 10.7% surge in China’s PPI in September) are now drags on the general stock market.
- The most concerning domino which started the overall market decline appears to be the overleveraged and retrenching real estate sector in China.
We cover this in detail in our Schachter Energy Report. Over the next few months any of these events could lead to a domino effect of debt laden companies getting into trouble and financial markets declining materially. The Dow Jones Industrials Index is now at 34,880 (market peak for Dow Jones Industrials Index at 35,631 in mid-August 2021) and could fall to below 30,000 in Q4/21 and to <25,000 in Q1/22. We have already seen three down days of more than 500 points for the Dow Jones Industrials Index and expect many more in the coming months as the bullish enthusiasm swings to fear and liquidation.
If you want to receive ongoing coverage of these negative market impacts, become an SER quarterly or annual subscriber. For new people, the quarterly offering is a good way to peruse our product before you determine which subscription format makes the most sense for your needs.
If you want access to all our SER reports then you will need to become a subscriber. Go to https://bit.ly/34iKcRt to subscribe.
If you enjoy reading our weekly ‘Eye on Energy’ feel free to forward it off to friends and colleagues. We always welcome new subscribers to our complimentary macro energy newsletter.
How Democracy Ends:
COVID19 policy shows a (potential) path to the end of America
The pandemic events of 2020-2021 outline a potential pathway for a future democratically elected President of the United States to systematically end democracy. The course of events leading to this outcome need not be a repeat of the direct assault on the Capitol, but a distortion of risk of illness as a justification for military force and suspension of democratic norms.
Sometime over the next quarter century, it is inevitable that America, and all nations, will experience a cold and flu season above average. In a typical season approximately 40,000 Americans may die, but it is possible an above average season may see 80,000 or more deaths.
Inevitably some location(s) in the country will experience a surge in cases. Television news will show overworked hospital workers, and report that Intensive Care Unit beds have nearly run out– of course, ICU’s often operate near capacity, so this finding alone may not be that noteworthy, but in our attention economy, it may be sensationalized. Some afflicted individuals will be young children– typical for the flu, and these anecdotes will surely be emotionally salient. A video of a young boy or girl on life support machines may be used to show how dire things are. These events will then serve as an opportunity for a strong federal response…read more.
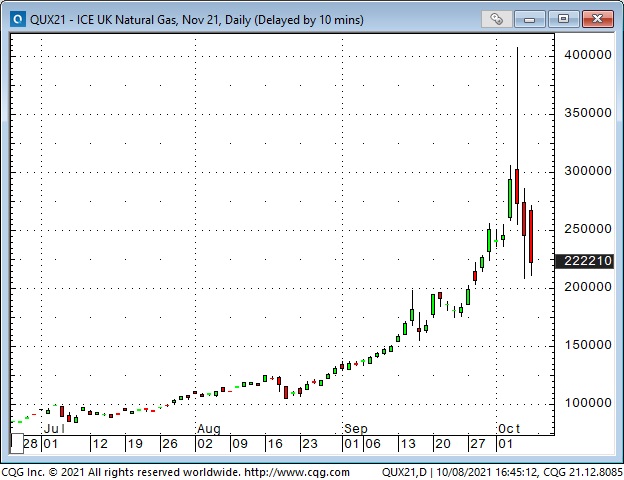
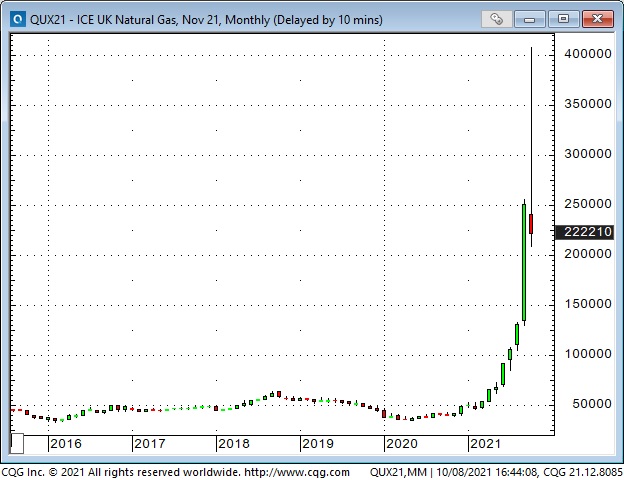
Energy prices are smoking hot
The Chart Of The Week is UK Natural Gas. Nearby futures hit All-Time highs in August – then quadrupled from there by early this week – only to fall in half by Friday (Putin indicated that Russia could increase supply.)
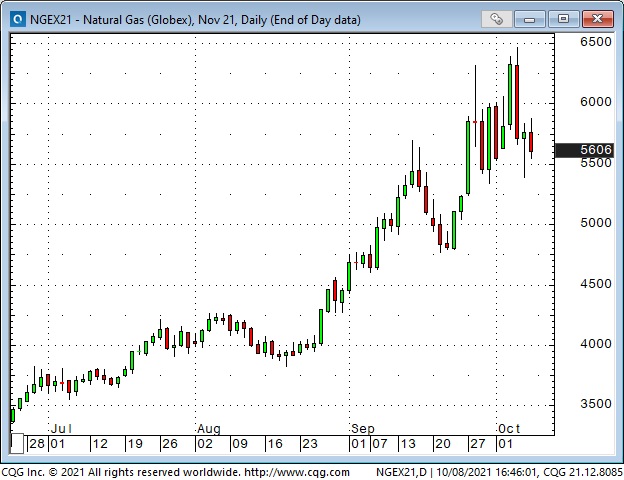
New York Natural Gas nearby futures more than quadrupled from last year’s lows – more than doubled since June. North American Natgas prices are less than half European and Asian prices, but there is no easy Arb – there is not enough capacity to move LNG across the oceans to balance the different market prices. (So – don’t buy NY Natgas just because European Natgas is going ballistic – they are two very different markets.)
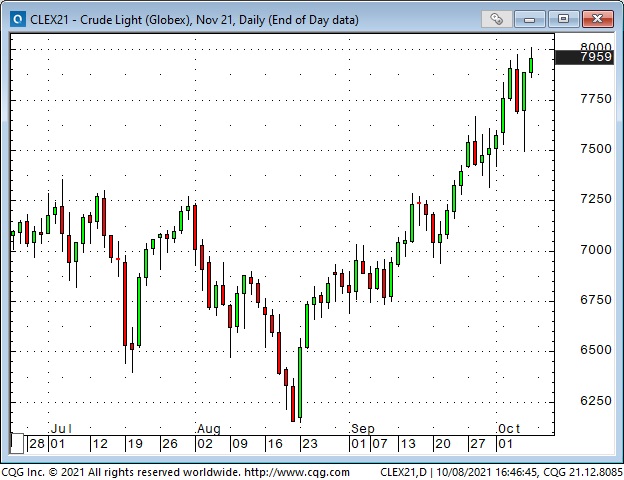
WTI nearby futures have rallied nearly 30% in the last seven weeks – hitting $80 for the first time in seven years.
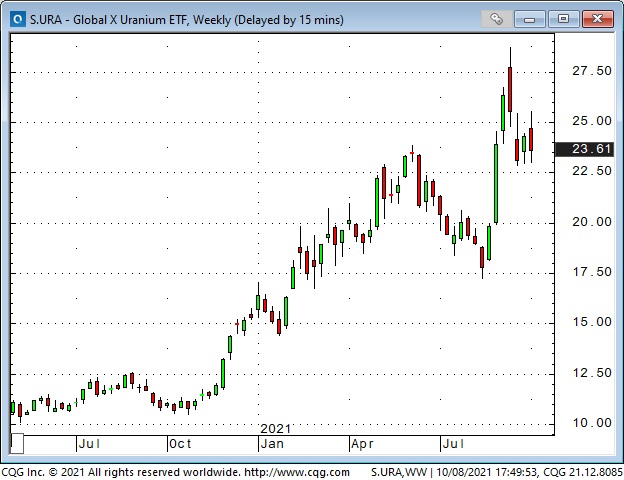
The uranium ETF doubled from January to September – hitting 7-year highs.
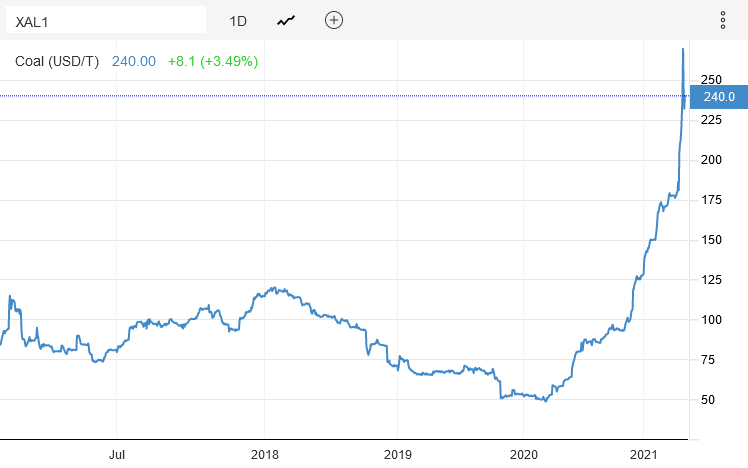
Even “dirty” coal has soared in price this year. China ordered local producers to ramp up production and decided to start buying coal from Australia (after banning Aussie coal earlier this year.) India, where 60 -70% of total electrical generation comes from coal-fired plants, is desperately short of coal.
High prices are the best remedy for high prices
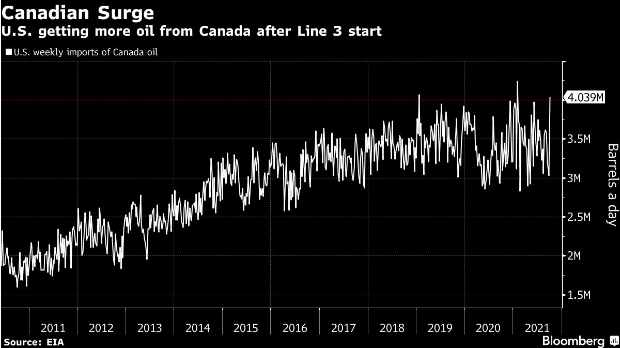
High prices (usually) dampen demand and bring forth supply. OPEC+ had the opportunity to raise their production quotas by more than the pre-planned 400,000BBL at their last meeting – but they didn’t. However, it’s easy to imagine that some OPEC+ producers will ramp up production. Canada is increasing exports to the US (chart below in the section on the CAD.) American frackers, funded with private equity, will increase production, and high prices will dampen demand – in the short term.
The COP26 conference in Glasgow October 31 – November 12
These folks want to stop the use of fossil fuels. They want governments around the world to set firm timelines to ban the use of FF. They believe that the dangers from climate change are significant enough to warrant a “transition” to non-FF energy sources that will be disruptive, messy, volatile, incredibly expensive and inflationary.
Pension funds (including the BIG ones in Canada) are dumping FF investments according to their ESG mandates. People who don’t mind social disapproval may see this as an opportunity – if they think that FF supply shortages, relative to demand, will take FF prices higher during the global energy “transition” period.
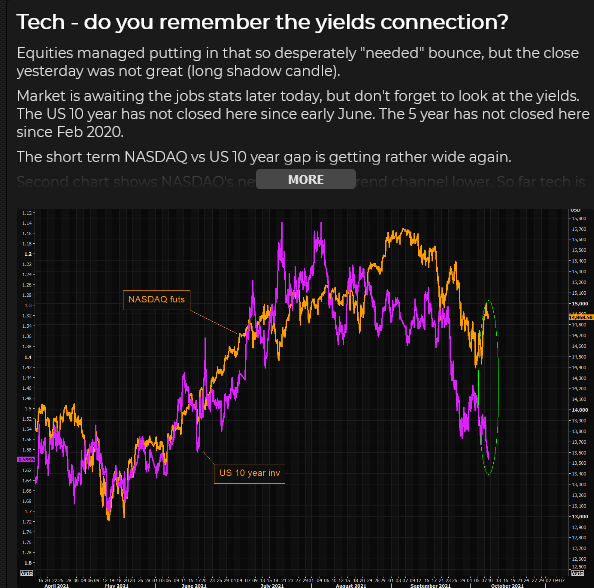
Interest rates keep rising
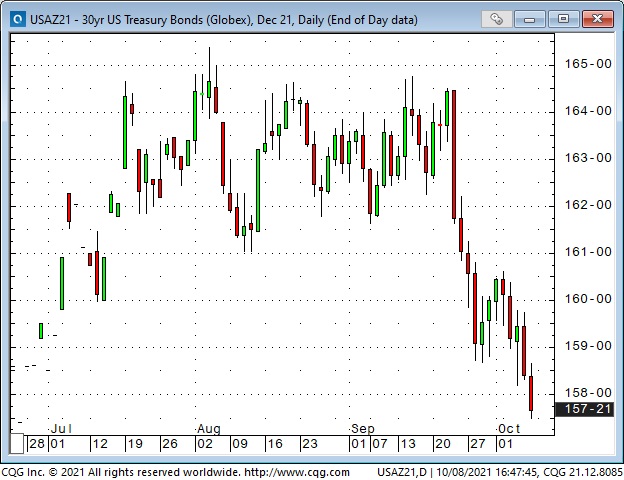
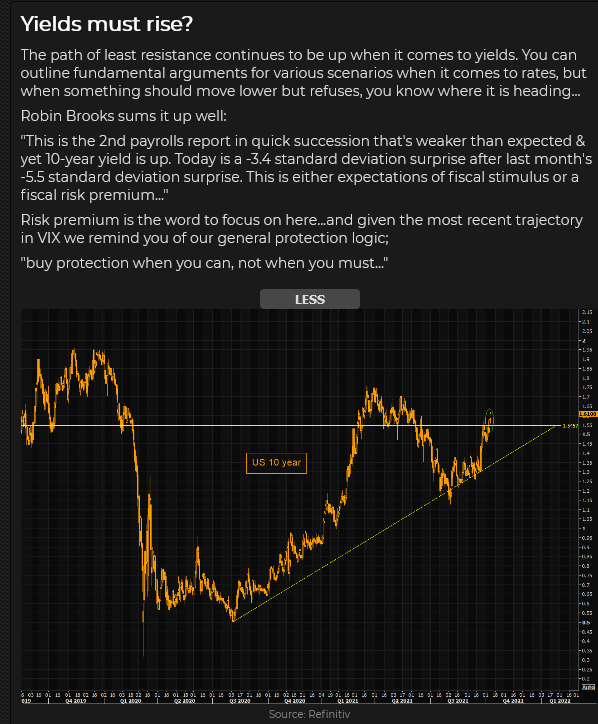
The yield on the US 10Y Treasury ended the week at a 4-month high of 1.61% – up ~40 bp from the YTD lows made in August. Rising inflationary pressures, rising prices of tangible goods (commodities, real estate) and the likelihood of less Fed “Q” in the future pressured bond prices. For the last few weeks, stocks and bonds have both trended lower.
This is a chart of the long bond futures contract at the CBOT. Falling prices mean rising yields.
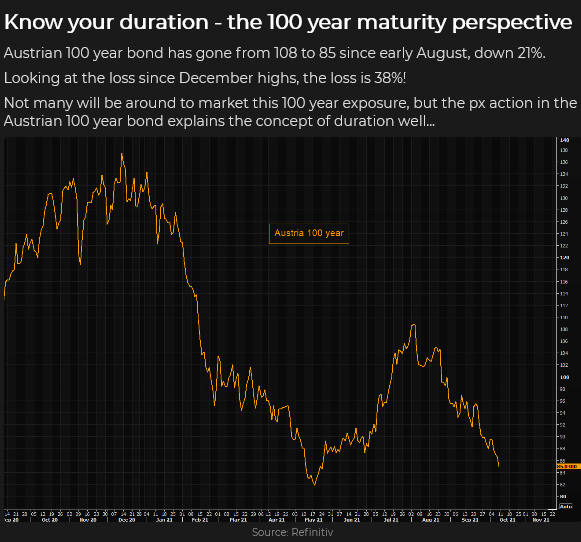
This is a chart of the famous 2-Billion Euro 100-year bond issued by Austria last year with a yield (at issue) of 0.88%. As interest rates have inched higher, prices on this bond have plummeted! Longer duration bonds make more “dynamic” price moves than shorter-duration bonds.
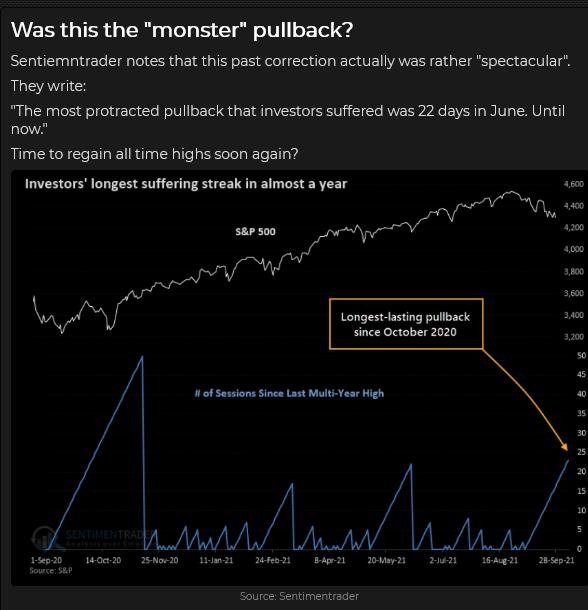
Stock indices hit a low early in the week and bounced
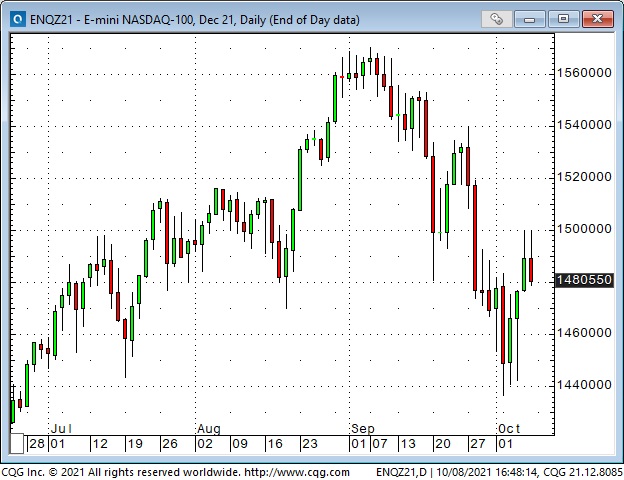
The Nasdaq (with a heavy weighting of long-duration tech stocks) has been the weakest of the major indices the past few weeks, but all of the major North American indices are down from their recent All-Time highs.
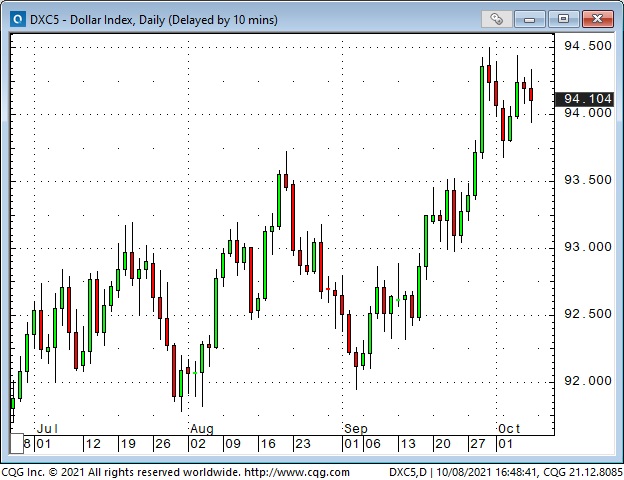
The US Dollar Index remains near 1-year highs
The USD has been strong against the Euro and the Yen the past few weeks. The CAD and the NOK have rallied against the USD on higher oil prices.
The CAD traded above 80 cents on Friday for the first time in two months as the Canadian September employment report was much stronger than the American report. Rising energy markets and rising commodity indices have also given the CAD a boost. Interest rates are higher in Canada than in the US, and the BoC looks set to continue with its tapering program. (Can 5Yyields = 1.26%, US 5Yyields = 1.06%.)
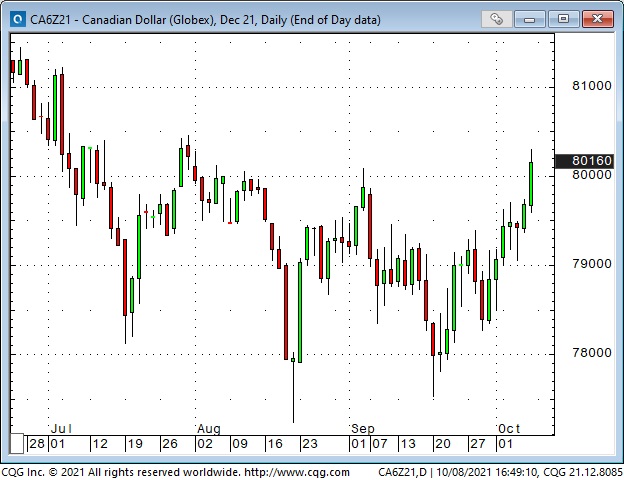
The new Enbridge Line 3 oil pipeline from Alberta to Wisconsin has begun operation and will significantly increase Canada’s ability to generate revenue from exporting crude to the USA. This increase in crude exports should be positive for Canada’s trade balance and, therefore, another boost for the CAD.
My short term trading
The only position I carried over from last week was long AUD calls. I closed the trade for a slight loss Friday. When I closed the trade, the AUD was about 20 ticks higher than when I entered the trade but time decay over the past two weeks resulted in a loss. I had been looking for the AUD to trade towards 74 cents (booming commodity markets and a nice double bottom), but it wasn’t happening, so I hit the sell button – the trade wasn’t working.
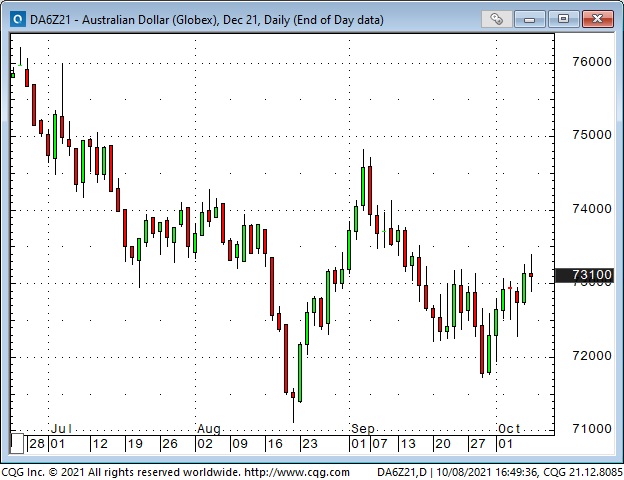
Part of my thinking on the AUD trade was that speculators were record short of the AUD – if it started to rally, those shorts might begin to cover, which could accelerate the rally. I may look for another opportunity to buy the AUD.
Last week, in the “On my radar” section, I wrote that the strong rebound in the stock indices on Friday, October 1, may have signalled the beginning of a bounce. I bought the S+P on Monday after the market dropped ~60 points from Friday’s close. I had a reasonably tight stop that nearly got hit overnight, but the trade looked great once the Tuesday day session began. I moved my stops higher to lock in a modest profit.
At Tuesday’s best levels, I was ahead ~70 points, and I thought if the market rallied above Friday’s strong close that it could run higher. I had to stay with the trade.
The market fell back from that 70 point gain late in the day, weakened more overnight, and stopped me out for only a 16 point gain.
I bought the S+P and the Nasdaq 100 mid-day Wednesday after the market had recovered from overnight lows and sold those positions for a decent gain on the Thursday opening. I ended the week flat. My P+L was up ~0.75% on the week.
On my radar
The popular thinking seems to be that inflation is running hotter than the Fed expected and will not be transitory. Inflationary pressures are coming from re-opening demand and supply chain shortages and the effects of “too much” monetary and fiscal stimulus. I wonder how much of that “popular thinking” is already in the price.
I’m happy to start next week with no position and watch price action with an open mind, but my bias is that the “energy crisis” headlines are the sort of thing that happens just before a correction.
China
I watched several excellent video interviews on Hedgeye this week that got me re-thinking my position on China. Is it possible that China is “fragile” in the Nassim Taleb sense of the word? The government is obsessed with control – and the market tends to believe that the Chinese government gets what it wants (at least within China.) What if that’s not true? Real estate accounts for ~70% of retail investment. The astonishing growth in China over the past 20 years has been debt-financed.
Does the ROW want to have less to do with China? Do you want to put your money / your people into China? (Think hostage diplomacy.) Does China want to have less to do with the ROW? China has been a big part of global GDP (and a HUGE part of commodity demand), but what if Xi leads China to withdraw (somewhat) into itself? What if the “China is going to take over the world” story is based upon a Potemkin Village?
Thinking about China in this way reminds me of how Japan was going to take over the world in the late 1980s – and didn’t. The parallels to today’s China may be weak on specifics, but I’m thinking in terms of market psychology, and we’ve seen this movie before.
Powell
His term is up at the end of January 2022 – Biden will soon have to re-appoint him or nominate someone new. If he is not re-appointed, then his replacement will likely be even more dovish on monetary policy (and more hawkish in terms of regulation.) In one of those Hedgeye interviews, Grant Williams wondered if maybe the Dems want to remake the Fed like Trump transformed the Supreme Court. Powell looked like a sure thing a couple of months ago, but with the trading scandals and Elizebeth Warren scolding him, maybe he’s a 50/50 bet now.
This photo and caption are from The Macrotourist.
Thoughts on trading
I spend a lot of time reading opinion pieces and research reports, watching market videos and listening to podcasts – but I’m not looking for buy and sell recommendations. I’m hoping to get an idea that will start me thinking about a market in a way that is new to me – an idea that will have me asking myself, “Where’s the trade?”
When I spoke at investment conferences, I knew that people wanted buy recommendations, especially recommendations that supported trades they had already made.
The problem with buy/sell recommendations is that they are only a tiny part of the trading process. There is SO much more to trading! For instance, How much do you buy? When do you buy? How do you execute the trade? What is your time horizon? What is your risk tolerance? What do you do as time passes and the market changes? What gets you out of the trade? Does the trade create a concentration problem?
I also spend a lot of time looking at charts. I especially like to create different “pair” charts (this comes from trading currencies a lot over the years.) For instance, I can look at the CAD in terms of the USD, but what does it look like in terms of the EUR, YEN, or AUD? What does the S+P look like in terms of a commodity index?
I can spend a lot of time doing these things and not find any good trading ideas. I’m ok with that. It’s part of my trading process.
Quotes from the notebook
Last week I wrapped up the Notes with a few quotes from my notebook. I’ve got 100s of quotes that I’ve collected over the years – maybe the quotes will become a regular feature.
Research is essential, but the tactics you use around the research are what makes money. Bill Fleckenstein RTV Jan 2020 (My comment: What you do with a trade once you have it on is more important than what got you into the trade in the first place.)
You gotta know when to be a pig. Stan Druckenmiller (I think that quote was in the first Market Wizards book. 1989.) (My comment: sometimes you have to step up your size. Rarely, but sometimes.)
Too many hedge funds are simply leveraged beta masquerading as alpha. Kevin Muir The Macrourist 2015 (My comment: Hedge funds travel in packs.)
It’s not a question of enough, Pal. It’s a zero-sum game. Someone wins. Someone loses. Money itself isn’t lost or made; it’s simply transferred from one perception to another. Gordon Gekko, Wall Street 1987 (My comment: I love this quote! Perceptions change. The trader with the correct perception, for that point in time, wins.)
Subscribe: You have free access to everything on this site. Subscribers receive an email alert when I post something new – usually 4 to 6 times a month.
Victor Adair retired from the Canadian brokerage business in 2020 after 44 years and is no longer licensed to provide investment advice. Therefore, this blog, and everything else on this website, is not intended to be investment advice for anyone about anything.
Each week Josef Schachter gives you his insights into global events, price forecasts and the fundamentals of the energy sector. Josef offers a twice monthly Black Gold (SER) newsletter covering the general energy market and 30 energy, energy service and pipeline & infrastructure companies with regular updates. We also hold quarterly webinars and provide Action BUY and SELL Alerts for paid subscribers. Learn more.
EIA Weekly Data: The EIA data on Wednesday October 6th surprised energy bulls once again with increases in Commercial Crude OIl Stocks of 2.3Mb (forecast was for a decline of 0.4Mb), and an increase in US crude production of 200Kb/d as US production recovered to 11.3Mb/d (just short of the 11.5Mb/d before the hurricanes started). We have been highlighting these potentials over the last number of issues and they are now occurring. This should put a cold shower on the crude bulls and drive prices down below US$70/b in the near future.
In detail:
- Commercial Crude Oil Stocks rose by 2.3Mb on the week to 420.9Mb. Energy bulls point to this being 72.0Mb below last year’s pandemic level, but it is close to the 422.6Mb seen at this time in 2019. So we don’t see crude inventories as too low. Gasoline inventories rose by 3.3Mb to 225.1Mb and are close to the 230.0Mb in storage at this time in 2019.
- Refinery Activity rose 1.5 points to 89.6% from 88.1% last week as Gulf Coast refineries increased activity. This is now above pre-pandemic levels of 85.7% at this time in 2019.
- In the coming months we expect to see US crude oil production rising and reaching 12.0Mb/d as the drilling pace picks up sharply and much of the remaining shut in offshore production returns. This week’s level of 11.3Mb/d (up 200Kb/d this week) supports this view.
- Demand for all products rose last week. Total Product Demand rose 1.135Mb/d to 21.526Mb/d as Distillate Demand rose 392Kb/d and Other Oils rose by 390Kb/d. Gasoline consumption picked up a modest 28Kb/d to 9.274Mb/d while Jet Fuel Consumption rose by a decent 267Kb/d to 1.694Mb/d (1.76Mb/d consumed in 2019 at this time). Cushing Inventories rose by 1.5Mb/d to 35.5Mb compared to 56.5Mb last year and 41.7Mb two years ago.
This was on an overall basis a bearish report and as we see more seasonal inventory builds in the coming weeks, crude oil should fall US$10-15/b during Q4/21.
OPEC October Supply Meeting: OPEC met on Monday October 4th and approved their originally planned 400,000 b/d increase in quotas. This was despite significant pressure for larger volume increases from the US, China and India, their biggest consumers. Crude oil bulls rejoiced and pushed WTI up to a new 2021 high of nearly US$79.50/b on Monday with the support of short covering and margin calls on bearish futures and options traders, who were required to reverse their positions or add to their margin capital. The basic problem with the 400,000 b/d monthly increase is that some of the members getting higher quotas do not have capacity to raise production. For example in August OPEC increased quotas by 400,000 b/d but only 151,000 b/d of new oil was brought on (the Saudis +69K b/d, UAE +55K b/d, Iraq +90K b/d and Angola +43K b/d). On the downside, producers such as Nigeria decreased production by 114K b/d and the Congo by 14K b/d. It is unlikely that the full 400Kb/d was brought on in September (data to be released Wednesday October 13th). If OPEC wanted to, just Iraq, Kuwait, Saudi Arabia and UAE could increase production almost immediately by 3-4Mb/d. This would lower crude prices and keep pump prices reasonable. If not, demand will fall even more sharply than is now likely. The current short-term OPEC greed pricing will surely fall to depressed prices again and hurt OPEC members severely. Don’t they remember 2009 and early 2020?
OPEC is forgetting history. Every time they have allowed a price spike to occur and did not keep prices from impacting demand, the price of crude after spiking, fell greater than 50% (just check 2008, 2014, 2018 and 2020). Demand is sluggish in the US and is falling in China as they work to clear up the air quality ahead of the 2022 February winter Olympics starting in less than four months.
Baker Hughes Rig Data: The data for the week ending October 1st showed the US rig count rose by seven rigs (rose nine rigs in the prior week). Of the total of 528 rigs working last week, 428 were drilling for oil and the rest were focused on natural gas activity. This overall US rig count is up 98% from 266 rigs working a year ago. The US oil rig count is up 126% from 189 rigs last year at this time. The natural gas rig count is up a more modest 34% from last year’s 74 rigs, now at 99 rigs. The Permian saw an increase of three rigs (up one last week) to 263 rigs and is up 104% from 129 rigs last year at this time.
Canada had a rise of three rigs (up eight rigs in the prior week) to 165 rigs. Canadian activity is now up 120% from 75 rigs last year. There were 97 oil rigs working last week, up from 37 last year. There are 68 rigs working on natural gas projects now, up from 38 last year.
The material increase in rig activity over a year ago in both the US and Canada should continue to translate into rising liquids and gas production over the coming months. The data from many companies on their plans for the Q4/21 and forecasts for 2022 support this rising production profile expectation.
Conclusion:
We should see more weekly builds in Commercial Crude Stocks around the world as inventories rebuild to meet the winter 2021-2022 needs. Normal fall season builds are 2-3Mb per week (as we saw this week). If we see any increases over 5Mb in any week, that would put meaningful downward pressure on crude prices. The current spike in prices was speculative in nature and is not sustainable.
Bearish pressure on crude prices:
- Covid caseloads are growing around the world. Just note the challenges faced in Alberta. Formal vaccine documents are to be the norm in Canada going forward. In the US the death rate is >2,000/day and over 703K deaths have been reported. Worldwide the death count is now 4.81M. This pandemic has taken more lives in the US than the 1918-1919 Spanish Flu (675,000 estimated).
- Demand is under pressure as high prices for most food and other daily necessities make spending decisions tougher for consumers. Yesterday, I filled our car, spending over C$71 to fill it – the first over $70 fill in years. Normally C$50 would have done it. So this gouge in prices will surely impact most consumers buying behaviour in the coming months.
- Global ports remain clogged with containers and delivery problems could last into 2023 according to the CEO of Dubai’s DP World, the largest operators of ports.
Bullish pressure on crude prices:
- A short squeeze on bearish positions in the futures and options markets on crude and natural gas has spiked up prices. It could go higher but as these positions are reversed, the parabolic price spike could reverse sharply on any negative news.
- Spot prices in short supply areas like Europe have lifted natural gas prices to over US$32/mcf in Europe and over US$36/mcf in parts of Asia (NYMEX today US$5.84/mcf – AECO C$4.87/mcf).
- Russia has held back supplies of natural gas to Europe as they pressure the EU and Germany to open the new NordStream 2 pipeline. The Greens and the Free Democrats, planning to join the new Government, are against the project. Opening the pipeline should end the shortage of natural gas on the continent. Once the political maneuvering is over this should start up. The Russians are starting to fill the pipeline with gas as it tests for structural integrity and plans for shipping more gas for the upcoming winter. The German regulator still needs three months to complete certification. The Danish Energy Agency has accepted that the line can be put into operation.
CONCLUSION:
WTI has fallen to US$75.48/b (down US$1.48/b) due to the rise in Commercial Crude Stocks. We see prices as having over US$15/b of speculative value which should disappear as Stocks continue their seasonal build. The question for us is what is happening to world wide demand as the two largest economies in the world slow down?
Many industrial plants in China have been closed due to the high cost of fuel and the Government’s plan to lower emissions in the Beijing area for the upcoming winter Olympics from February 4th to the 20th. Clean air is needed for the event and China wants to show it is making progress on its climate initiatives. This will dampen China’s consumption of fossil fuels over the next four to six months.
Energy Stock Market: The S&P/TSX Energy Index currently trades at 149 as natural gas stocks rose sharply over the last week following the whirlwind gaping natural gas prices in the international spot market. The S&P Energy Bullish Percent Index has reached 100% again. This is a clear SELL signal. Energy stocks could fall 30-40% in the coming months.
Our October SER Interim Report comes out tomorrow Thursday October 7th with details on the weakening general stock market and its expected impact on the energy sector.
Market pressures such as the debt ceiling battle in the US, rising bond yields, the problem of Congress’s approval of the two stimulus bills and the US$3.5T price tag, the planned 40 new or increased taxes, and rising inflation are now drags on the general stock market. The domino starting the overall market decline appears to be the overleveraged and retrenching real estate sector in China. Following on this problem is the very politically tough situation in the US as all Republicans are opposed to the Biden Human Infrastructure proposal and a few moderate Democrats are also opposed. Liberals and progressives want a bigger package and moderates want to see it lowered in price and fully paid for with taxes. The next few weeks could see some of the Biden policy agenda face defeat which could rock the financial markets.
We cover this in detail in our Schachter Energy Report. Over the next few months any of these events could lead to a domino effect of over leveraged companies getting into trouble and financial markets declining materially. The Dow Jones Industrials Index is now below 34,000 (market peak for Dow Jones Industrials Index at 35,631 in mid-August 2021) and could fall to below 30,000 in Q4/21 and to <25,000 in Q1/22. As predicted, we have already seen three down days of more than 500 points for the Dow Jones Industrials Index and expect many more in the coming months.
If you want to receive ongoing coverage of this possibility, become an SER quarterly or annual subscriber. For new people, the quarterly offering is a good way to peruse our product before you determine which subscription format makes the most sense for your needs.
If you want access to all our SER reports then you will need to become a subscriber. Go to https://bit.ly/34iKcRt to subscribe.
If you enjoy reading our weekly ‘Eye on Energy’ feel free to forward it off to friends and colleagues. We always welcome new subscribers to our complimentary macro energy newsletter.
-
I know Mike is a very solid investor and respect his opinions very much. So if he says pay attention to this or that - I will.
~ Dale G.
-
I've started managing my own investments so view Michael's site as a one-stop shop from which to get information and perspectives.
~ Dave E.
-
Michael offers easy reading, honest, common sense information that anyone can use in a practical manner.
~ der_al.
-
A sane voice in a scrambled investment world.
~ Ed R.
Inside Edge Pro Contributors

Greg Weldon

Josef Schachter

Tyler Bollhorn

Ryan Irvine

Paul Beattie

Martin Straith

Patrick Ceresna

Mark Leibovit

James Thorne

Victor Adair