
Op/Ed
Each week Josef Schachter gives you his insights into global events, price forecasts and the fundamentals of the energy sector. Josef offers a twice monthly Black Gold newsletter covering the general energy market and 30 energy, energy service and pipeline & infrastructure companies with regular updates. We also hold quarterly webinars and provide Action BUY and SELL Alerts for paid subscribers. Learn more.
EIA Weekly Oil Data: The EIA data of Wednesday January 5th was seen by the market as positive for energy prices as US Commercial Crude Stocks fell 2.1Mb (better than the forecast of a decline of 3.2Mb). Refinery Utilization was at 89.8%, above the 80.7% level of a year ago but below the 93.0% of two years ago. Total Motor Gasoline Inventories rose a massive 10.1Mb on the week while Distillate volumes rose 4.4Mb as demand weakened after the Christmas holiday season. US Crude Production remained at the recent high of 11.8Mb/d. US Exports fell last week by 375Kb/d and for the week a total of 2.6Mb. This was the reason for the inventory miss versus forecasts. The key bearish feature of the week was that Total Demand fell by 2.55Mb/d to 19.67Mb/d (in the first week of 2020 demand was 19.92Mb/d) with Motor Gasoline demand falling 1.55Mb/d or to 8.17Mb/d (in early 2020 demand was 8.96Mb/d). Jet Fuel Consumption fell 122Kb/d to 1.47Mb/d compared to 1.97Mb/d in early January 2020 before the pandemic hit. Cushing Inventories rose 2.6Mb to 37.3Mb/d. Overall we would rate this week’s data as negative for energy prices.
EIA Weekly Natural Gas Data: Weekly withdrawals started six weeks ago as winter demand initiated the withdrawal season. Last week Thursday’s data showed a heavy cold weather withdrawal of 136 Bcf, lowering storage to 3.226 Tcf. The biggest US draws were in the Midwest (45 Bcf), the South Central (39 Bcf) and the East (32 Bcf). The five-year average for last week was a withdrawal of 121 Bcf and in 2021 was 114 Bcf. Storage is now 0.6% above the five-year average, so the US is not facing a natural gas shortage as is seen in Europe and Asia. NYMEX today is US$3.81/mcf, due to the frigid Arctic weather. AECO spot is trading at $3.94/mcf. This week’s natural gas data (out tomorrow) is likely to show a large draw of over 130 Bcf last week due to the cold weather and high heating needs. With the two key winter months for natural gas demand now here (January and February) we should expect large price moves to the upside on very cold days. Spikes over $6/mcf are likely to occur when weekly withdrawals of over 200 Bcf are seen. After winter is over natural gas prices should retreat and if the general stock market decline unfolds as we expect, a great buying window could develop at much lower levels for natural gas stocks in Q2/22.
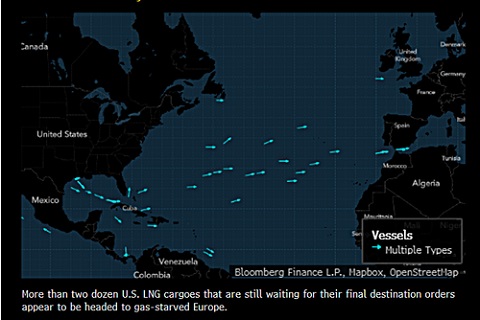
The US is now the largest LNG exporter in the world (11.9Bcf/d) and has been sending a record number of LNG tankers to Europe to alleviate the tight supply situation there. Prices have risen again in recent days as Russia holds back volume increases (keeping to contracted volumes only) as it adds pressure on EU countries to deal with the Ukraine issue in their favour. Higher volumes can be sent to Europe quickly as the Nord Stream 2 pipeline is fully operational. It just needs the final German and EU bureaucratic approvals. Russia’s overall natural gas export volumes are up as it has regularly increased exports to China.
Baker Hughes Rig Data: The data for the week ending December 31st does not look to have been updated. We should have good data this Friday and next week’s report should be accurate.
Conclusion:
Bearish pressure on crude prices:
- The US Federal Reserve is ending its bond purchases in March 2022 which will remove 6%+ of monetary stimulus from the economy. Forecasters now expect three increases in rates in 2022 and three in 2023, so that the terminal Federal Funds rate will rise to 2.3% from 0.25% currently. It is likely that we will see a weaker US economy this year.
- Omicron Covid-19 caseloads are growing around the world with record infection rates. The US hit 1M new Covid cases per day. Hospital systems are near or at capacity and medical staff shortages are rising due to infections, burnout and quitting. Medical authorities are now focusing on ICU admissions for their measurement data of the severity of the pandemic. Deaths in the US have reached 828K and worldwide 5.45M. China has tightened travel restrictions that may last for at least six months and slow their economy down.
- Energy demand (as seen in this week’s EIA data) is under pressure as high prices for most food, rent, taxes, child care, health expenses, auto costs and other daily necessities make spending decisions tougher for consumers. Demand destruction is underway.
- China is buying more oil from sanctioned Iran which leaves less oil to be purchased from Saudi Arabia and other OPEC members. The main reason is price, which Iran is offering at >US$4/b less than the ICE Brent price. In addition (also helped by China buying their discounted oil) Venezuela is lifting its production with the help of Iran which is selling them diluent so that they can sell more exportable grades. According to Bloomberg, in December they reached 1Mb in one day and exported 619Kb/d in the month.
Bullish pressure on crude prices:
- OPEC met on January 4th and agreed to lift February production by their 400,000 b/d long-term plan. They see demand increasing and that the Covid pandemic will not decrease demand this year. They expect global demand to rise by 4.2Mb/d this year. OPEC+ hold their next meeting on February 2nd.
- While approving an increase of 400,000 b/d of new production for February 2022, OPEC has not achieved that increase in December. For the last five months they have missed their targeted 400Kb/d as many of their members do not have spare capacity due to underinvestment. The December data will be released by OPEC on January 18th. Since the restart of the 10Mb/d of cutbacks post the pandemic build in inventories, OPEC+ has reintroduced 7Mb/d, leaving 3Mb/d to add over the next seven months.
- The Iran deal is not seeing progress as the Iranians continue to want removal of sanctions to sell oil, but do not want to slow down their nuclear weapons program or allow intrusive UN inspections. The bulls are rejoicing that the 1-2Mb/d of new Iranian oil that could come on is now more unlikely.
- Libya has implemented a force majeure on exports as they face delayed elections (maybe one month) and violence. Recently oil exports fell by 200Kb/d as they had infrastructure difficulties. Many of their pipelines have had insufficient maintenance.
- Once the ground is frozen for tank battles, Russia is likely to invade Ukraine which will result in additional sanctions being added to pressure Russia to desist. Russia may face OECD blockages on sales of crude oil. Natural gas is a different story as Russia is the main provider.
CONCLUSION:
WTI rose over the last week due to strong winter demand for heating oil in Europe and Asia (cheaper than natural gas) which raised crude prices to US$77.84/b from US$75.61/b last week. The bulls are watching the high international natural gas prices versus crude and OPEC’s positive crude oil demand outlook. We remain focused on the health and strength of the US and China economies (the largest two in the world). We still see crude oil prices having US$20+/b of speculative value which should disappear as demand weakens once winter is over. Leveraged speculative longs in crude oil futures are vulnerable to nasty margin calls and this should add momentum to the recent downside pressure. As the worst winter weather subsides, the price of crude should retreat towards US$62-65/b. More downside is likely if the US and China economies stagnate and/or fall into recession.
Energy Stock Market: The S&P/TSX Energy Index currently trades at 173. Oil stocks are more vulnerable than natural gas stocks when winter ends and the crude bubble bursts. Energy companies with over-leveraged balance sheets should feel the most downside risk. The S&P Energy Bullish Percent Index today is at 95.24% or in SELL territory. Caveat Emptor!
Note: we are working towards returning to Mount Royal University (MRU) on October 22, 2022 for our ‘Catch the Energy’ Conference. We will be discussing the protocols on attendance, food service, masking and QR code verification with MRU in Q1/22 and will move forward with the event after having cancelled it for the last two years. We look forward to adding more companies and focus the event on attendees having safe and maximum, face to face time with management. More on this to come.
Our next quarterly webinar will be held on Thursday February 24th at 7PM MT.
If you would like to access our 2022 Forecast Report (which came out December 16th), all previous reports and the webinar archives, go to https://bit.ly/34iKcRt to subscribe.
Please feel free to forward our weekly ‘Eye on Energy’ to friends and colleagues. We always welcome new subscribers to our complimentary macro energy newsletter.
Here’s what I really think
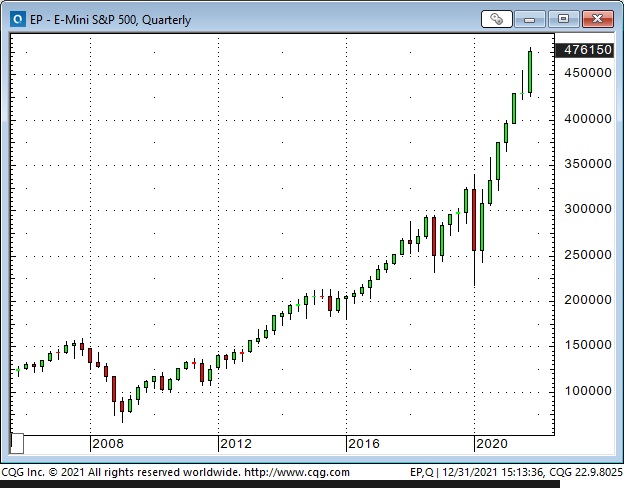
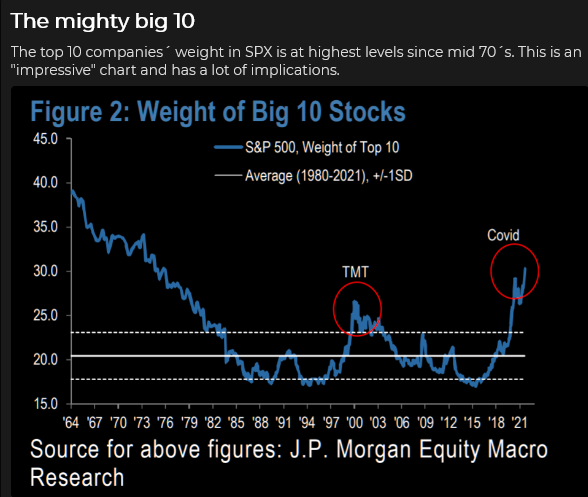
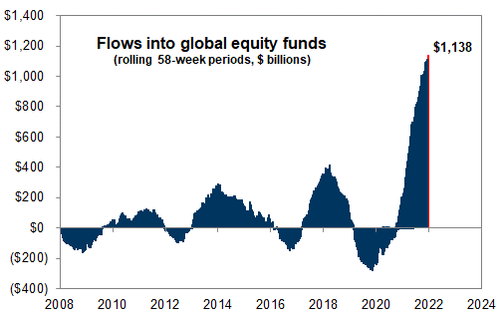
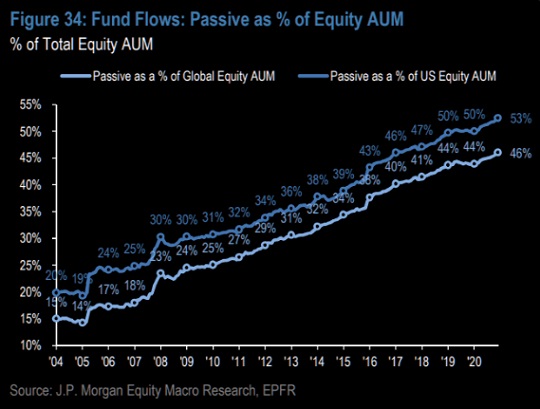
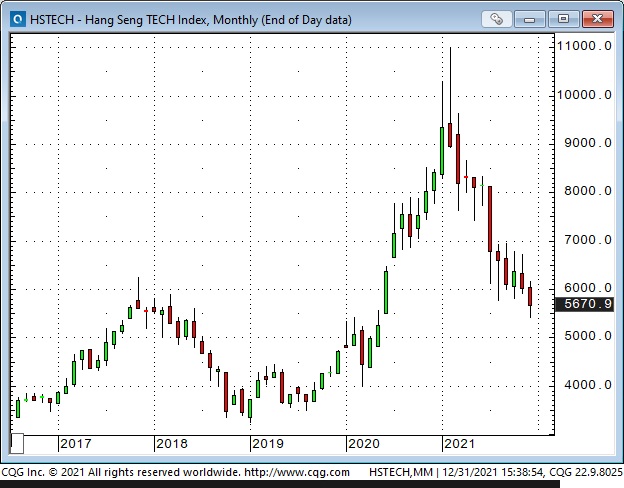
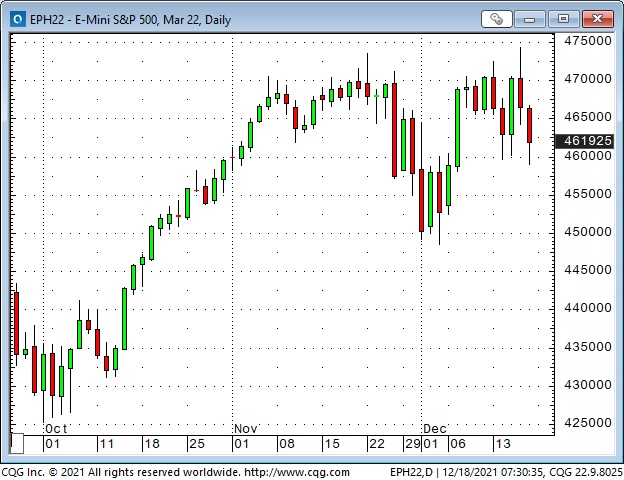
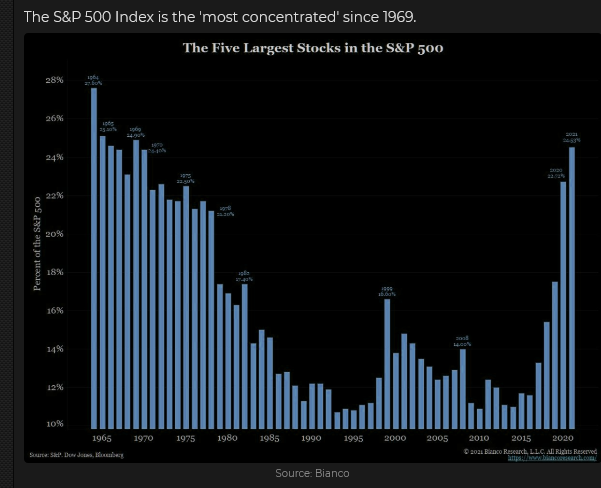
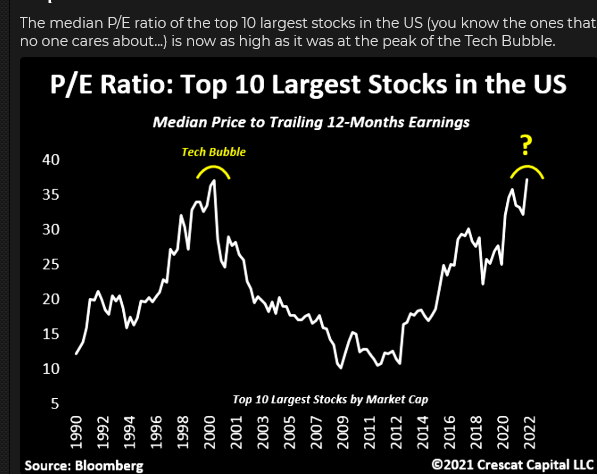
We’ve had an extraordinary run of bullish enthusiasm since the March 2020 Covid panic lows. The S+P has rallied ~120%. A tidal wave of new money has come into the equity markets, with more than half of that going into passive index-linked investments. A handful of (richly-valued) Big Cap Tech stocks account for a HUGE percentage of the index gains. People think stocks only go up – that corrections are great opportunities to buy more shares at bargain prices. I think that’s going to change.
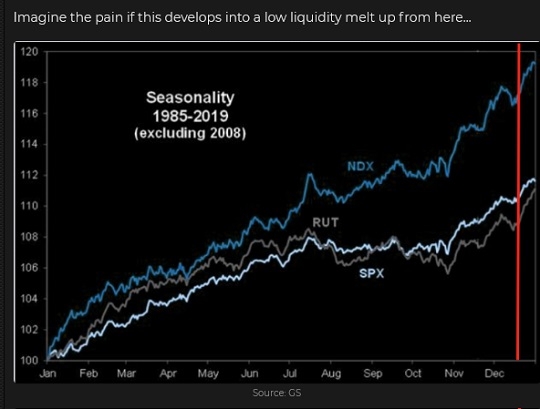
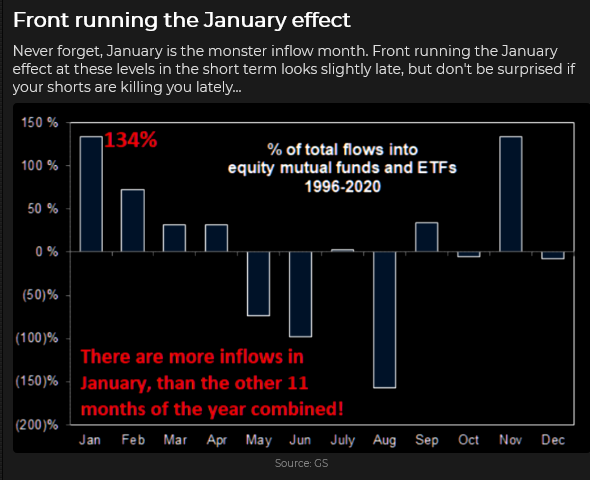
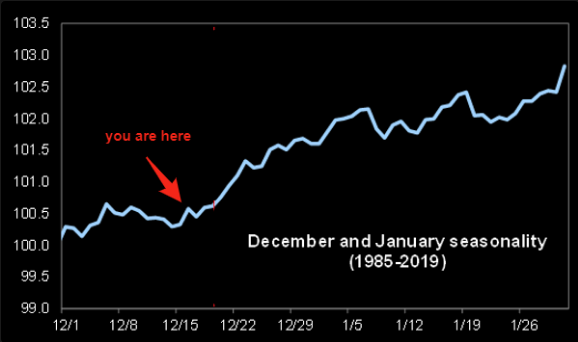
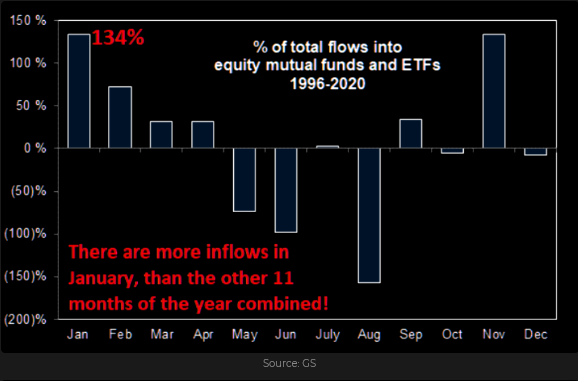
The current market psychology reminds me of late 1999, and I think we will see a severe correction sometime within the next few months. It could start as early as next week. The “Santa rally” from the December 20 lows looks like people front-running an anticipated flood of new cash coming into the market in January. Where do you think we are in the full market cycle?
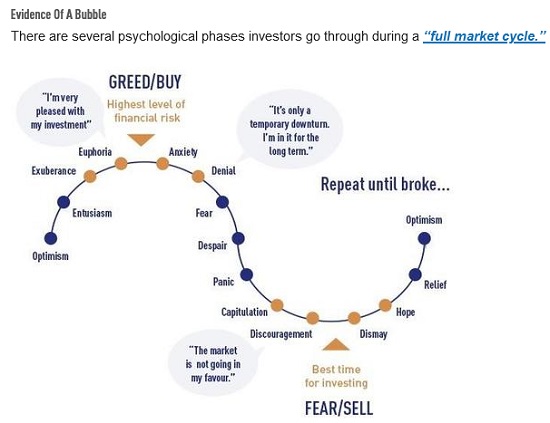
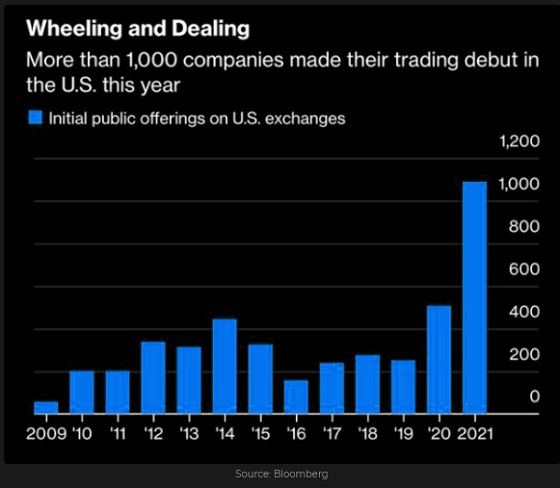
There have been many expressions of extraordinary bullish enthusiasm, including a HUGE increase in the buying of short-dated call options. IPOs have also taken advantage of risk-on investor psychology. (Bob Farrell: The public buys the most at the top.)
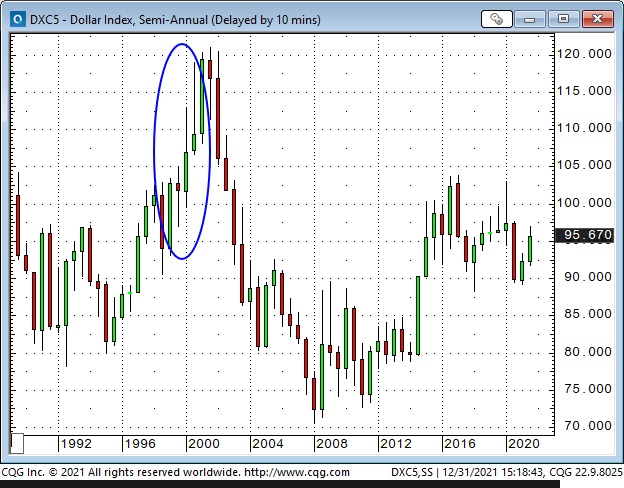
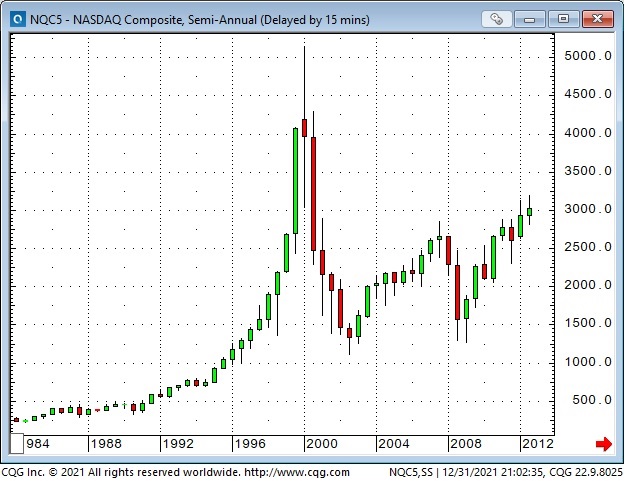
The leading American stock indices have HUGELY outperformed stock indices in the Rest Of The World – because of Big Cap Tech. Again, this reminds me of 1999 when capital flowed from the ROW to the American markets. Those foreign capital flows added to the buying pressure on the US stock indices and helped boost the US Dollar Index to a 15 year high. It was a classic virtuous circle. Note what happened to the USD and the Nasdaq when the momentum blew out.
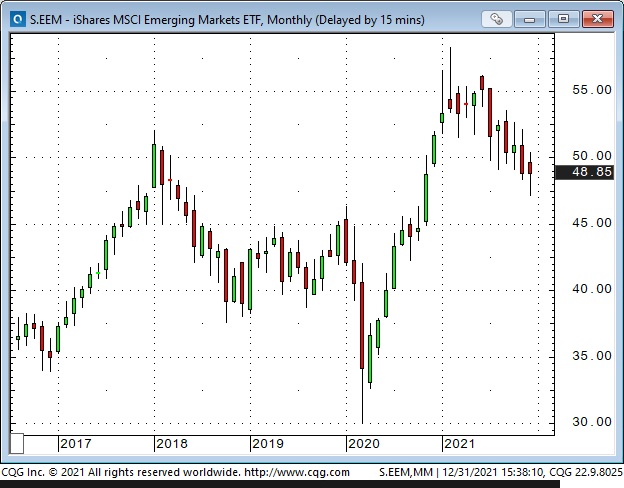
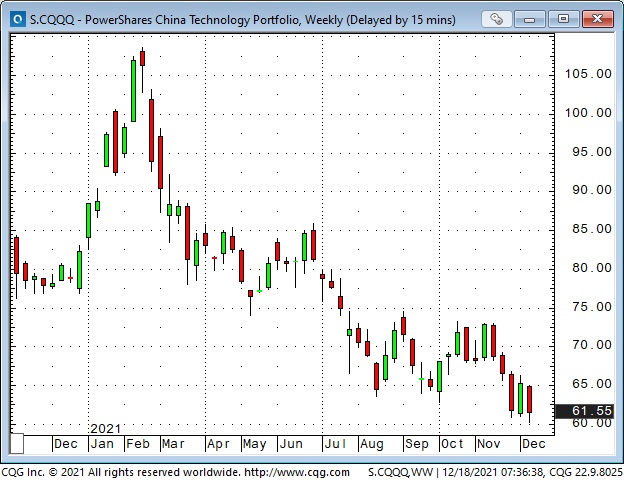
Emerging markets had a big bounce in 2020 but HUGELY under-performed the American markets in 2021. Part of the blame for that was China’s “common prosperity” policies.
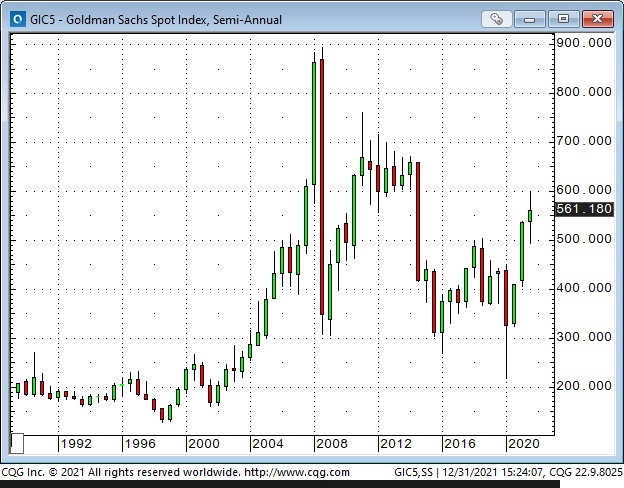
Commodity markets have also been “hot” since hitting a 20-year low during the Covid panic of March 2020. The Goldman Sachs commodity index rallied ~175% from March 2020 to October 2021 (when WTI hit $85.)
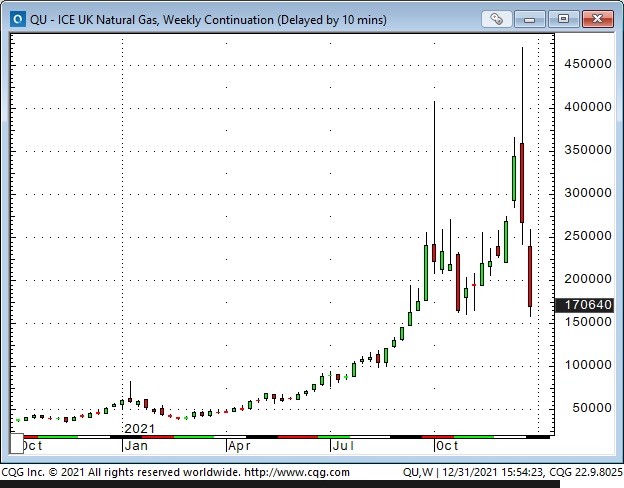
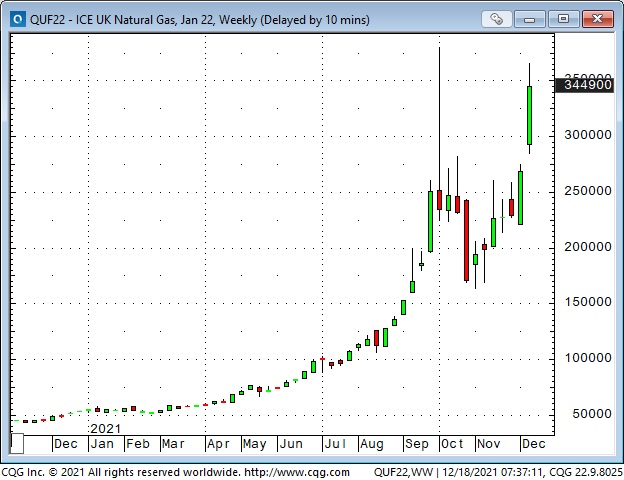
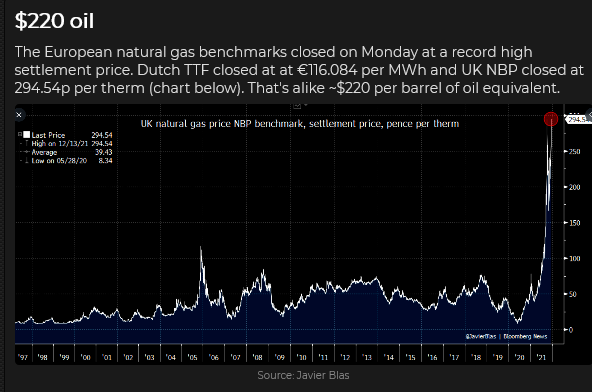
Back in the day, “energy” used to be ~20% of the S+P; lately, it’s been more like 2%. I anticipate that the volatility we’ve seen recently in European NatGas prices may be “just the start” of wild fluctuations in the energy markets in the future. NatGas in Europe was trading at ~10X North American prices – selling at the equivalent of $250 crude oil – until LNG cargos from America started to arb the difference and Putin signalled that Nord Stream flows would be increased.
My reason for anticipating volatility (and great trading opportunities) in the energy markets is that the ESG movement is contributing to massive blunders in government policies with their desire to embrace “green and clean” energy while shunning fossil fuels and nuclear power.
I believe enormous amounts of money have been and will be poorly invested in pursuing “green and clean” energy sources. The pipe dream of a “smooth transition” from current energy sources to “green and clean” energy sources will not happen without “gaps” in energy supplies that will roil markets – and enrage public opinion.
Open interest across the exchange-traded energy markets has dropped to the lowest levels in several years; perhaps people are backing away from short-term price volatility – but less liquidity will likely lead to even greater volatility.
My short term-trading
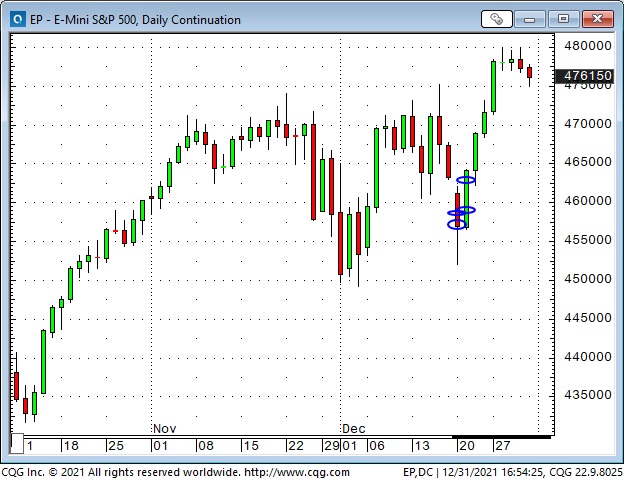
I started the Christmas week with no positions. I bought the S+P when it rallied off its December 20 lows and sold it for a small gain later that day. I rebought it on December 21 and sold it later in the day for a decent profit. Once again, I was out too early!
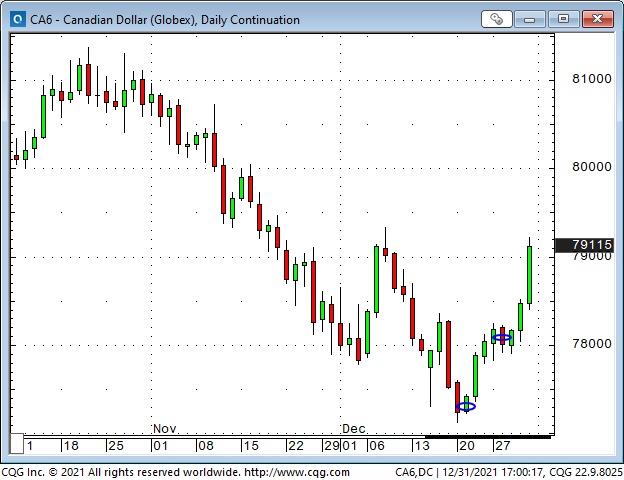
On December 21, I bought the CAD and wrote OTM calls against it to reduce risk. (The CAD had just made a new low for the year the day before.) I saw the CAD as possibly over-sold while the S+P and WTI were rallying. I covered both positions for a decent profit on December 28. (Too early again!)
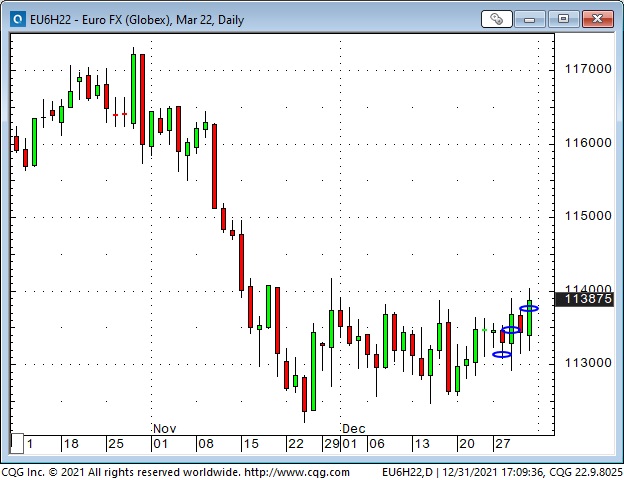
I sold the EUR short on December 28, looking for it to drop below the range it has been in for the past month but was stopped for a slight loss. I bought the EUR on December 31, looking for it to rally out of the past month’s range, and I still hold that position.
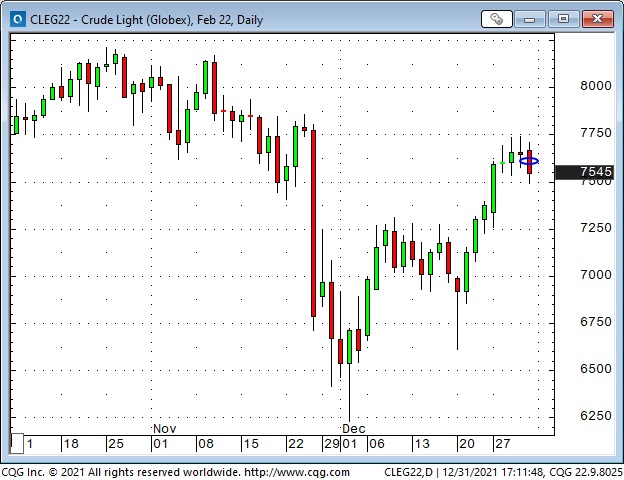
I shorted WTI on December 29 and still hold that position. My realized P+L for the Christmas and New Year’s week was a gain of just under 1%, and I have small unrealized gains in the EUR and WTI.
Thoughts on Trading
It’s hard not to have an opinion about different markets, but I don’t use those opinions as a “timing tool” for trading purposes.
I recently re-read Reminiscences of a Stock Operator, and he talks about getting a sense of “General Conditions” and then looking at “the tape” for confirmation. I do much the same thing, and if price action confirms my opinion about a market, I will start looking for an entry point.
I’m always looking at inter-market and intra-market relationships – they often give me insights into a market that I can’t get just by looking at the flat price.
As a commodity trader, I only think in terms of absolute returns. The concept of relative returns makes no sense to me. I don’t measure my performance against a “benchmark.” I either make money or lose money. To say that I lost money, but managed to outperform a benchmark or a group of other commodity traders, gives me no comfort.
The measurement that is important to me is how much risk I take to generate a return. (My friend Kevin Muir scornfully refers to some hedge funds as leveraged beta dressed up as alpha.) I don’t calculate VaR or Shape ratios or other metrics – I just cut losses quickly and keep my sizing reasonable. For me, the name of the game is to grind away and make sure I don’t get blown away.
My friend Peter Brandt likes to talk about the Pareto Principle (the 80/20 rule) as it applies to trading. Peter has discovered that ~80% of his total trading profits came from only ~15% of his trades over the years, and the other 85% of his trades essentially offset one another. The important thing, says Peter, is to make sure those 85% trades don’t eat up the profits from the 15% trades.
I’ve got two “New Year’s Resolutions“ for 2022: I will try to stay with my winning trades longer, and I’m going to be more aggressive.
Listen to my December 30 interview with Howe Street Radio
The interview is 39 minutes long. I discuss different markets, how I generate trading ideas and manage risk.
Quotes from the notebook
“I’m not concerned about anything. My job is not to set policies. I’m not an economist or a politician, or a central banker. I invest people’s money. So I’m agnostic about what’s good and bad in terms of policy. I just deal with it.” Jeff Gundlach April 2016
My comment: I agree 100%. If I can quote my friend Kevin Muir again, “We don’t trade on what we think should happen, we trade on what we think will happen.” There is a HUGE difference between those two things.
“There is no easier way to make money in the market than to have (and to have the confidence to implement) the correct Variant Perception.”Michael Steinhardt in an RTV interview with (the one and only) Jim Grant July 2018.
My comment: I agree 100%. People who “see things differently” and have the courage of their convictions to trade based on how they see things are the ones who make outsized gains – if they get their timing right. Michael Burry (the Big Short) had variant perception, but he came very close, in terms of timing, to NOT making BIG money – because he took positions early and the clock was running against him.
A Small Request
If you like reading the Trading Desk Notes, please forward a copy or a link to a friend. Also, I genuinely welcome your comments, and please let me know if you would like to see something new in the TD Notes.
The Barney report
Barney came to live with us two months ago when he was eight weeks old (first picture.) he was 13 pounds then, he’s 31 pounds now, and he loves going for a walk in the snow with Papa.


Victor Adair retired from the Canadian brokerage business in 2020 after 44 years and is no longer licensed to provide investment advice. Nothing on this website is investment advice for anyone about anything.
Each week Josef Schachter gives you his insights into global events, price forecasts and the fundamentals of the energy sector. Josef offers a twice monthly Black Gold newsletter covering the general energy market and 30 energy, energy service and pipeline & infrastructure companies with regular updates. We also hold quarterly webinars and provide Action BUY and SELL Alerts for paid subscribers. Learn more.
EIA Weekly Oil Data: The EIA data of Wednesday December 29th was positive for energy prices as demand was strong during the Christmas holiday season. US Commercial Crude Stocks fell 3.6Mb (Just above the forecasted decline of 3.2Mb). Refinery Utilization was at 89.7%, above the 79.4% level of a year ago but below the 94.5% of two years ago. Total Motor Gasoline Inventories fell 3.6Mb on the week while Distillate volumes fell 1.7Mb. US Crude Production was the only bearish data in the release with a rise of 200Kb/d to a new yearly high of 11.8Mb/d. The key bullish feature of the week was that Total Demand rose by 1.76Mb/d as Motor Gasoline demand rose by 739Kb/d and Propane demand by 552Kb/d. Gasoline consumption rose to 9.72Mb/d which is above the 9.30Mb/d consumed in 2019 at this time. Jet Fuel Consumption rose 130Kb/d to 1.59Mb/d versus 1.54Mb/d consumed in 2019. Both are now above pre-pandemic levels. Cushing Inventories rose 1.0Mb to 34.7Mb/d.
EIA Weekly Natural Gas Data: Weekly withdrawals started five weeks ago as winter demand initiated the withdrawal season. Last week Thursday’s data showed a withdrawal of a modest 55 Bcf, lowering storage to 3.362 Tcf as the weather was still mild. The biggest draws were in the Midwest (19 Bcf) and the Pacific (14 Bcf). The five-year average for last week was a withdrawal of 100 Bcf and in 2021 was 152 Bcf. Storage is now 1% above the five-year average, so the US is not facing a natural gas shortage as is seen in Europe and Asia. NYMEX today is US$4.10/mcf up 12 cents from a week ago, due to the frigid conditions. AECO spot is at $4.01/mcf. This week’s data (out tomorrow) and next week’s are likely to see large draws over 100 Bcf due to the cold weather and high heating needs. With the two key winter months for natural gas demand ahead of us (January and February) we should expect large price moves to the upside on very cold days. Spikes over $6/mcf are likely to occur when weekly withdrawals of over 200 Bcf are seen. After winter is over natural gas prices should retreat and if the general stock market decline unfolds as we expect, a great buying window could develop at much lower levels for natural gas stocks in Q2/22.
Baker Hughes Rig Data: The data for the week ending December 23rd showed the US rig count rose seven rigs (up three rigs the prior week) to 586 rigs last week. Of the total working last week, 480 were drilling for oil and the rest were focused on natural gas activity. This overall US rig count is up 68% from 348 rigs working a year ago. The US oil rig count is up 82% from 264 rigs last year at this time. The natural gas rig count is up a more modest 28% from last year’s 83 rigs, now at 106 rigs. The Permian saw an increase of six rigs last week (two rigs in the prior week) to 294 rigs and was up 70% from 173 rigs last year. The Permian is the hottest basin followed by the Haynesville with 48 rigs working.
Canada had a decline of 34 rigs as activity slowed during the holiday season to 133 rigs. Canadian activity is up 62% from 82 rigs last year. There were 20 less oil rigs working last week and the count is now 84 oil rigs working, up from 31 last year. There are 49 rigs working on natural gas projects now, down from 51 last year. The Canadian rig count will recover quickly once we get into mid-January.
The increase in rig activity over a year ago in both the US and Canada should continue to translate into rising liquids and natural gas volumes over the coming months. The data from many companies’ plans for 2022 support this rising production profile expectation. We expect to see US crude oil production reaching 12.0Mb/d during winter 2021-2022 (we are almost there with this week’s data up 200Kb/d to 11.8Mb/d). Companies are taking advantage of attractive drilling and completion costs and want to lock up experienced rigs and crews as staffing issues are getting tougher for the sector.
Conclusion:
Bearish pressure on crude prices:
- The US Federal Reserve is ending its bond purchases in March 2022 which will remove 6%+ of monetary stimulus from the economy. Forecasters now expect three increases in rates in 2022 and three in 2023, so that the terminal Federal Funds rate will rise to 2.3% from 0.25% currently. Note, a 1% rise in interest rates adds US$300B of interest costs and with deficits continuing for many years into the future, this will add to deficits and depress the US economy. Removing this stimulus will slow the US economy. Additionally the ‘Build Back Better’ Biden plan will be very difficult to pass in 2022 as it is a midterm election year.
- Omicron Covid-19 caseloads are growing around the world with record infection rates seen in many European countries. Lockdowns or access restrictions are expected to recommence in early 2022. A fourth booster shot for the elderly and front line medical staff is being started in many countries. While the US lowered the quarantine days from 10 days to five days, worker shortages remain a problem. Over 4,000 flights were cancelled over the Christmas holiday peak travel season. The winter wave is lifting infections and for the unvaccinated, higher hospitalizations. Hospital systems are near or at capacity and medical staff shortages are rising due to infections, burnout and quitting.
- Energy demand (easily seen in this week’s EIA data) is under pressure as high prices for most food, rent, taxes, child care, health expenses, auto costs and other daily necessities make spending decisions tougher for consumers. This gouge in prices will surely impact consumers’ buying behavior in the coming months. The spending pie of consumers is shrinking and some spending habits of the past will have to be dropped. Demand destruction is on the way.
- China is buying more oil from sanctioned Iran which leaves less oil to be purchased from Saudi Arabia and other OPEC members. The main reason is price, which Iran is offering at US>$4/b less than the ICE Brent price.
- Venezuela surprisingly is lifting its production with the help of Iran which is selling (barter trade) diluent so that they can sell more exportable grades to China. Last month they produced 824,000 b/d of crude up 90% from a year ago, according to Reuters.
Bullish pressure on crude prices:
- OPEC meets again on January 4th and are unlikely to agree to lift February production above their 400,000 b/d long term plan despite pressure from the US, India and China.
- While approving an increase of 400,000 b/d of new production for January 2022, OPEC once again has not achieved their target as seen from their December Monthly Report which showed November production only rose 285,000 b/d. .
- The Iran deal is not seeing progress as the Iranians continue to want removal of sanctions to sell oil, but do not want to slow down their nuclear weapons program or allow intrusive UN inspections. The bulls are rejoicing that the 1-2Mb/d of new Iranian oil that could come on is now more unlikely.
- Libya has implemented a force majeure on exports as they face delayed elections (maybe one month) and violence. Four of their ports are closed and over 1Mb/d are impacted for the near term. OPEC reported production of 1.14Mb/d from Libya in November.
- Once the ground is frozen for tank battles, Russia is likely to invade Ukraine which will result in additional sanctions being added to pressure Russia to desist. Russia may face OECD blockages on sales of crude oil. Natural gas is a different story as Russia is the main provider. Large US LNG volumes are starting to arrive in Europe to alleviate the US$50/mcf price spike.
CONCLUSION:
WTI had a large move over the last week lifting to US$75.61/b from US$71.44/b last week as the frigid cold weather lifted prices. Temperatures in parts of the US and Canada are colder than minus 40 degrees celsius with the windchill.
We remain concerned about the health and strength of the US and China economies (the largest two in the world). We still see crude oil prices having US$20+/b of speculative value which should disappear as demand weakens once winter is over. Leveraged speculative longs in crude oil futures are vulnerable to nasty margin calls and this should add momentum to the recent downside pressure.
As the worst winter weather subsides, the price of crude should retreat towards US$62-65/b. Our downside target for WTI in Q2/22 is US$48-54/b. This should set up an important low and then our key signals should turn bullish again.
Energy Stock Market: The S&P/TSX Energy Index currently trades at 165, up five points from last week. Oil stocks are more vulnerable than natural gas stocks. Any energy companies in the sector with over-leveraged balance sheets may feel the most downside risk.
On behalf of the team here at Schachter Energy Research Services Inc. we would like to wish you and your family the very best for a very happy, healthy and successful 2022.
Please note that we will be returning to Mount Royal University (MRU) on October 22, 2022 for our ‘Catch the Energy’ Conference if pandemic rules allow. We will be discussing the protocols on attendance, food service, masking and QR code verification with MRU in Q1/22 and will move forward with the event after having cancelled it for the last two years. We look forward to adding more companies and focus the event on attendees having safe and maximum, face to face time with management. More on this in the New Year.
Our next quarterly webinar will be held on Thursday February 24th at 7PM MT. Our first report of 2022 will be our Interim Report which will be released on Thursday January 13th.
If you would like to access our 2022 Forecast Report (which came out December 16th), all previous reports and the webinar archives, go to https://bit.ly/34iKcRt to subscribe.
Please feel free to forward our weekly ‘Eye on Energy’ to friends and colleagues. We always welcome new subscribers to our complimentary macro energy newsletter.
Each week Josef Schachter gives you his insights into global events, price forecasts and the fundamentals of the energy sector. Josef offers a twice monthly Black Gold newsletter covering the general energy market and 30 energy, energy service and pipeline & infrastructure companies with regular updates. We also hold quarterly webinars and provide Action BUY and SELL Alerts for paid subscribers. Learn more.
EIA Weekly Oil Data: The EIA data of Wednesday December 22nd was initially seen as positive for crude prices. US Commercial Crude Stocks fell 4.7Mb (forecast a decline of 2.75Mb). With high Refinery Utilization at 89.6% (above the 78.0% level of a year ago but below the 89.8% of the prior week) Total Motor Gasoline Inventories rose 5.5Mb on the week while Distillate volumes rose 0.4Mb. US Crude Production declined 100Kb/d to 11.6Mb/d due to weather disruptions from tornado activity across the US Midwest. The key feature of the week was that Total Demand fell by 2.74Mb/d as Distillate heating oil demand fell by 1.074Mb/d and propane usage fell by 866Kb/d. These items can swing around quite widely so these declines are not disconcerting. Gasoline consumption fell 486Kb/d to 8.99Mb/d which is just above the 9.30Mb/d consumed in 2019 at this time. Jet Fuel Consumption fell 147Kb/d to 1.46Mb/d versus 1.54Mb/d consumed in 2019. Cushing Inventories rose 1.5Mb to 33.7Mb/d.
EIA Weekly Natural Gas Data: Weekly withdrawals started four weeks ago as winter demand commenced. Last week, there was a withdrawal of 88 Bcf, lowering storage to 3.417 Tcf. The biggest draws were in the Midwest (37 Bcf) and the East (25 Bcf). The five-year average for last week was a withdrawal of 109 Bcf and in 2021 was 122 Bcf. Storage is now only 1.8% below the five-year average, so the US is not facing a natural gas shortage as is seen in Europe and Asia. NYMEX today is US$3.98/mcf down from the high in early October of US$6.47/mcf. AECO spot is at $4.08/mcf, down >$2.50/mcf from 2021 highs. As to be expected, natural gas stocks have retreated from their 2021 highs. With the two key months for natural gas demand ahead of us (January and February) we should still expect large price moves to the upside on very cold days. Spikes over $6/mcf could occur when weekly withdrawals of over 200 Bcf are seen. After winter is over natural gas prices should retreat and if the general stock market decline unfolds as we expect, then a great buying window could develop at much lower levels for natural gas stocks in Q2/22.
Baker Hughes Rig Data: The data for the week ending December 17th showed the US rig count rose three rigs (up seven rigs the prior week) to 579 rigs last week. Of the total working last week, 475 were drilling for oil and the rest were focused on natural gas activity. This overall US rig count is up 67% from 346 rigs working a year ago. The US oil rig count is up 81% from 263 rigs last year at this time. The natural gas rig count is up a more modest 25% from last year’s 81 rigs, now at 104 rigs. The Permian saw an increase of two rigs last week (three rigs in the prior week) to 288 rigs and was up 66% from 174 rigs last year. The Permian is the hottest basin followed by the Haynesville with 47 rigs working.
Canada had a decline of 10 rigs as activity slows during the holiday season to 167 rigs. Canadian activity is now up 64% from 102 rigs last year. There were six less oil rigs working last week and the count is now 104 oil rigs working, up from 41 last year. There are 62 rigs working on natural gas projects now, up from 61 last year.
The increase in rig activity over a year ago in both the US and Canada should continue to translate into rising liquids over the coming months, especially with the DUC count (drilled but uncompleted well count) at very low levels. The data from many companies’ plans for 2022 support this rising production profile expectation. We expect to see US crude oil production reaching 12.0Mb/d during winter 2021-2022. Companies are taking advantage of attractive drilling and completion costs and want to lock up experienced rigs and crews as staffing issues are getting tougher for the sector.
Conclusion:
Bearish pressure on crude prices:
- The US Federal Reserve is ending its bond purchases in March 2022 which will remove 6%+ of monetary stimulus from the economy. Forecasters now expect three increases in rates in 2022 and three in 2023, so that the terminal Federal Funds rate will rise to 2.3% from 0.25% currently. Note, a 1% rise in interest rates adds US$300B of interest costs and with deficits continuing for many years into the future, this will add to deficits and depress the US economy. Removing this stimulus will slow the US economy. The UK and New Zealand are leading the interest rate rise movement.
- Covid caseloads are growing around the world with Omicron now exceeding Delta in many countries. In the US, 73% of cases are now Omicron. This new variant is impacting both the vaccinated and unvaccinated with the unvaxxed filling the ICU wards. ICU beds are nearing full capacity which may result in triage of patients which will raise the death toll. In the US, the death rate is over 808K deaths (up 8K in just one week). Worldwide, the death count is now 5.36M (up 50,000 in one week). Single case records are rising particularly in Denmark, Norway, the UK (78,610 cases – the highest since the pandemic started and 100,000 are expected in the coming weeks), South Africa, South Korea, Vietnam, and Zimbabwe. New lockdown restrictions have been implemented in the Netherlands and are being considered in other EU countries. In the US single day case load records are being seen in New Hampshire, New Jersey and New York. President Biden has predicted the ‘winter of death‘ for the unvaxxed. Canadian Provinces are implementing gathering restrictions. Some countries see reduced efficacy from the current three doses and plan usage of a fourth dose for those over 60 years of age (Israel is already administering this new dose). The fast spread of Omicron has impacted driving habits and weaker demand for crude is occurring in many places in the world.
- Energy demand (easily seen in this week’s EIA data) is under pressure as high prices for most food, rent, taxes, child care, health expenses, auto costs and other daily necessities make spending decisions tougher for consumers. This gouge in prices will surely impact consumers’ buying behavior in the coming months. The spending pie of consumers is shrinking and some spending habits of the past will have to be dropped. Demand destruction is on the way.
- China is buying more oil from sanctioned Iran which leaves less oil to be purchased from Saudi Arabia and other OPEC members. The main reason is price, which Iran is offering at US>$4/b less than the ICE Brent price. China imported 600Kb/d in November from Iran or 40% more than in October.
Bullish pressure on crude prices:
- While approving an increase of 400,000 b/d of new production for January 2022, OPEC has not achieved their target once again as seen from their December Monthly Report.
- The Iran deal is not seeing progress as the Iranians continue to want removal of sanctions to sell oil, but do not want to slow down their nuclear weapons program or allow intrusive UN inspections. The bulls are rejoicing that the 1-2Mb/d of new Iranian oil that could come on is now more unlikely.
- Libya has implemented a force majeure on exports as they face delayed elections (maybe one month) and violence. Four of their ports are closed and over 1Mb/d are impacted for the near term. OPEC reported production of 1.14Mb/d from Libya in November.
- If Russia invades Ukraine, sanctions will be added to pressure Russia to desist. Russia may face OECD blockages on sales of crude oil. This would be positive for China but would hurt Europe which would need to find other more expensive suppliers. Russia is adding pressure on Europe/NATO as they reversed its major Yamal natural gas pipeline from Germany and other western European countries towards Poland. Is this a short term commercial event as Russia says or more pressure on Germany to approve the Nord Stream 2 pipeline? Natural gas prices have reached the equivalent of US$50/mcf in some places in Europe due to supply shortages, low storage and Russia’s recent maneuvers.
CONCLUSION:
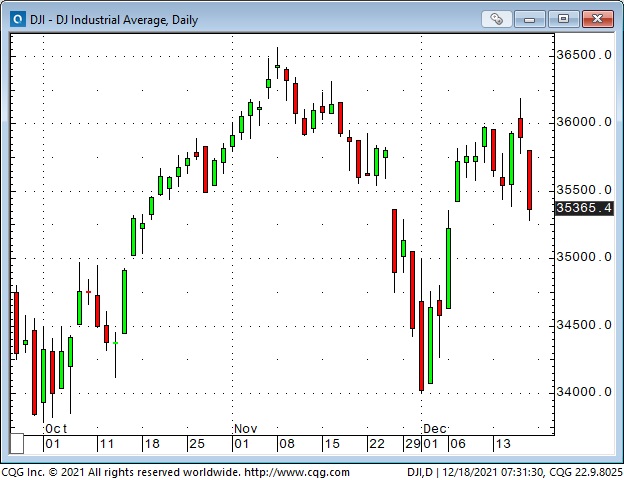
Pandemic fatigue is causing wider gyrations in crude prices. The good news is that the death rate is lower for the vaccinated and we are seeing surges in people lined up for initial or booster shots and crude prices rebound. Tightened restrictions and a rising death toll for the unvaxxed are scary days and the price of crude and the general stock market falter. There have been and will likely continue to be a large number of 400+ points up and down days occurring for the Dow Jones Industrials Index as market emotions react to the data each day.
WTI had a large move over the last week. From a low of US$66.12/b after the release of the EIA report last week to a high of US$73.00 as Omicron fears dissipated. The price as we write this piece is US$71.44/b up 32 cents on the day.
We remain concerned about the health and strength of the US and China economies (the largest two in the world). We still see prices having US$15-20/b of speculative value which should disappear as demand weakens once winter is over. Leveraged speculative longs in crude oil futures are vulnerable to nasty margin calls and this should add momentum to the recent downside pressure. In the next few weeks the price of crude should retreat below last week’s low of US$66.12/b towards US$62-65/b and then bounce around from there (like we have been seeing over the last week). Our target for WTI in Q2/22 once winter peak energy demand is over is US$48-54/b. This should set up an important low before our key signals should turn bullish again.
Energy Stock Market: The S&P/TSX Energy Index currently trades at 160, up eight points from last week as the price of crude recovered from the US$66/b price low of last week. The range last week for the Energy Index was 147-161, so we are near the top of that range currently. The level could reach 165 if the pandemic news is good but we see it breaching last week’s low of 147 during January. As crude prices retreat in the coming months we see downside for this Index to the 95-105 level during Q2/22, implying severe downside. Oil stocks are the most vulnerable (especially those that are now bullish and are unhedged) as are any energy companies in the sector with over-leveraged balance sheets.
On behalf of the team here at Schachter Energy Research Services Inc. we would like to wish you and your family the very best of the holiday season. Merry Christmas and have a very happy, healthy and successful 2022.
Please note that we will be returning to Mount Royal University (MRU) on October 22, 2022 for our ‘Catch the Energy’ Conference if pandemic rules allow. We will be discussing the protocols on attendance, food service, masking and QR code verification with MRU in Q1/22 and will move forward with the event after having cancelled it for the last two years. We look forward to adding more companies and focus the event on attendees having safe and maximum, face to face time with management. More on this in the New Year.
Our next quarterly webinar will be held on Thursday February 24th at 7PM MT. Our first report of 2022 will be our Interim Report which will be released on Thursday January 13th.
If you would like to access our 2022 Forecast Report (which came out last Thursday), all previous reports and the webinar archives, go to https://bit.ly/34iKcRt to subscribe.
Please feel free to forward our weekly ‘Eye on Energy’ to friends and colleagues. We always welcome new subscribers to our complimentary macro energy newsletter.
Are you de-risking into yearend?
Day-to-day and intra-day price action since Thanksgiving Friday has been very choppy. Big Cap Tech has been fading. Are Portfolio Managers de-risking before yearend to preserve stellar track records?
Big Cap Tech fading?
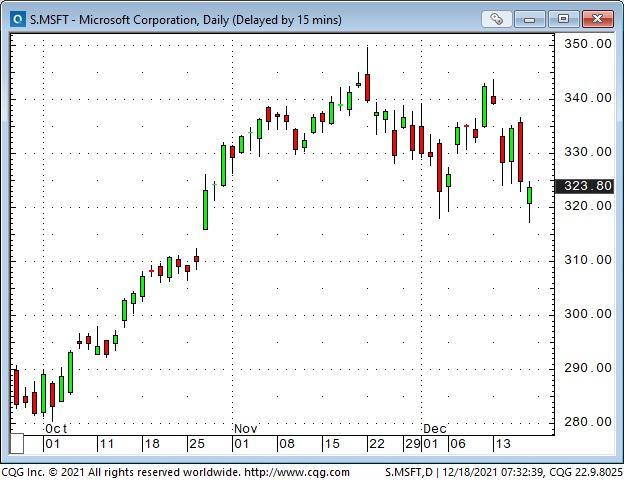
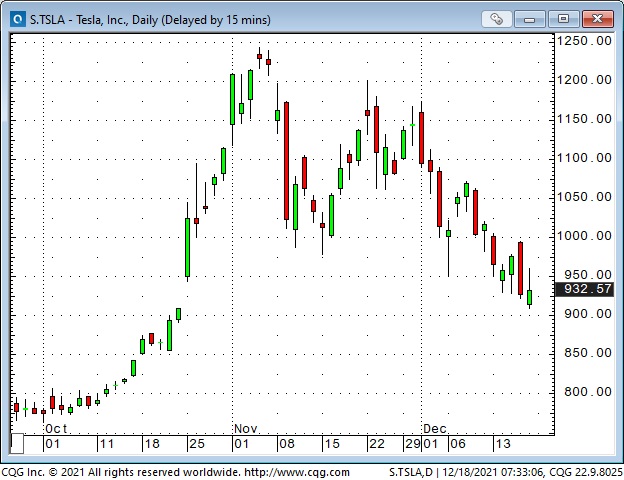
Big Cap Tech has been THE most significant part of YTD gains in the S+P and NAZ (NAZ is up ~21% YTD; without AAPL, GOOGL, MSFT, TSLA and NVDA, it is up only ~5.5%.) If the “Generals” are starting to fade while the “troops” are already weak, the indices may risk a bigger correction.
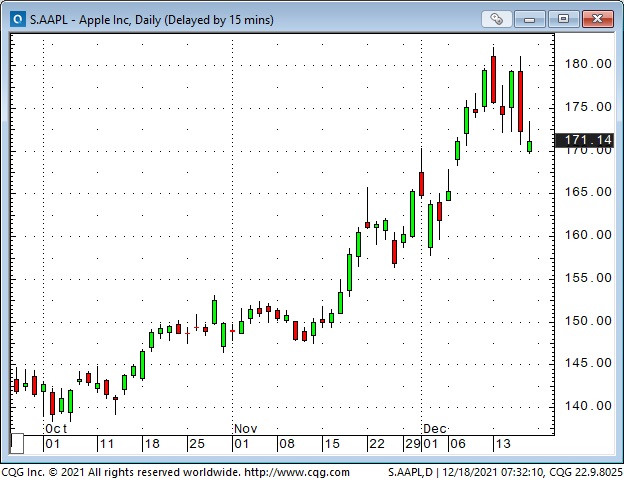
APPL hits $3 Trillion market cap
APPL hit an All-Time High Monday but ended the week on its lows.
MSFT touched a 7-week low this week – a classic lower high/ lower low double top on the daily chart.
TSLA is down ~25% from November All-Time Highs. Elon Musk has sold >$13 Billion worth of shares.
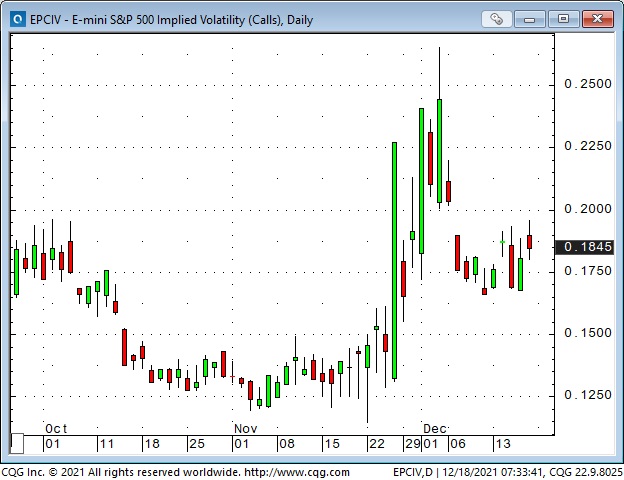
Volatility has been volatile
Liquidity will be THIN between now and Jan 3, 2022
Positioning
Suppose you were a Portfolio Manager and you’ve had an excellent YTD performance (primarily due to gains in Big Cap Tech). Would you be de-risking during December to lock in a strong 2021 track record – for the benefit of your clients, of course – and to attract a CHUNK of all that new cash that will be looking for a PM come January?
The Fed was hawkish – but stocks rallied – for a day
The Fed – prompted by non-transitory high and rising inflation – voted to accelerate the “tapering” of their bond and mortgage purchases – and, if the economy stays strong and inflation remains high, they may raise short-term interest rates by 0.25% three times in 2022.
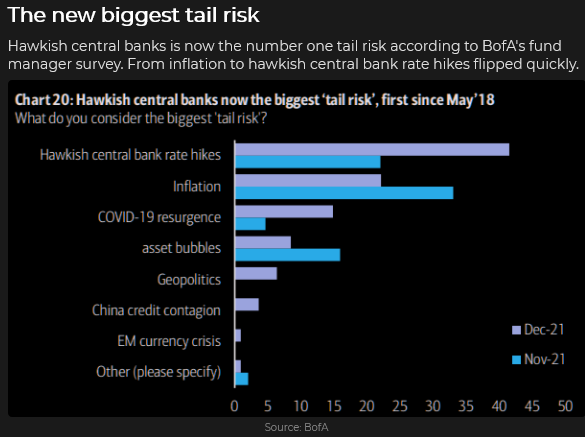
A Fed policy error is the market’s biggest worry
The Biggest worry for 2022 (according to money manager surveys) is that the Fed will begin tightening monetary policy while the economy slips into recession, and bitter political divisions in Washington mean that there will be no more fiscal stimulus. (Note: 43 million Americans will be required to resume payments on student loan debt beginning February. The average monthly loan payment is $393, and the total student loan debt is $1.7 Trillion. This will effectively be a tax increase and a drag on consumer spending. Given that consumer spending is ~70% of GDP, then…)
Omicron
The market does not view the latest Covid variant as a significant threat. Any change in that assessment could tip the scales to a broader bearish sentiment.
The mountain of cash on the sidelines
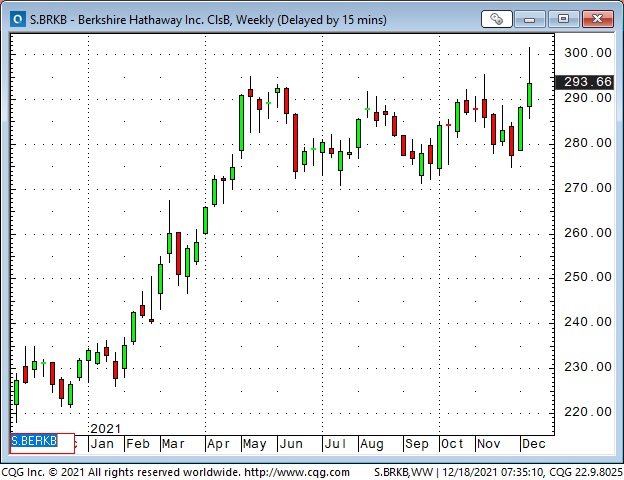
Some people see “all that cash” as “dry powder” that will be FOMOed into the market and drive it much higher. Maybe, but I think that mountain of cash may be a sign that (primarily wealthy) people see a lot of risk in the stock market at these levels and are willing to sit patiently with a significant cash position. (Berkshire Hathaway, which is super-long cash, was bid to an ATH this week – while Big Cap Tech was sold.) The massive flow of funds into low-yielding Treasury bonds may be another sign of patient money de-risking – or preparing for a possible economic slowdown.
Emerging markets are markets you can’t emerge from in an emergency
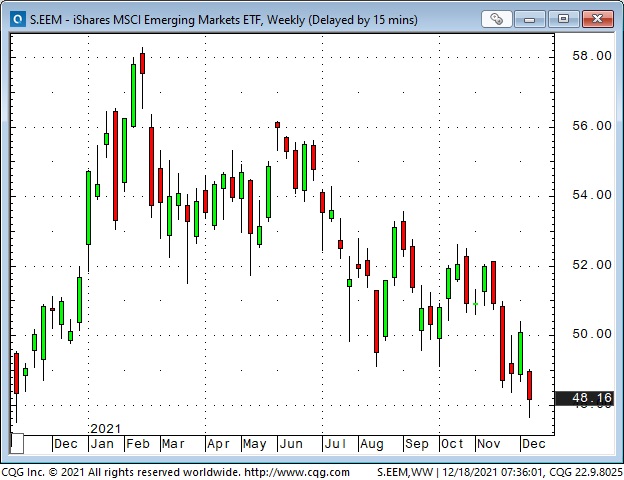
The MSCI Emerging Markets ETF had its lowest weekly close since November 2020. For the DJIA to get back to November 2020 levels, it would need to drop >7,000 points (20%.) The NAZ would need to drop ~25%.
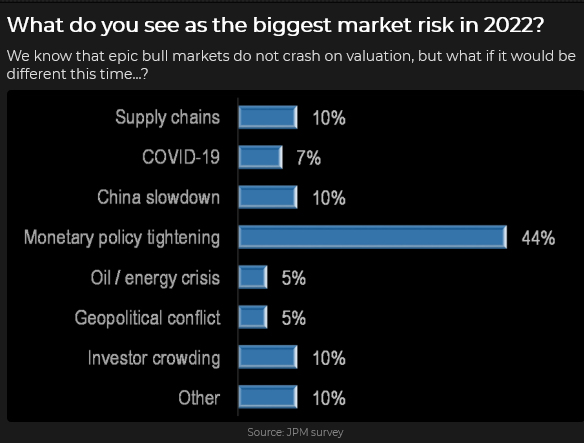
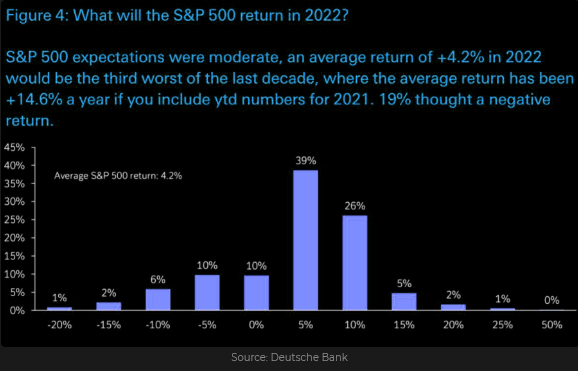
What do very highly paid portfolio managers expect the stock market to do in 2022?
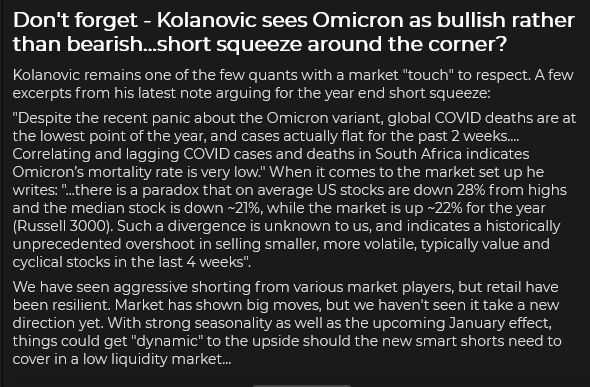
For balance – here’s a very perceptive bullish “take” on the stock markets from JP Morgan’s top quant
European and Asian NatGas prices hit ATH this week
NatGas in Europe and Asia is `10X the price of North American NatGas. What are the knock-on effects of these extraordinarily high energy prices?
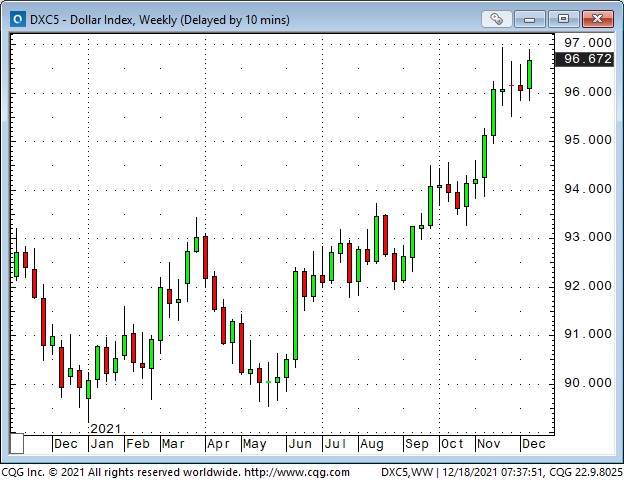
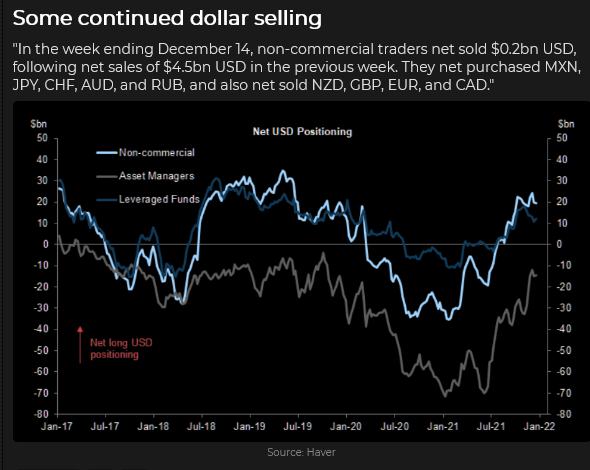
The US Dollar Index had its highest weekly close in 18 months
The USD is trading higher YTD against virtually every widely traded currency – except the Israeli Shekel and the Chinese RMB.
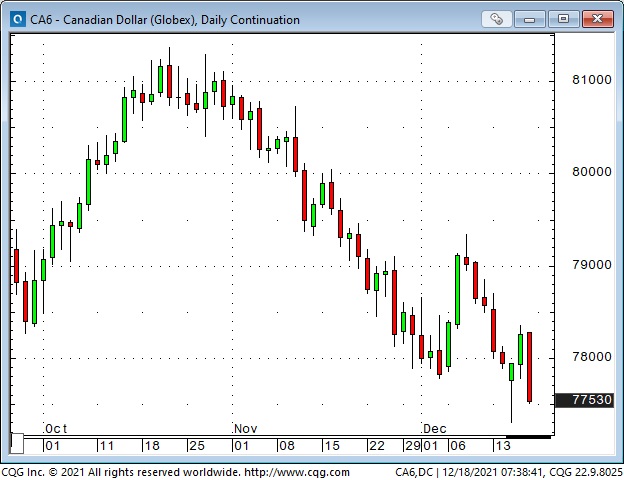
The Canadian Dollar: lowest weekly close against the USD in 13 months
The CAD bounce more than a full cent Wednesday/Thursday following the Fed meeting, but as stocks and crude oil weakened on Friday and the USD gained against most other currencies, the CAD weakened to ~7850.
Gold rebounded as much as $60 from a 2-month low following the Fed announcement. It gained ~$15 Friday to Friday
Immediately before any major scheduled market risk event – like this week’s Fed announcement – dealers/traders in all markets pull their bids and offers – the depth of market (DOM) thins out to practically nothing, and there is (relatively) NO liquidity. The risk event happens, the machines have their fun, prices spike or dive for a few seconds and then liquidity returns. Sometimes (!) stops get hit.
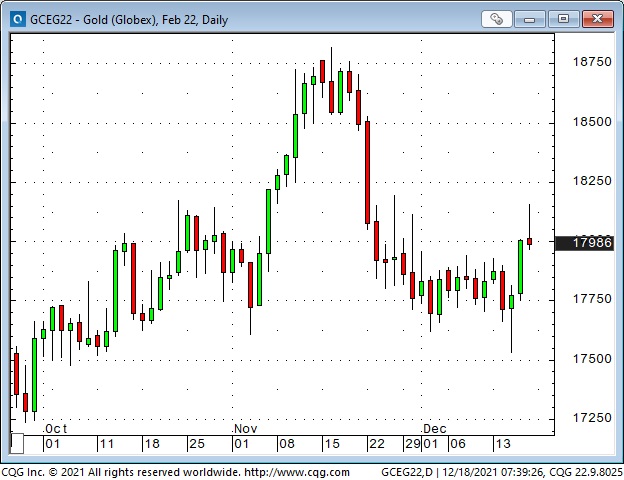
Comex Gold dropped ~$10, to more than a 2-month low within a few seconds following the Fed announcement and then rallied back ~$12 within 2 minutes. Comex traded about 800,000 ounces in those 2 minutes.
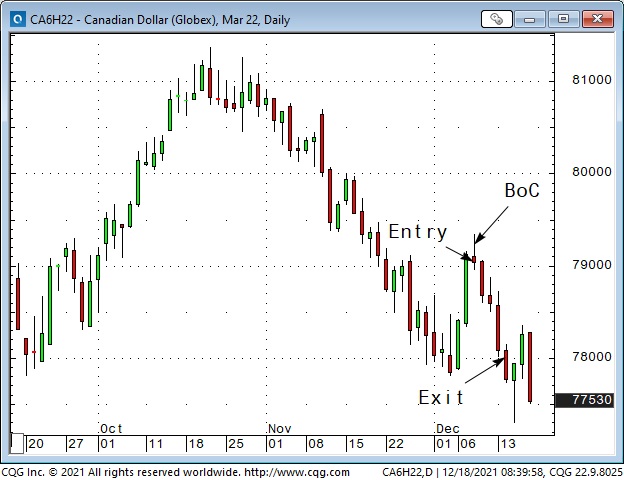
My short term trading
The only position I carried over from last week was short CAD. I had sold it when it fell back from the highs made following the BoC meeting Wednesday of last week. I covered the position for more than a one-cent gain on Tuesday when the CAD had an excellent opportunity to take out the early December lows – but didn’t.
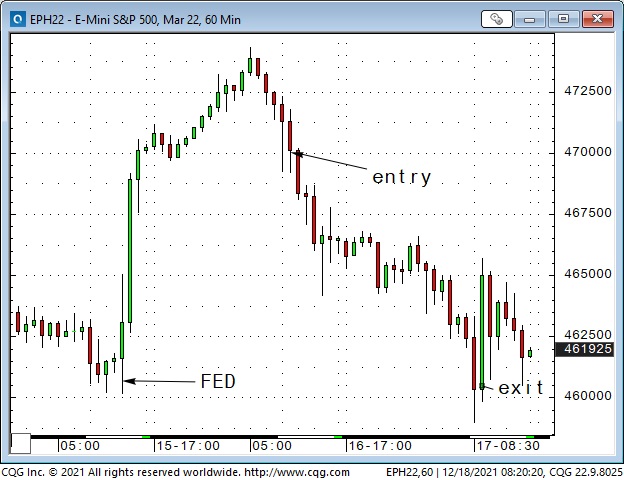
I scalped the S+P from the short-side Tuesday when it broke below the previous three day’s lows. I covered the trade for a 20 point profit later that day. I wanted to be flat going into the Wednesday Fed announcement.
I took Barney for a two-hour walk Wednesday morning. I wanted to be away from my screens when the Fed announcement/press conference happened. I did NOT want to have a position on and be subject to the wild price swings that often follow such events. I wanted to let the market “settle down” before I made any new trades.
Following the Fed announcement/press conference, the S+P ran up ~140 points to new All-Time Highs in the Wednesday overnight session. I did not participate in that terrific move. The Thursday day session opened below the overnight highs, and I got short about an hour after the opening. I covered that trade for a ~90 point gain just after the Friday day session began. (Friday was a HUGE option expiry day – I expected a LOT of volatility and saw the early Friday dive to new lows for the week as a gift and closed my position.)
I re-shorted the CAD Thursday morning about the same time I shorted the S+P. It had bounced more than a full cent off its pre-Fed lows (tracking the S+P and WTI) and rolled over like the S+P. I covered that trade for ~30 point gain at the same time as I covered the short S+P early Friday.
I stayed out of the markets for the balance of Friday, and I’m flat going into the weekend. I had a good week (my P+L was up more than 2% on the week), and I didn’t want to give back any of those gains in what I expected to be a very choppy Friday due to the quad-witching OPEX. I was remembering that Peter Brandt likes to say, “It’s easy to make money trading, the hard part is hanging onto it.”
Thoughts on trading
I stay in touch with a few old trading friends. One of them knew I had shorted the S+P and the CAD Thursday and when he saw they were down hard Friday morning he sent me a note saying that he hoped I had shorted a bunch. I replied:
The old saying is that you never have enough on when you’re right! I want my size to be small enough so that each trade is just a trade – no big deal if it wins or loses. I’ve caught a couple of good moves – luckily missed getting clobbered on some other moves. I’m up about 2% on the week. I might stay flat now – this is a HUGE option expiry today – price action could continue to be choppy.
Using stops: Before initiating a position, I pick out a level where I want to be out if the market goes against me. After I take my position I place a GTC stop at that level. I see the stop as a “fail-safe” – if the market goes there, I’m out even if I’m away from my screens. (We know it’s not really a “fail-safe“- crazy things that I can’t control can happen – but I can control placing the stop – acknowledging that the trade could go against me and I’ve taken what steps I can to limit losses.)
If the market goes in my favour I will usually trail my stop behind the market (not with an eye to simply reducing the dollar amounts of risk, but to new levels that make sense – and that also reduce risk.) If the market moves quickly and a LOT in my favour (like the S+P did early Friday morning), I often take my profits and CXL the stop.
I have a long history of taking losses quickly, and profits quickly. (That may come from sitting in front of screens for 40 years and getting too caught up in short-term movements.) Some friends tell me that I need to learn how to stay with winning trades longer (I’d like to do that!) For instance, I could trail stops behind the market and only exit a profitable trade when my stop gets hit.
Maybe someday I’ll change, but if my goal is to make money (as opposed to “being right“) I’ll probably keep booking profits when I have the chance.
Quotes from the Notebook
“Inflation is not a coincidence – it is a policy.” Daniel Lacalle December 2021
My comment: I agree 100%. Daniel’s quote is a subset of “Don’t fight the Fed.” If the Fed wants inflation bad enough they will do “whatever it takes” to get it. The BoJ might also want to create inflation, and they have tried, without much success, to get it, but just because they have not succeeded doesn’t mean they have not made a policy decision. You want to be on the right side of any major policy decision.
“For most investments, sizing is more important than entry-level.” Harley Bassman, repeatedly over the years
My comment: I’ve watched several video interviews with Harley, listened to many of his podcasts and read commentary on his website for years. He is an innovative, successful veteran trader who has forgotten more about the bond market than most people will ever learn. He is not a day trader – he is an old-school value investor, and that’s his way of saying risk management is more critical to long-term success than where/when you decide to pull the trigger.
A Small Request
If you like reading the Trading Desk Notes, please do me a favour and forward a copy or a link to a friend. Also, I genuinely welcome your comments. Please let me know if there is something you would like to see included in the TD Notes.
There will be no Trading Desk Notes next week. It’s Christmas. I’ll be back the following week.
Barney: “Hey Papa, is it time for our morning walk?”
Barney was 13 pounds when he came to live with us six weeks ago. He is now 25 pounds, and just over three months old!

Victor Adair retired from the Canadian brokerage business in 2020 after 44 years and is no longer licensed to provide investment advice. Therefore, this blog, and everything else on this website, is not intended to be investment advice for anyone about anything.
-
I know Mike is a very solid investor and respect his opinions very much. So if he says pay attention to this or that - I will.
~ Dale G.
-
I've started managing my own investments so view Michael's site as a one-stop shop from which to get information and perspectives.
~ Dave E.
-
Michael offers easy reading, honest, common sense information that anyone can use in a practical manner.
~ der_al.
-
A sane voice in a scrambled investment world.
~ Ed R.
Inside Edge Pro Contributors

Greg Weldon

Josef Schachter

Tyler Bollhorn

Ryan Irvine

Paul Beattie

Martin Straith

Patrick Ceresna

Mark Leibovit

James Thorne

Victor Adair