
Op/Ed
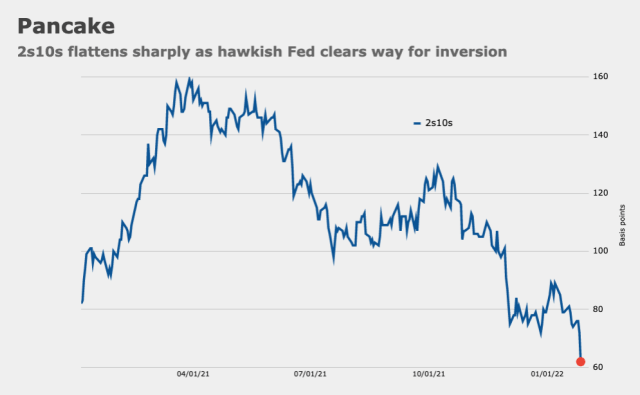
Interest rates rocket higher
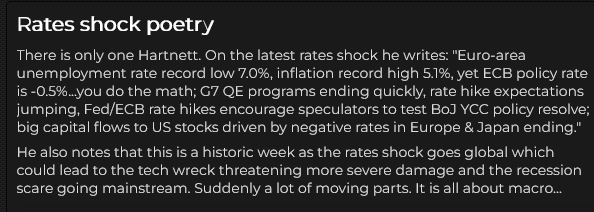
Interest rates have been climbing steadily since early December but rocketed higher this week on the one-two punch of surging CPI and a call from St. Louis Fed President Bullard for the Fed to “immediately” take aggressive hawkish action.
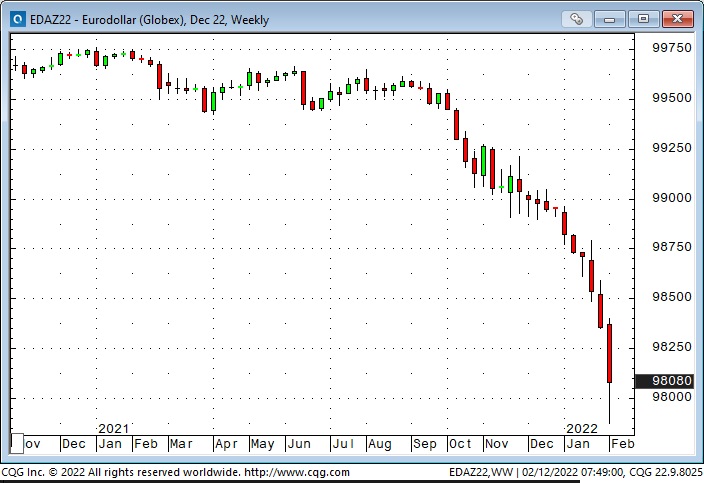
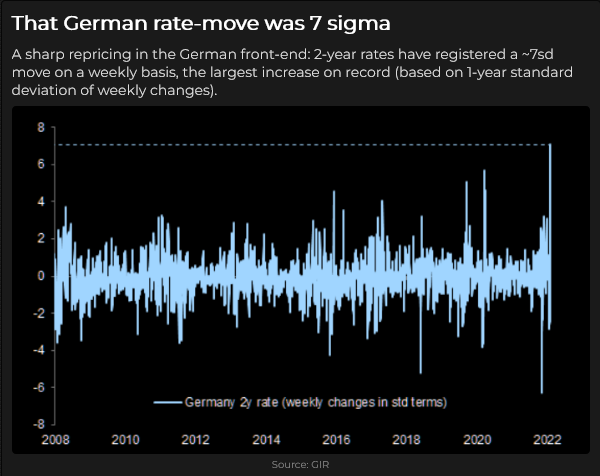
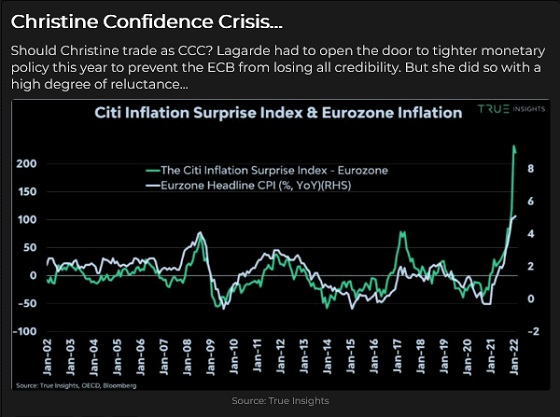
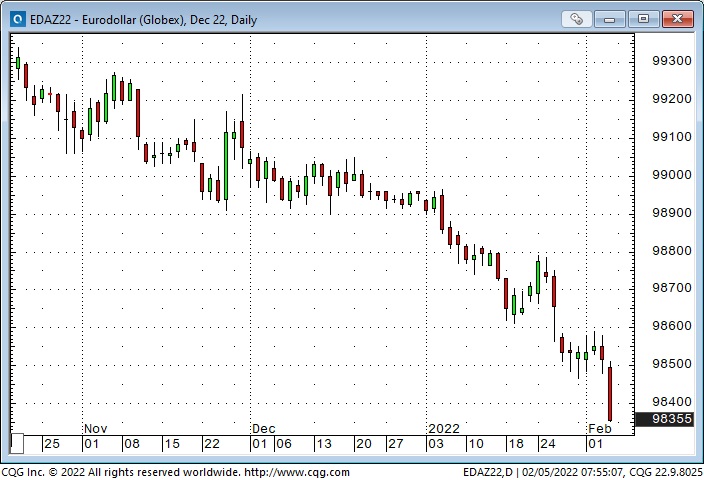
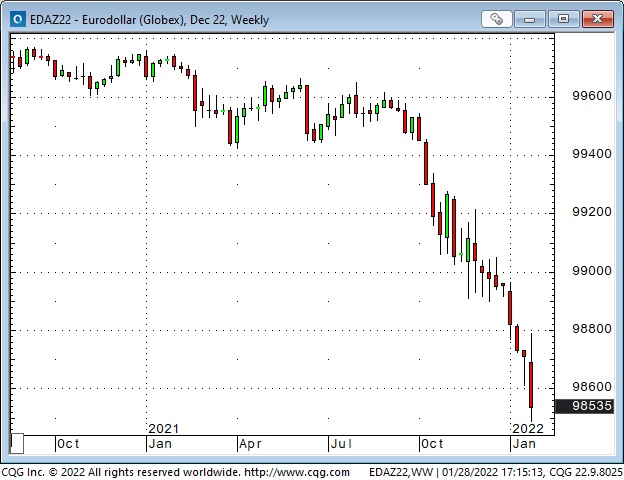
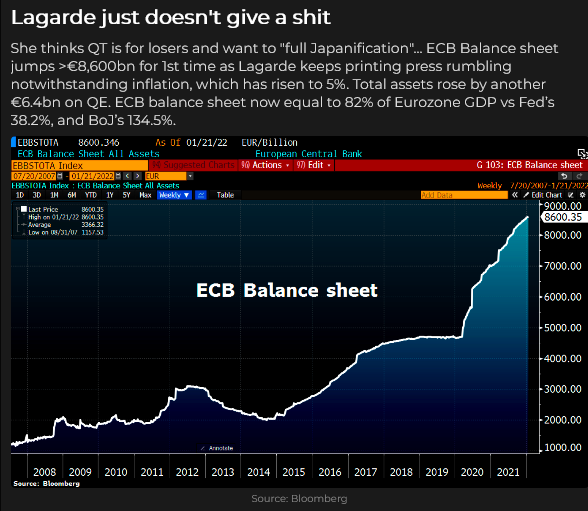
Last week I noted the dramatic “rate of change” in European interest rates when Christine Lagarde surprised the market by opening the door to the ECB raising rates this year. This week the “rate of change” in American short rates was equally dramatic. On Thursday, Eurodollar futures (first chart above – trade at a discount to par) suffered their largest daily drop in over ten years. Ten-year US Treasury yields traded above 2% for the first time in nearly three years.
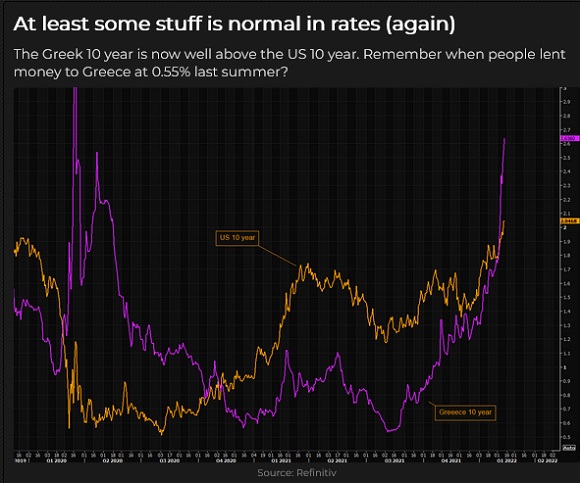
The 10-Year Greek yield rose from 0.55% last summer to 2.63% (Purple line below), while the 10-Year UST rallied from 1.2% to 2.05%. (Gold line.) When interest rates were historically low last summer, weaker credits could borrow “cheap” relative to quality credits. As interest rates have risen, the spreads have “gone out.” This is true for sovereign borrowers as well as corporate. (If you wondered why Greece could borrow at rates substantially below the rates the USA paid, take a bow in the direction of the magnificent ECB bond-buying program.)
(The “rate of change” – the delta – feeds on itself as people (option sellers, for instance) who were unprepared for the speed and magnitude of the recent move capitulate and liquidate their positions, adding weight to the chain of falling dominos.)
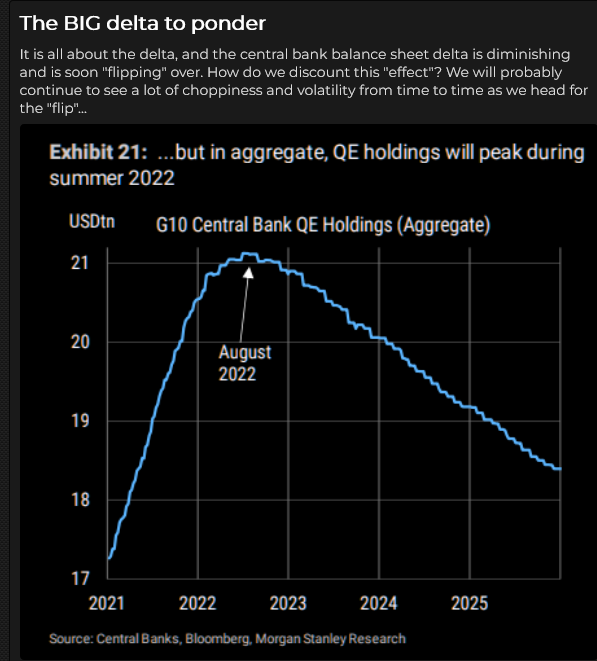
Another “rate of change” to consider is the Fed changing from buying bonds (QE) to selling bonds (QT). The chart below was created on Wednesday. As of Friday, the switch from QE to QT looks more like May than August. (Maybe earlier if Bullard has his way – unless, of course, “Ukraine.”)
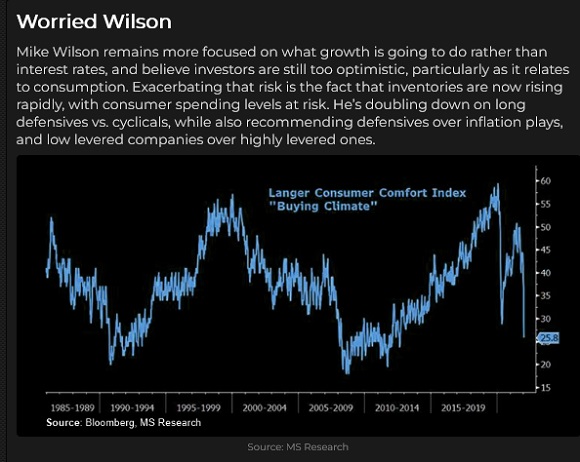
Consumer confidence was reported Friday at the lowest level in more than ten years – consumers are worried about inflation – and may reduce their buying of non-essential items/services.
So what is the Fed going to do?
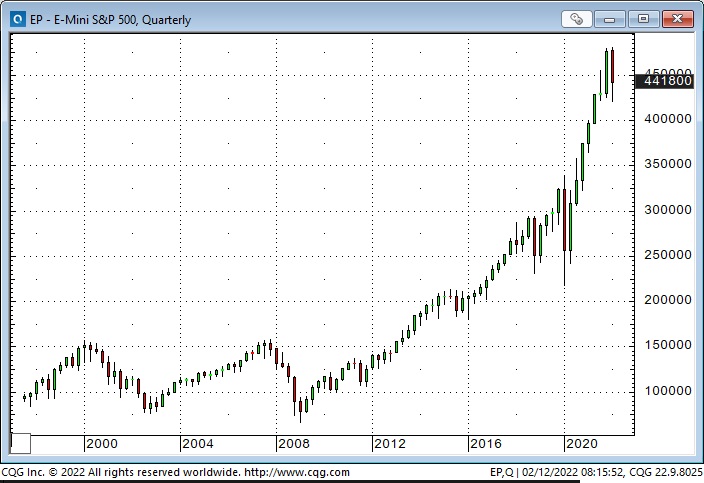
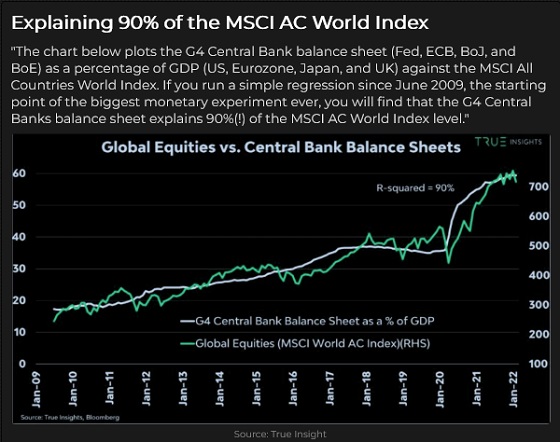
They are still buying Billions worth of bonds and mortgages every week, and, despite all the talk, they still have interest rates nailed to the floor. The growth in the Fed’s balance sheet since March 2020 is highly correlated with rising stock indices – if they wind down QE and reverse to QT (as they have indicated they will do), will stocks tumble?
I recently suggested that the Democrats, sensing disaster in the mid-terms, may push the Fed to kill inflation, even if it means throwing the stock market under the bus. (Many voters don’t own stocks directly.)
Some analysts are forecasting that the Fed may be tightening into a recession, creating a stagflationary environment, and tightening monetary policy won’t diminish inflation caused by supply chain issues.
And then the Russia/Ukraine wild card problem suddenly got a lot worse
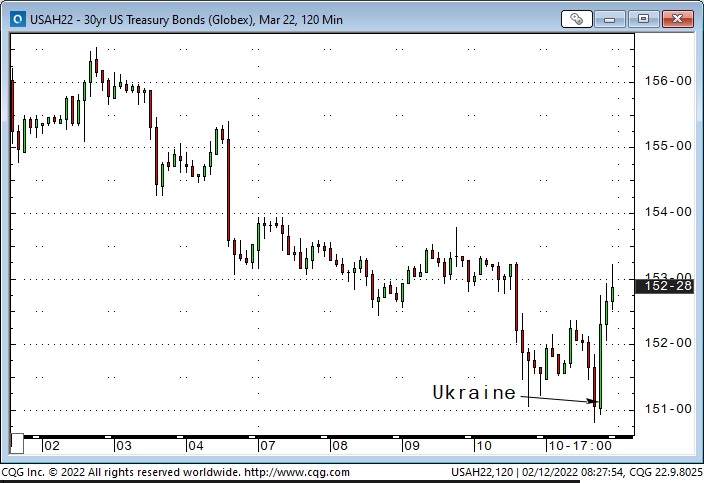
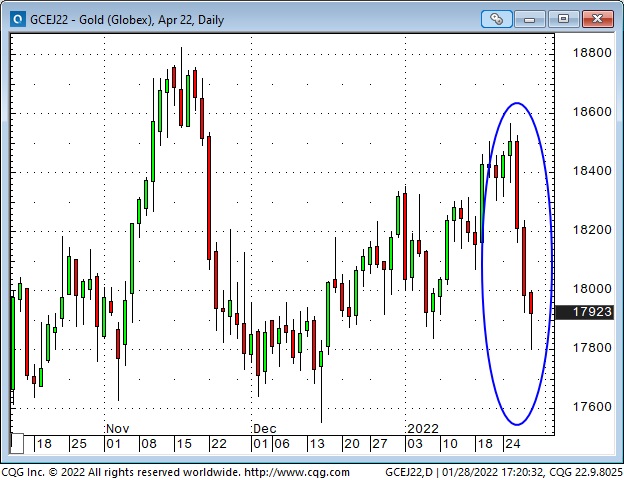
Late Friday morning, the “news” was that the White House expects the Russians to invade Ukraine next week and advised Americans in Ukraine to leave immediately. The US Dollar, Gold and crude oil soared, bonds bounced while stocks and other risk assets fell.
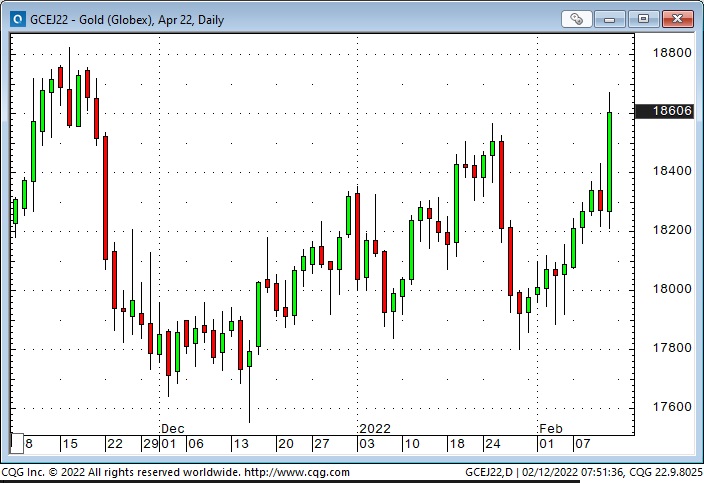
When gold and the US Dollar are rallying simultaneously, it is usually a sign that capital is seeking safety.
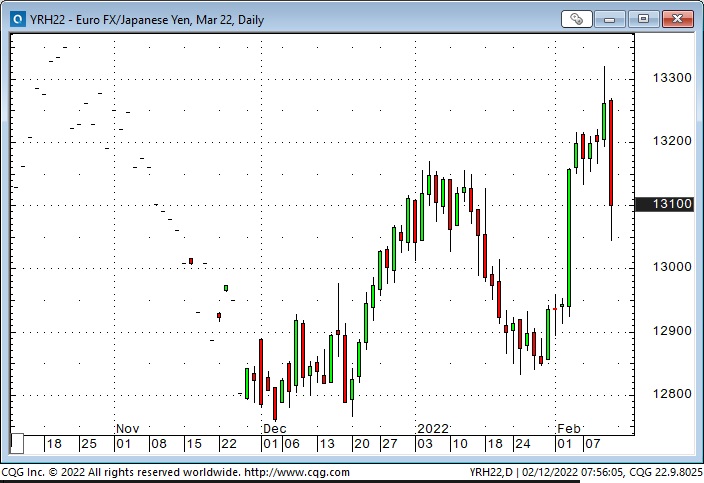
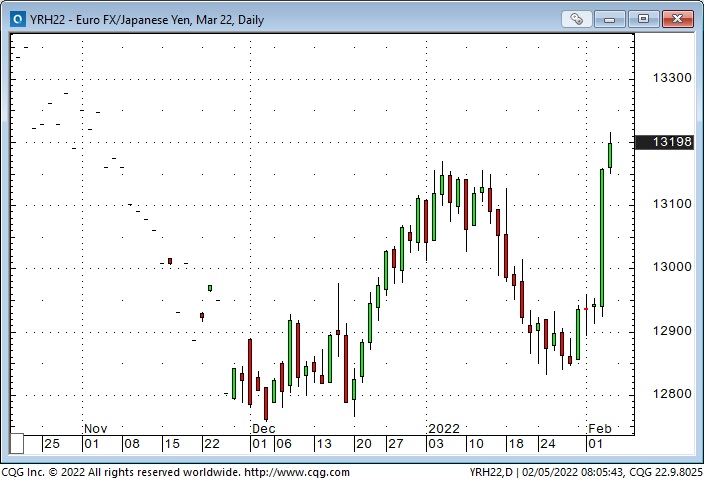
The Euro/Yen spread came in as Europe is at risk of Russia (in more ways than one), and the Yen is a go-to haven.
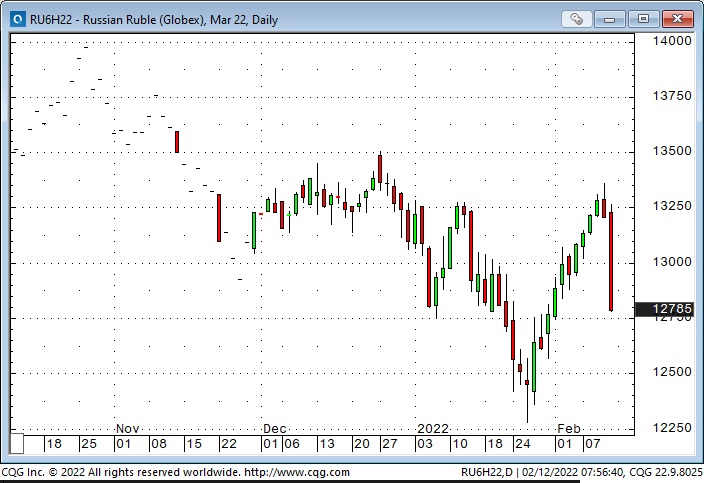
The Russian Ruble fell on the news.
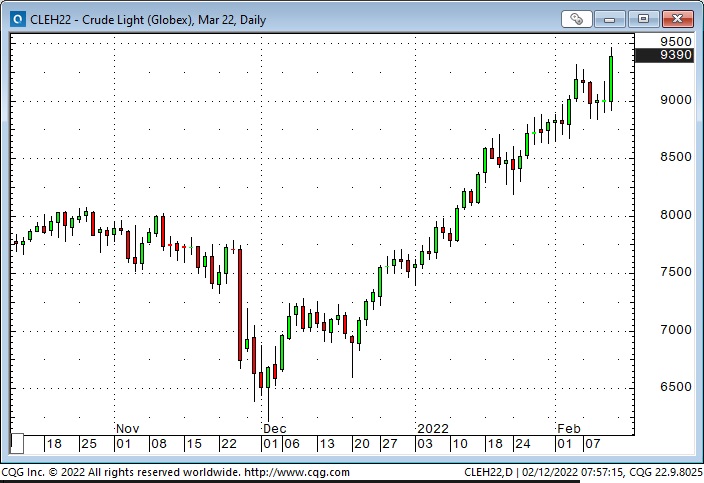
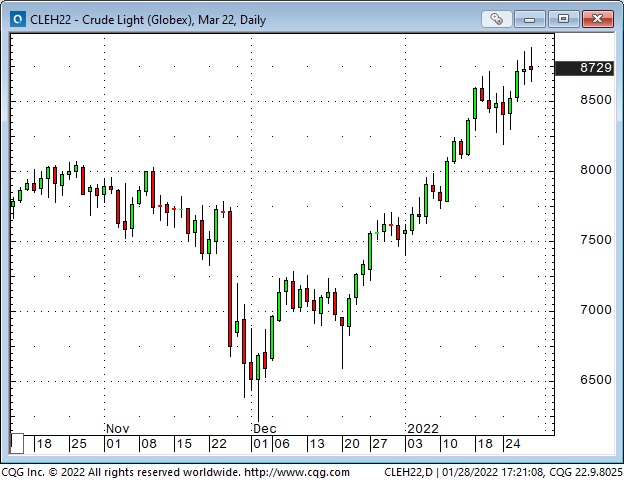
WTI crude oil jumped >$4 on the “invasion” story, with front-month March nearly touching $95. Backwardation steepened with March 2023 at >$14 discount to Mar 2022.
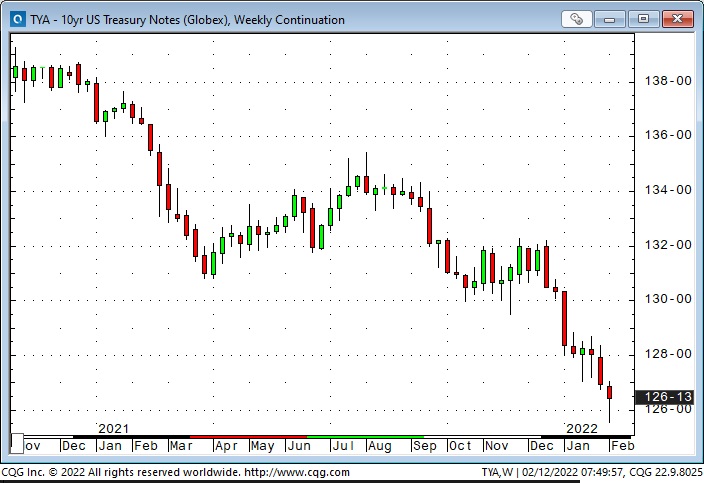
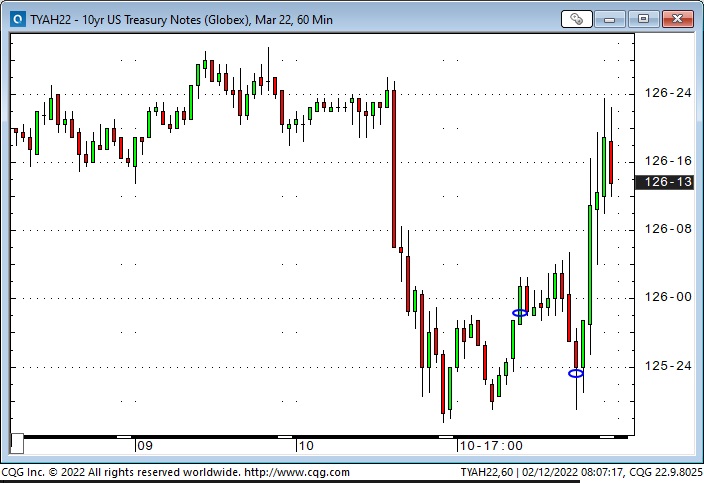
Before the Russian news hit, Treasury bonds were making new lows for the week (10-year yields hit a high of 2.06%). Bonds caught a “haven” and short-covering bid on the news.
My short term trading
I started this week with no position and stayed flat until Thursday. I was waiting for an opportunity to short the stock market, and it was rising Tuesday and Wednesday. The CPI report scheduled for early Thursday was another reason to wait.
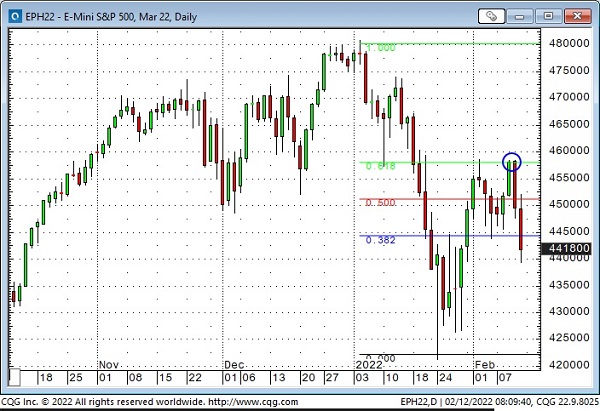
One of my favourite topping patterns is an “M” pattern where the right shoulder is lower than the left. The bounce from the January lows ran into resistance at the Fibro 0.618 level.
The Thursday CPI report was stronger than expected – interest rates lurched higher and kept rising throughout the day. Stock indices, currencies, gold and crude initially fell on the CPI report but then bounced back – until St. Louis Federal Reserve President Bullard opined that the Fed should “immediately” become aggressively hawkish.
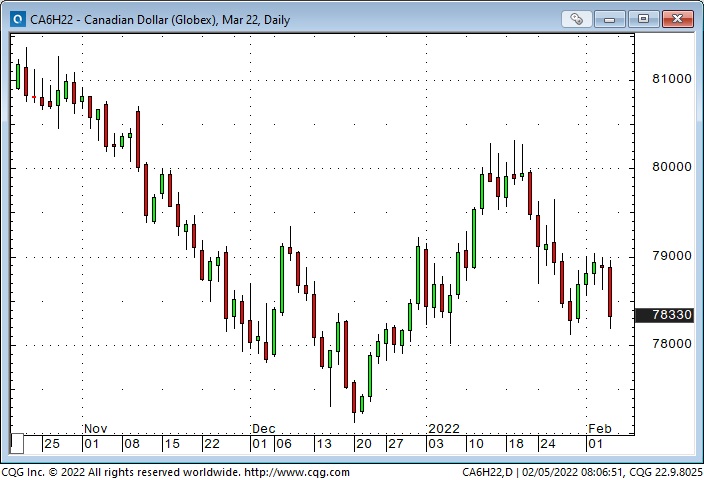
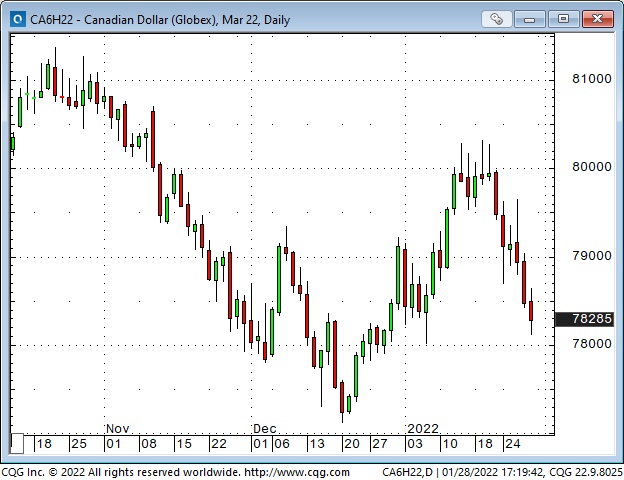
I bought the Canadian Dollar as it rallied back from its CPI-induced dip. The stock market was rallying, crude oil was rallying, and the Euro was rallying – all good news for the CAD, and if it broke above the recent highs ~79 cents, it might soar.
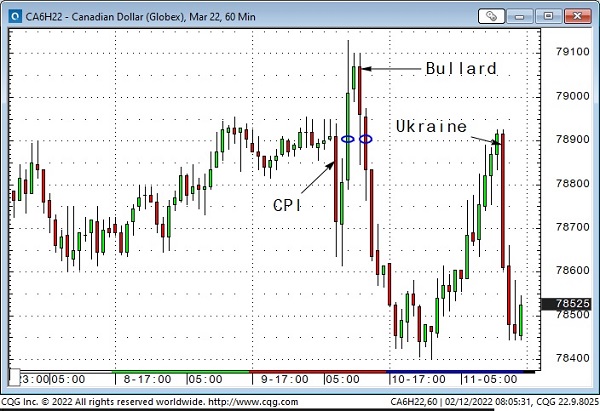
The CAD got to 7910 and then reversed along with other markets on the Bullard comments. When I saw the “across the board” reaction to the Bullard news, I covered my long CAD position immediately at a breakeven.
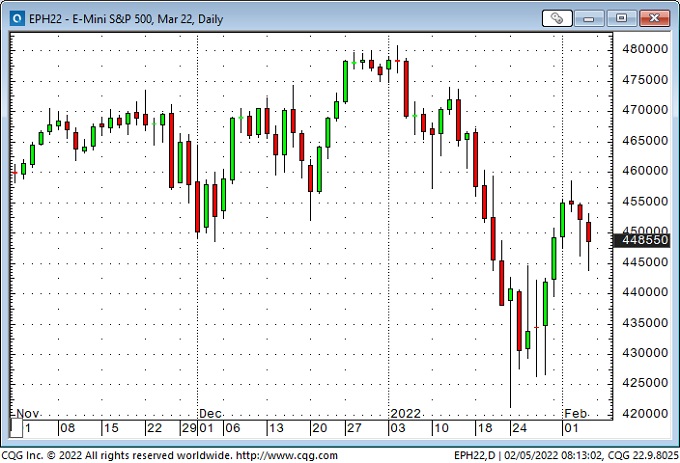
After covering the CAD, I realized I had a great setup to short the S+P. It had bounced back to last week’s highs on Tuesday, dropped from around those highs on the CPI report, jumped back to the “Bullard” highs and started to fall from there. (Falling away from a lower high.) I got short and watched the market fall ~70 points into the overnight lows.
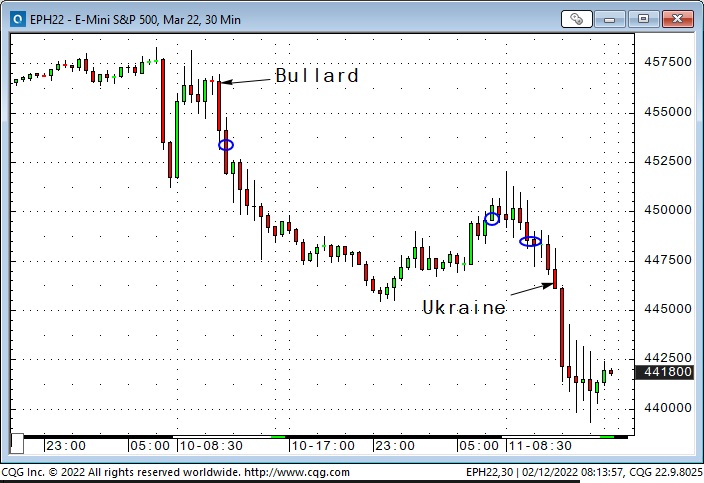
I covered my short S+P for a gain of ~30 points early Friday morning as the market rallied back ahead of the day session opening. I reinstated the position a couple of hours later when there was no follow-through to the opening range rally. The market then began to break down through technical levels and then plunged on the Russia/Ukraine news. With the market closing near the lows of the month, I decided to stay short into the weekend.
I bought T-Notes during the Thursday overnight session, thinking they were extraordinarily oversold and could bounce, considering the weakness in the stock market. The dramatic rise in short-term interest rates added to my view that the Fed could be tightening into an economic slowdown – yet another reason to buy bonds. My setup was buying the Notes after they bounced from a higher low, but I was stopped for a slight loss very early Friday morning – and missed the “Ukraine” bond rally on Friday.
My P+L on closed-out trades this week was essentially flat; I had unrealized gains on my short S+P of ~0.80%.
On my radar
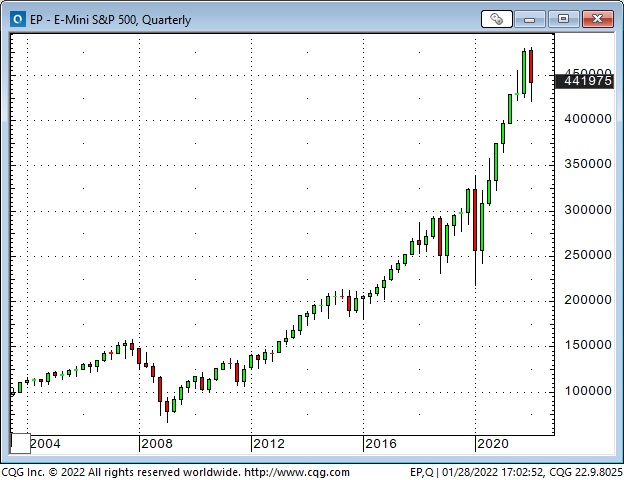
I’ve thought that the American equity markets may have made a long-term top at the beginning of this year. They’ve had an incredible run from the 2009 lows, with a spectacular run since the 2020 lows, but it may be time for a significant correction – something more than 10 to 15%.
Thoughts on trading
Regular readers know that I believe it is essential to keep the time frame of your analysis in sync with the time frame of your trading/investing. I think this is especially important in terms of risk management – for instance, don’t buy something for a short term flip and then decide to keep it as a long term “hold” because it’s gone against you and you “know” it will be a winner if you “give it a little more time.”
I will sometimes “mix” my time frames to find good entry points. For instance, even though most of the trades I write about are short-term, I definitely have longer-term market opinions. For the past several months, I’ve thought that the multi-year rally in stocks was getting long in the tooth. (Essentially, I thought market psychology had got to the point where too many people thought it was easy to make money buying stocks.)
I have a “bias” that the long-term trend in stocks may have topped out (and I should look for opportunities to make money shorting stocks). Still, I know that “having a bias” is not a timing tool, so I will analyze short-term price action to find setups where I can get short – in sync with my longer-term view of market direction. (I only trade futures and options, so by “stocks,” I mean stock index futures.)
Technical traders would likely describe this technique as “trading in line with the trend.” Depending on their preferences, if a market is in a long-term uptrend and experiences a short-term correction, they might “buy the dip” or buy a breakout to new highs. Either way, they use short-term technical signals to buy a rising market.
Quotes from the notebook
“People have an amazing ability to arrive at a solution before truly understanding the problem.” Chris Blundell P.Eng. 2022
My Comment: Chris is a long-time friend, well-read and well-travelled, who has had great success as an entrepreneur in the Canadian oil patch. He used this quote in a recent email to me. His comment is painfully accurate, and wouldn’t the world be a better place if people put a lot of effort and compassion into understanding a problem before offering their solutions?
“You can always (always) find some indicator, somewhere, that will suggest something is a bubble. If you couldn’t, a legion of bloggers running lucrative doomsday-themed websites would instead be serving gimlets to bankers for tips, rather than lampooning them for click money.” Walt, The Real Heisenberg
My Comment: I’ve been a subscriber to the Heisenberg Report for a few years. It’s well-written, biting, and insightful, and I love black humour!
“The lust for yield has overwhelmed prudence.” Bob Hoye, 2017
My Comment: Bob has been a good friend for 40 years. He is a very well-informed market historian and, as you can see, very quotable! A few years ago, I introduced Bob at a conference as a man who knew a lot about the Dutch Tulip Bubble Mania because he had been there while it happened.
The Barney report
Barney and I were home alone for a couple of days this week when my wife went to Vancouver. He was reasonably patient with me in my office, and I rewarded him (tired him out) with long off-leash walks. He is now five months old and just north of 40 pounds.

A Request
If you like reading the Trading Desk Notes, please forward a copy or a link to a friend. Also, I genuinely welcome your comments, and please let me know if you would like to see something new in the TD Notes.
Victor Adair retired from the Canadian brokerage business in 2020 after 44 years and is no longer licensed to provide investment advice. Nothing on this website is investment advice for anyone about anything.
Each week Josef Schachter gives you his insights into global events, price forecasts and the fundamentals of the energy sector. Josef offers a twice monthly Black Gold newsletter covering the general energy market and 30 energy, energy service and pipeline & infrastructure companies with regular updates. We also hold quarterly webinars and provide Action BUY and SELL Alerts for paid subscribers. Learn more.
EIA Weekly Oil Data: Overall, the EIA data of Wednesday February 16th was moderately bearish for energy prices as US Commercial Crude Stocks rose 1.1 Mb versus the forecast of a decline of 900Kb. The main reason for this difference is that Net Imports rose 230Kb or by 1.6Mb on the week. Motor Gasoline Inventories fell 1.3Mb while Distillate Fuel Oil Inventories fell 1.6Mb. Refinery Utilization fell 2.9 points to 85.3% from 88.2% a week ago and this slower refinery activity lowered inventories of products. US Crude Production remained steady at 11.6Mb.
Total Demand rose 860Kb/d to 22.74Mb/d as Other Oils demand rose by 1.019Mb to 5.80Mb. Motor Gasoline demand fell 556Kb/d to 8.57Mb/d. Jet Fuel Consumption rose 102 Kb/d to 1.51Mb/d. Cushing Crude Inventories fell 1.9Mb to 25.8Mb.
EIA Weekly Natural Gas Data: Weekly withdrawals are rising as the cold weeks of winter are here. Last week’s data showed a withdrawal of 222 Bcf, lowering storage to 2.101 Tcf. The biggest US draws were in the South Central (74 Bcf), the Midwest (64 Bcf) and the East (56 Bcf). While a large draw again, it is by no means one for the record books. The largest US draw occurred in early January 2018 at 359 Bcf and the largest draw last year occurred in mid-February with a draw of 338 Bcf. We have now had four weeks of winter draws over 200 Bcf.
The five-year average for last week was a withdrawal of 177 Bcf and in 2021 was 171 Bcf due to mild weather. Storage is now 9.3% below the five-year average of 2.316 Tcf. Today NYMEX is US$4.52/mcf due to an expected colder spell in the coming days. AECO is trading at $3.59/mcf due to the milder weather in western Canada. February (being the key winter month for natural gas demand), is still likely to see price moves to the upside on very cold days. After winter is over natural gas prices typically retreat and if the general stock market decline unfolds as we expect, a great buying window should develop at much lower levels for natural gas stocks in Q3/22.
OPEC January Monthly: On February 10th OPEC released their February 2022 Monthly Forecast Report (January data). As repeated in the past few months they have not added the 400Kb/d, their stated monthly production increase. In January only 64Kb/d was added. Production rose to 27.981Mb/d but remains below the 29.368Mb/d produced in December 2019 before the pandemic hit. So they still have nearly 1.4Mb/d to bring on just to get back to pre-pandemic levels. Moral suasion by the US, China and India does not seem to be influencing OPEC’s production decisions. OPEC may be watching events in Europe and may be standing by to add more production if energy export sanctions are implemented against Russia upon any invasion of Ukraine. Saudi Arabia and the UAE alone could add 2.5Mb/d if they wanted to.
The biggest increase came from Nigeria at 81Kb/d, followed by Saudi Arabia at 54Kb/d and then by UAE at 44Kb/d. Surprisingly Kuwait only added 27Kb/d to 2.58Mb/d, even though they could have added 130Kb/d more just to get back to 2019 pre-pandemic levels of 2.71Mb/d. Sanctioned Iran saw production rise by 21Kb/d to 2.503Mb/d. Venezuela saw a decline of 51K b/d as they could not get sufficient diluent this month from Iran, China or Russia. OPEC sees 2022 consumption at 100.8Mb/d, up 4.15Mb/d from the 96.63Mb/d consumed in 2021.
Baker Hughes Rig Data: The data for the week ending February 11th showed the US rig count rose by a significant 22 rigs (up three rigs the prior week) to 635 rigs last week. Of the total rigs working last week, 516 were drilling for oil and the rest were focused on natural gas activity. The overall US rig count is up 60% from 397 rigs working a year ago. The US oil rig count is up 69% from 306 rigs last year at this time. The natural gas rig count is up a more modest 31% from last year’s 90 rigs, now at 118 rigs. Texas had the largest increase in rigs with 13 added last week and the total rising to 300 rigs. The Permian (Texas and New Mexico) added seven rigs taking the total rigs working in this lucrative basin to 301 rigs.
Canada had an increase of one rig (up one rig last week as well) to 219 rigs. Canadian activity is up 24% from 176 rigs last year. There was one more oil rig working last week and the count is now 137 oil rigs working, up from 101 last year. There are 82 rigs working on natural gas projects now, up from 75 rigs working last year. Staffing of rigs in Canada is becoming a problematic issue and adding significant more rigs in the near term is unlikely. While day rates are rising, so are costs and margin improvements so far are not what one should expect as the industry activity picks up.
The overall increase in rig activity from a year ago in both the US and Canada should translate into rising liquids and natural gas volumes over the coming months. The data from many companies’ plans for 2022 support this rising production profile expectation. We expect to see US crude oil production reaching 12.0Mb/d in the coming months. Companies are taking advantage of attractive drilling and completion costs and want to lock up experienced rigs, frack units and their crews as staffing issues are difficult for the sector. We expect US production to reach 12.5Mb/d before the end of this year.
Conclusion:
Bearish pressure on crude prices:
1. The Omicron pandemic is far from over but is losing its impact on individuals’ reticence to move about. Usage of energy as mandates are loosened and vaccination rates have risen is increasing especially for Jet Fuel. Covid-19 deaths are rising for the unvaccinated. Deaths in the US have reached 922K (up 16K over the last week) and worldwide has reached 5.83M.
2. The window for Russia to invade Ukraine is closing. If they want to move in they need to do so in the next two-three weeks or they will miss the window. Heading into mid-March the ground of attack will have thawed out and an invasion becomes unlikely. The window for exercises ends on February 20th so around this date is the window for any military action. Some NATO sources now see Russia having 180K troops in position to invade and that Kiev could be a key target.
A few days ago Russia acknowledged that it was willing to go the diplomatic route. Was this part of the poker game or a sign of good faith? They say that they have removed some troops from the front lines, however NATO does not see sufficient evidence of this but rather sees more troops being added across the invasion routes. Is this a removal of troops needing maintenance on their equipment and maybe some R&R, before being brought back to the front lines? Russia has staging areas deeper in Russia and Belarus as well as forward bases close to Ukraine’s border. In the meantime Russian hackers have increased their cyberwarfare attacks in Ukraine. Ukraine’s military (command and control) services and two large banks were targeted in recent days.
3. The Iran nuclear negotiations are working towards sealing a deal and having sanctions removed so that they can sell their oil around the world. Negotiations appear to be making a breakthrough with a timeline of the end of February. President Biden may be giving away more to Iran in order to have sanctioned Iranian oil available if Russia invades Ukraine. If Iran receives sanction relief it could increase production by over 1.5Mb/d almost immediately. Iran also has over 200Mb in storage around the world near its buyers, so those volumes could be added to supplies quite quickly.
Bullish pressure on crude prices:
1. Russia provides over 26% of western Europe’s crude oil needs and around 41% of its natural gas needs. Any sanctions on these sales would not be easily met by other producers. This effectively is a two-edged sword. The US is sending over more cargoes of LNG and has asked Qatar to do the same. While the Nord Stream 1 pipeline is operational with gas flowing into Germany, the second pipeline is part of the potential sanction regime by President Biden. Germany may accede to this but has not done so publicly as they desperately need the natural gas. Current levels of imports into EU countries may stay at current levels but increases (especially of Nord Stream 2) will not be permitted.
2. Russia has threatened increased cyber attacks against Ukraine and NATO countries (including the US) if President Biden escalates pressure on Russia upon any invasion activity. Cyberwarfare against Ukraine’s infrastructure and military control systems has already started. The US and many other countries have ordered their citizens to leave the country and have closed their embassies in the capital Kiev moving some personnel to Lviv in western Ukraine near the Polish border.
CONCLUSION:
The concern about an imminent invasion of all of Ukraine continues to spike crude oil prices higher. WTI rose to over US$96/b this week. WTI today is at US$94.82/b. If Russia just moves on eastern Ukraine then crude could spike to nearly US$120/b. If Russia plans on taking over all of Ukraine and places its military on the borders of Poland, the Baltic countries and Romania, facing off against NATO forces, then crude oil prices could spike even higher. We do not see Russia planning to go that far. It may want to gather the Russian speaking people in eastern Ukraine into its orbit and have a land corridor to Crimea, but anything more would invite insurgency warfare in western Ukraine.
If there is no invasion in the next short while and no sanctions against Russian energy exports occur, then the price of WTI crude should retreat quickly towards US$62-65/b as the war premium is removed and weak economic data around the world hint at recession this year. If sanctions against Iran oil sales are removed by an agreement during March, then crude oil prices would head down quite fast.
Energy Stock Market: The S&P/TSX Energy Index currently trades at 204 (up eight points over the last week) as the war event window closes in.
Our February SER Monthly Report comes out next Friday and covers the latest signs of internal deterioration in the general stock market and increased weakness in key world economies. Significant stock market downside is ahead and investors should be defensively prepared. The MEME stocks have been massacred and a few of the FAANG and related stocks have been severely eroded in value (Meta-FB, Netflix, Roblox, Shopify, Viacom and Zoom are just some of the recent sharp decliners) Remember how you felt in the later stages of bear markets as were seen in 1987, 2000, 2008, and 2020? Prepare yourselves for this impairment risk to your assets. Last week alone we had two down days over 500 points in the Dow Jones Industrials. Much greater daily declines are likely in the weeks ahead.
Our February SER report covers this painful market situation. The Q4/21 and year end results for 2021 are starting to be released for the 30 companies that we cover. In next week’s issue we cover those companies that have reported by the close on Friday February 18th. In the March issues we will cover the rest of the regular reporting run.
Our Q1/22 quarterly SER webinar will be held on Thursday February 24th at 7PM MT. If you want to join/register for this event or access our Interim Report or the upcoming SER Monthly become a subscriber. Go to https://bit.ly/34iKcRt to subscribe.
Please feel free to forward our weekly ‘Eye on Energy’ to friends and colleagues. We always welcome new subscribers to our complimentary energy overview newsletter.
Interest rates surge higher everywhere
Christine Lagarde surprised markets Thursday by opening the door to higher interest rates this year from the ECB. On Friday, markets were stunned by an unexpected (and suspect, given the massive “seasonal adjustments”) US Employment report. The net result? Interest rates everywhere surged higher this week.
Think of Euribor as the EUR equivalent of the Eurodollar interest rate contract. This dramatic tumble has a HUGE “rate of change.”
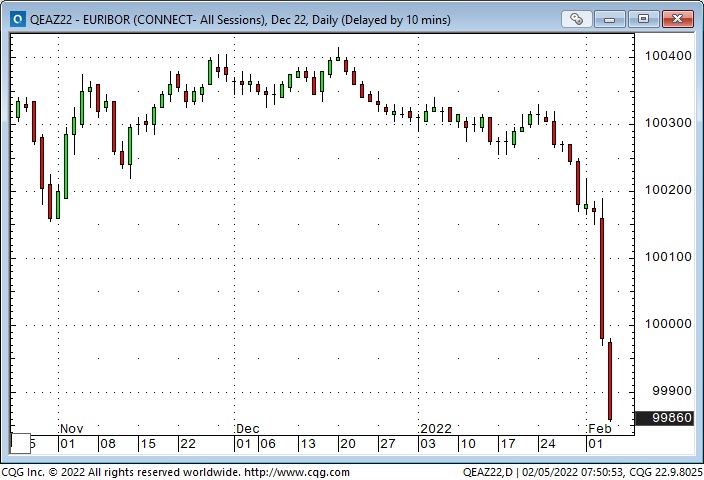
The Eurodollar futures trade at a discount to par (zero yields.) A 9835 figure implies a ~1.65% interest rate come December 2022.
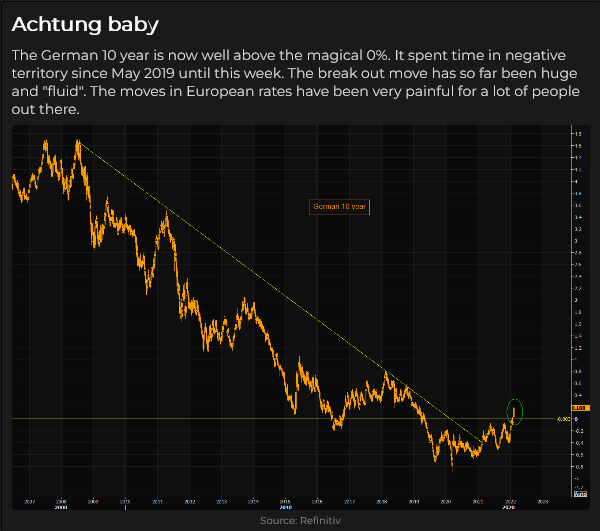
US 10 year Treasury yield now above 1.90%.
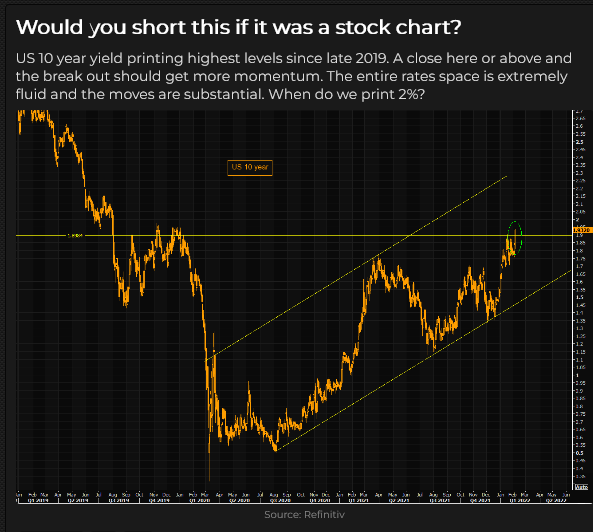
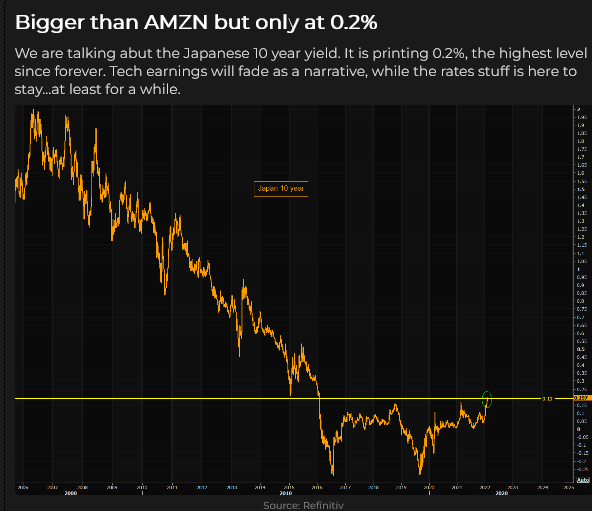
Even Japanese bond yields traded to 5-year highs. (Remember the “widow-maker” trade? For years, traders made big bets on Japanese yields rising – but they got “carried out” fighting the BoJ.)
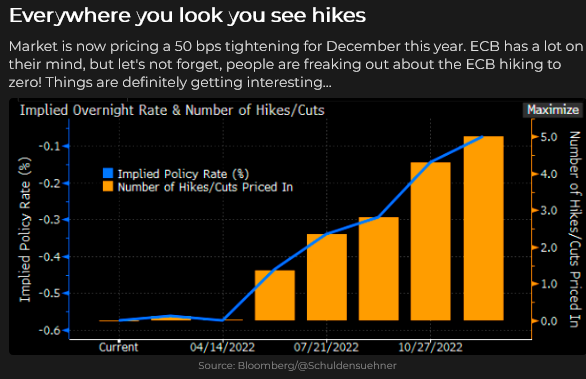
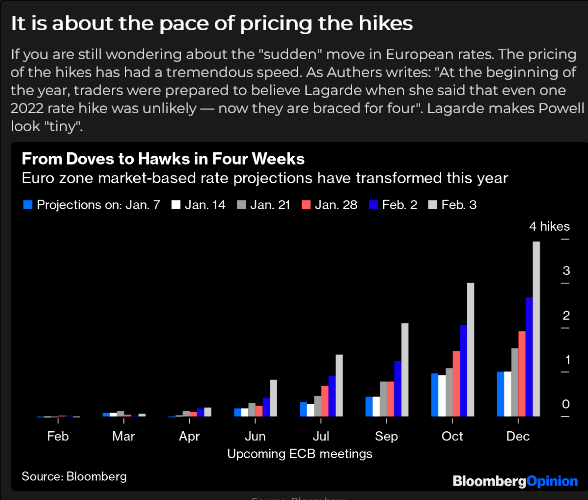
Markets are currently pricing at least 2 x 25bps bumps from the ECB this year. German bond yields are back above zero for the first time in 3 – 4 years. All European sovereign yields have spiked higher, and spreads against Germany have widened. On Thursday, the Bank of England raised s/t rates 25bps, but the ECB stole the show.
The shocking “rate-of-change” is probably more important than the net change. On January 15th, I asked if the surge in rates following the Fed meeting was Peak Fed Hawkishness or A Minsky Moment. I defined a Minsky moment as a “sea-change at the Fed, and you ain’t seen nothing yet!”
Right now, it looks like the Minsky horse is ahead by 20 lengths.
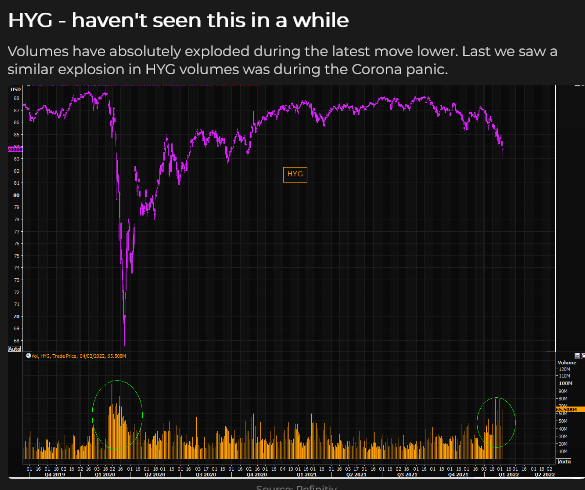
Not only are interest rates everywhere rising, but credit spreads are widening – weaker credits will have to pay much more to borrow money.
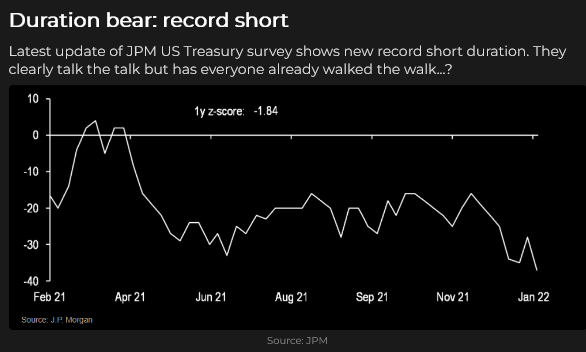
Positioning: It looks like everybody is already short of the US Treasury bond market.
Currency markets reacted swiftly
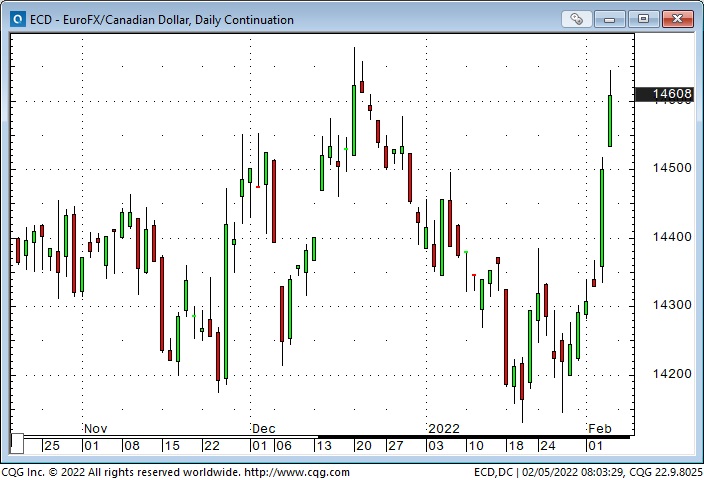
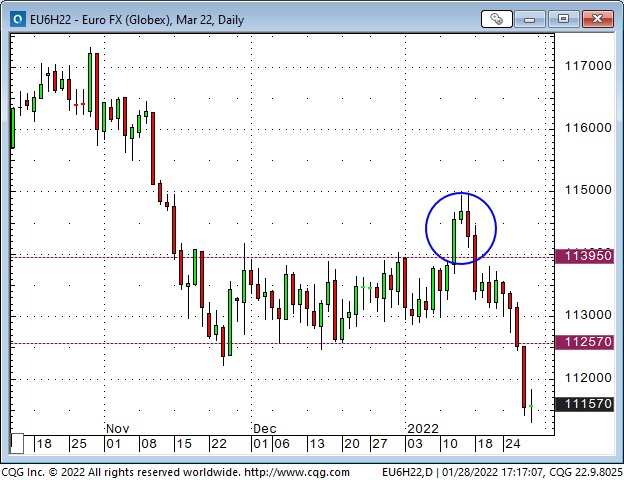
The surprise move by Lagarde and the subsequent surge in Eurozone interest rates saw the Euro currency rally hard against all other currencies.
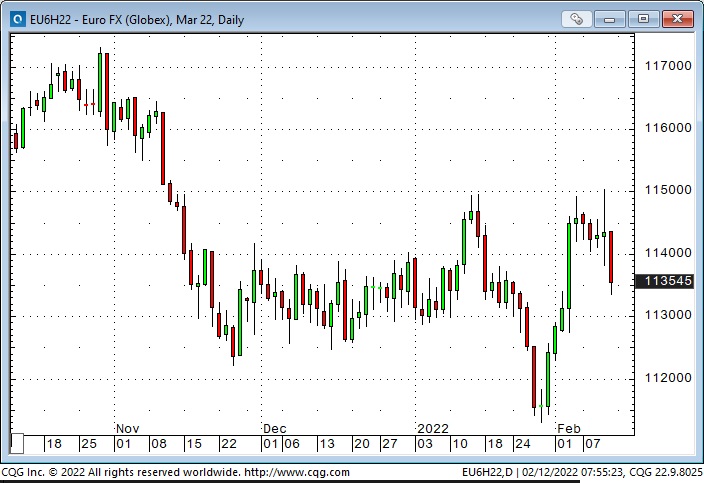
The Euro against the USD.
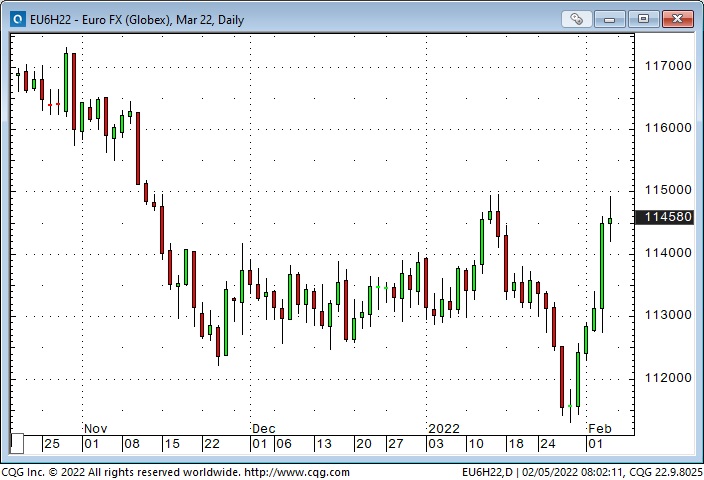
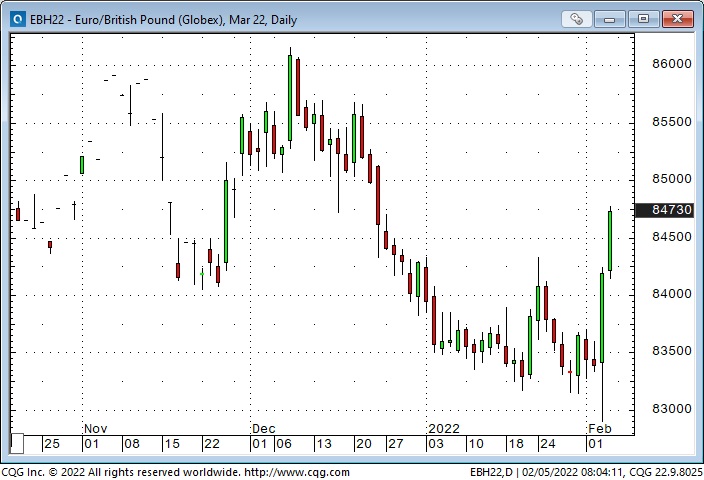
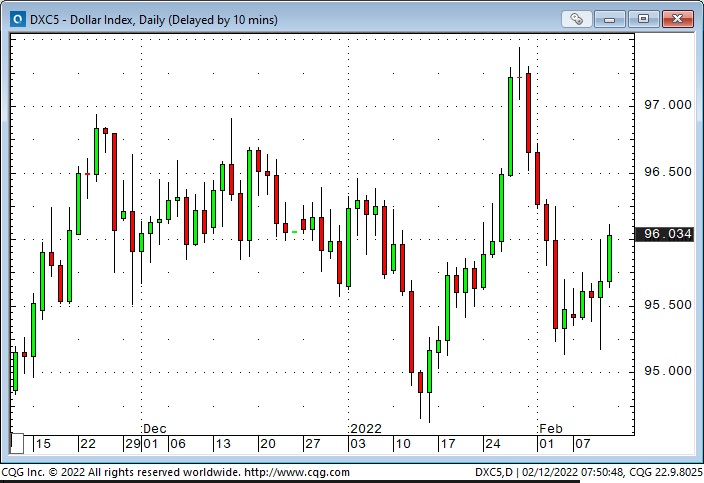
The US Dollar Index hit an 18-month high last week as markets expected Fed policy would maintain a substantial interest rate premium over other countries. That changed Thursday when ECB surprised markets, and the EUR had its biggest one-day gain in years.
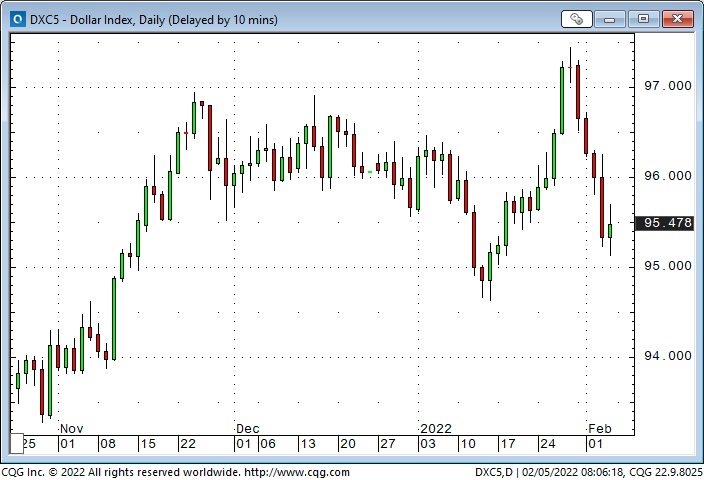
The Canadian Dollar has been surprisingly weak the past couple of weeks – given the strength in crude oil (Western Canada Select in nearly CAD$100 BBL) and the recent weakness in the USD. Perhaps the CAD is struggling in a “risk-off” environment.
Stock indices rallied hard early this week, then reversed
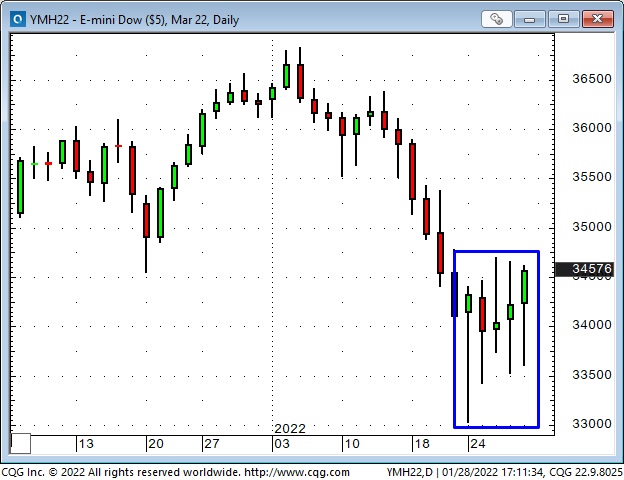
The wild intra-day and inter-day swings that we saw in January continued this week, with the DJIA swinging >2,500 points from last week’s low to this week’s high. The DJIA closed ~360 points above last week’s close at the end of the week. And, ICYMI, Facebook had a bad week.
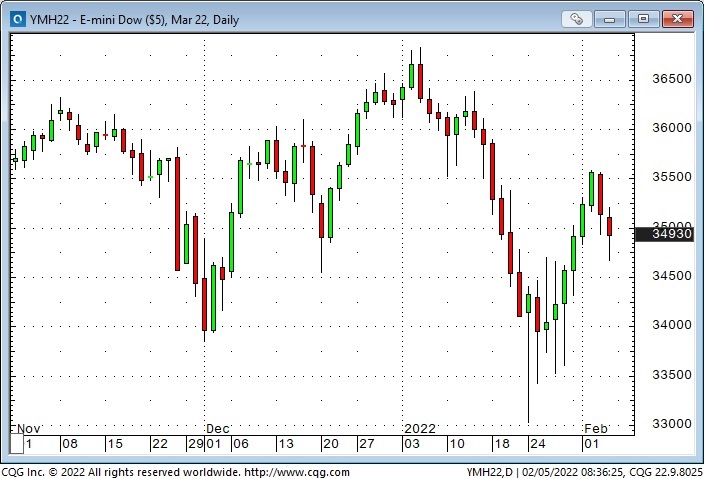
Facebook reported after the close Wednesday. By Thursday, the stock was down ~27% for a market cap loss of ~$230Billion.
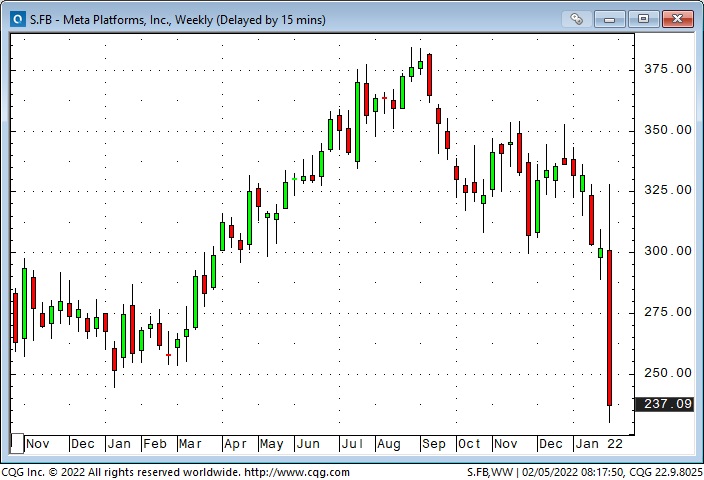
This chart was dated Wednesday when the DJIA was up ~2,400 points from last week’s lows.
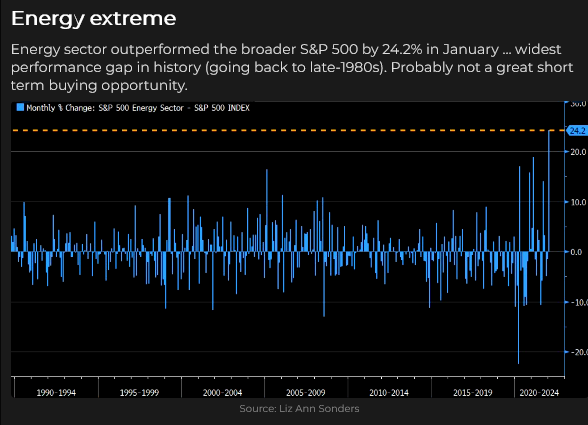
Energy markets are hot
WTI crude oil traded above $93 this week – an 8-year high – up ~50% from the beginning of December. Prices have climbed for seven consecutive weeks. Energy share indices outperformed the S+P by ~24% in January – the widest monthly gap in over 40 years.
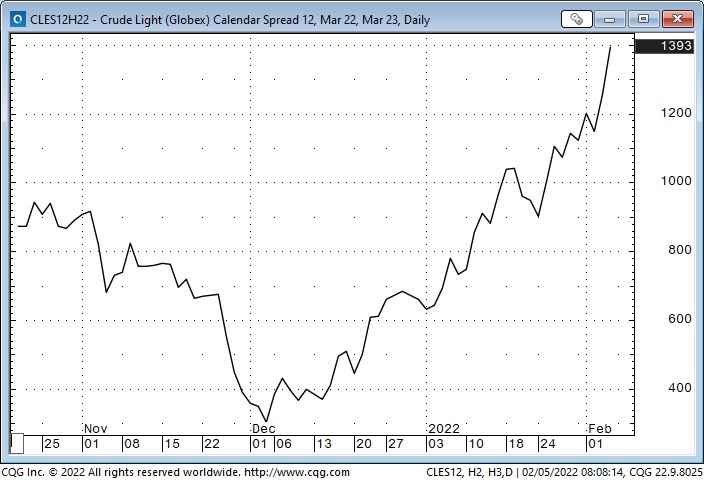
The forward WTI curve is exceptionally steep, with front-month March 2022 ~$13.90 premium over March 2023. (The $10 increase since early December is “stunningly HUGE!!”)
Rising geopolitical tensions are contributing some “fear” premium to the crude oil price, but the ESG inspired “Consequences of Procrastination,” which have created self-destructive energy policies in much of the Western World, are the real driving force behind the energy rally.
China hosts the Olympics from February 4th to 20th. Geopolitical stress may increase after the Olympics are over. Remember, Russia annexed Crimea immediately following the Sochi Olympics in February 2014.
Covid has disappeared from the market’s rear-view mirror
Covid had a HUGE impact over the past two years, spurring massive monetary and fiscal stimulus, lockdowns, social tensions, supply chain disruptions, and HUGE gains in the leading stock indices. But markets are looking ahead.
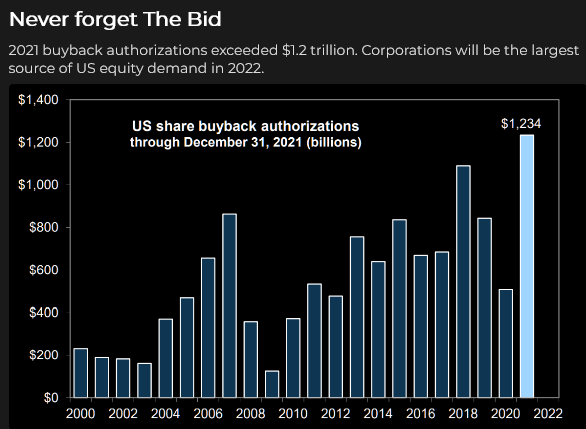
The Bullish case: The pandemic policies that have crippled the economy will soon be over, and the re-opening economy will be robust. Interest rates rising 1 – 2% will not be a headwind. Inflation has peaked, and the recent correction has been healthy. The indices will rebound as capital “rotates” to stocks that prosper in the new economic environment. There are trillions of dollars on the sidelines (that could come into the market), potentially massive corporate buybacks, and passive flows (now more than 50% of total flows) will continue – where else can capital go? TINA.
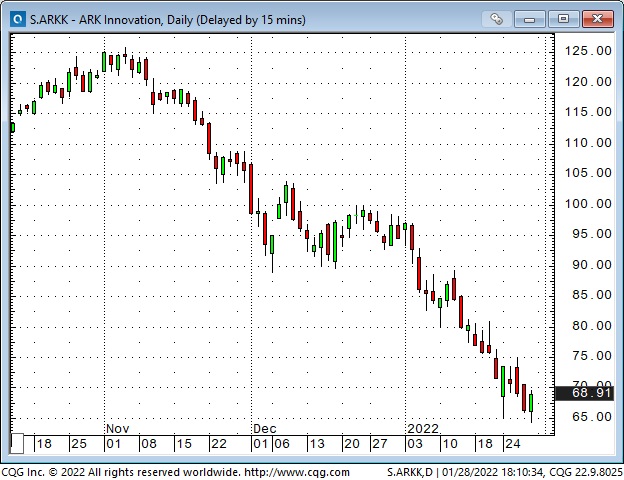
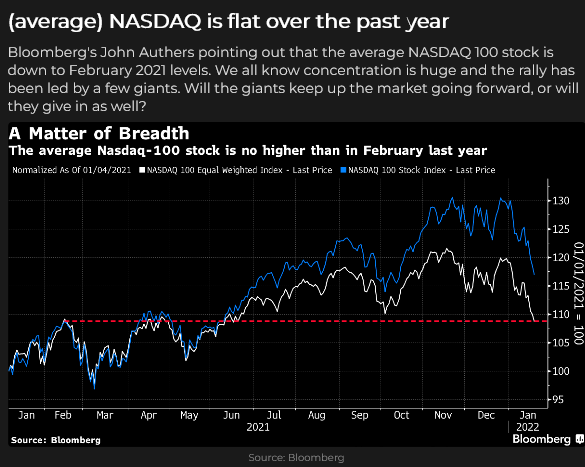
The Bearish case: The HUGE gains in 2021 were an anomaly. The bubble has already popped. The perpetual motion machine finally ran out of gas, and speculators are exhausted. For the past several months, the indices have trended higher on the back of Big Cap stocks while breadth deteriorated. ARKK, an example of speculative excess and poor risk management, has fallen 50% in the past three months. The sea-change in Fed policies in late 2021 marks the top of a 12-year bull market that went parabolic on easy money, TINA, FOMO, corporate buybacks and Passive inflows. The Fed will be tightening into a slowdown; it will not cool inflation, and stagflation will result. Emerging markets have been in a bear trend for months.
My short term trading
I bought the S+P mid-day Friday of last week, and, with the market surging higher into the close, I stayed long over the weekend. The market was strong early Monday, and I sold the position to gain ~80 points.
I frittered away about 30 points Tuesday, Wednesday and Friday, taking quick losses on short positions. At the end of the week, I was flat, and my P+L had a net gain of ~0.50%.
This week, I had several real-world “distractions” and never got “in sync” with the market action. That’s life, but I was whimpering to myself that I need to be more disciplined – I need to get my priorities straight and not allow real-world events to distract me from trading. Fat chance of that happening. Luckily, a good friend reminded me, yet again, that there’s a rumour going around that markets will be open again next week.
On my radar
I expect dramatic rotation within the market. A ton of money is trapped in stocks that suffered HUGE declines, and it is now “dead money.” The indices fell 10 -15% from the January highs and have bounced back ~50% of that break. I expect the bounce to run out of steam and roll over before reaching the January highs. If a bear market has begun, I expect to see nasty bear market rallies ahead. As Richard Russell used to say, “Everybody loses money in a bear market.”
Thoughts on trading
One of the best things about writing this blog is that I get fantastic emails from people I’ve never met. Here’s a brief quote from a subscriber:
“One Comment that really had an impact on my trading came from an extremely successful trader from Europe who spent ten years at a brokerage before trading his own account. He said, “After watching thousands of you guys make tens of thousands of trades over ten years, there’s one thing that jumped out at me: You LOVE to pick tops and bottoms! Whereas the guys with the multi-million-dollar accounts wait until the trend is so obvious they just have to pick up the money.”
I like that quote because it reminds me of something I used to say – something that I learned from being in the brokerage business for over forty years. My quote:
“Over the years, I’ve watched 100s and 100s of clients lose millions and millions of dollars. One of the things they all had in common was that, sooner or later, they decided to let a losing trade have “a little more time.”
Keep the time frames of your analysis and trading/investing in sync. It is SO easy to develop a multi-year macro investment idea, put on a trade, have it go against you, and then you have to wait years for your vision to materialize. Be patient. Focus on “when” to put on a trade, not “why.”
Quotes from the notebook
“FOMO leads to chasing – be patient; if you don’t have a good setup, don’t trade.” Tyler Bollhorn at the World Outlook Financial Conference, February 2022. Tyler was responding to Mike Campbell, the conference host, asking the closing panel for advice on avoiding losses / managing the risks of trading or investing.
My Comment: I agree 100%! Tyler and I kicked the idea around later, off-camera, and we both decided that it’s SO easy to see something developing – and you “have” to get on board even if it means not having a good setup – and then when the market starts going the wrong way you’re playing defence short-handed!
“Wait for your setup, and then pull the trigger. Don’t chase it if you don’t take the trade when you should. You MUST learn to stay on the sidelines in that case. There will always be another trade.”
“Fear of losing causes you to not trade when you know you should (the hard trade.) FOMO causes you to chase. Fear of having made a bad entry by chasing leaves you at risk of being shaken out early.” Peter Brandt RealVision September 2019
My Comment: Peter and I both worked at ContiCommodity in the late 1970s, but I never met him back then. In 1981 he started working for Commodity Corp, a prop trading firm. A few years later, he went out on his own and has made his living ever since by trading his own accounts. (He tried managing money for friends one year and hated the fear of losing other people’s money, so he stopped.)
Peter and I swapped many emails the last few years and finally had a wonderful face-to-face visit in Tucson in 2019.
I think it’s perfect that Tyler and Peter both offer essentially the same advice. It’s worth listening to people who have learned their lessons the hard way.
The Barney report
The “Barns” is getting bigger and stronger – and more imaginative. He’s just a week short of five months old. We make a point of getting him out for at least two walks a day, regardless of the weather. He has well and truly upset my previous daily routines, but I love the little guy! (This abandoned railroad near our house makes a terrific off-leash track.)

A Request
If you like reading the Trading Desk Notes, please forward a copy or a link to a friend. Also, I genuinely welcome your comments, and please let me know if you would like to see something new in the TD Notes.
Victor Adair retired from the Canadian brokerage business in 2020 after 44 years and is no longer licensed to provide investment advice. Nothing on this website is investment advice for anyone about anything.
Each week Josef Schachter gives you his insights into global events, price forecasts and the fundamentals of the energy sector. Josef offers a twice monthly Black Gold newsletter covering the general energy market and 30 energy, energy service and pipeline & infrastructure companies with regular updates. We also hold quarterly webinars and provide Action BUY and SELL Alerts for paid subscribers. Learn more.
EIA Weekly Oil Data: Overall, the EIA data of Wednesday February 2nd was moderately bullish for energy prices as US Commercial Crude Stocks fell 1.0Mb (the forecast was for a build of 1.5Mb). The most bearish metric was that Motor Gasoline Inventories rose 2.1Mb. Distillate Fuel Oil Inventories fell 2.4Mb as cold weather increased heating oil demand. Refinery Utilization was at 86.7%, down 1.0% from the prior weeks 87.7%. Two years ago, just prior to the pandemic hitting, the rate was 87.4%. US Crude Production fell 100Kb/d to 11.5Mb last week due to weather disruptions.
Total Demand fell 1.0Mb/d to 21.41Mb/d as Other Oil demand fell 669Kb/d. Motor Gasoline demand fell 278Kb/d to 8.23Mb/d. Distillate Fuel demand fell 85Kb/d to 4.67Mb/d. Jet Fuel Consumption rose by 188 Kb/d to 1.47Mb/d. Cushing Crude Inventories fell 1.2Mb to 30.5Mb.
Overall we would rate this week’s data as modestly positive for energy prices. The main focus of the markets remains, what will happen across Europe if Russia invades Ukraine. The invasion, if it does occur, is likely to commence in the next week or so when the ground is firm enough for tanks and other heavy weapons to maneuver.
EIA Weekly Natural Gas Data: Weekly withdrawals are rising as the cold weeks of winter are here. Last week’s data showed a large withdrawal of 219 Bcf (the largest so far this winter), lowering storage to 2.591 Tcf. The biggest US draws were in the South Central (81 Bcf), the Midwest (69 Bcf) and the East (60 Bcf). The largest US draw ever occurred in early January of 2018 at 359 Bcf and the largest draw in 2021 occurred in mid-February with a draw of 338 Bcf. We have now had two weeks of winter draws over 200 Bcf. The current freeze across the eastern part of the US should make for another big decline week coming up.
The five-year average for last week was a withdrawal of 178 Bcf and in 2021 was only 128 Bcf due to mild weather. Storage is now 1.0% below the five-year average of 2.616 Tcf. NYMEX today is US$5.38/mcf due to the colder weather. AECO spot today is trading at $4.85/mcf. February (being the key winter month for natural gas demand), we are likely to see large price moves to the upside on very cold days. Spikes over $6/mcf could occur.
After winter is over natural gas prices typically retreat and if the general stock market decline unfolds as we expect, a great buying window could develop at much lower levels for natural gas stocks in Q3/22.
Baker Hughes Rig Data: The data for the week ending January 28th showed the US rig count rose by six rigs (up three rigs the prior week) to 610 rigs last week. Of the total working last week, 495 were drilling for oil and the rest were focused on natural gas activity. The overall US rig count is up 59% from 384 rigs working a year ago. The US oil rig count is up 68% from 295 rigs last year at this time. The natural gas rig count is up a more modest 31% from last year’s 88 rigs, now at 115 rigs.
Canada had an increase of five rigs (up 21 rigs last week) as activity continued to recover from the holiday season to 217 rigs. Canadian activity is up 25% from 174 rigs last year. There was one more oil rig working last week and the count is now 135 oil rigs working, up from 98 last year. There are 82 rigs working on natural gas projects now, up four rigs from the prior week and up from 76 rigs working last year.
The overall increase in rig activity from a year ago in both the US and Canada should translate into rising liquids and natural gas volumes over the coming months. The data from many companies’ plans for 2022 support this rising production profile expectation. We expect to see US crude oil production reaching 12.0Mb/d in the coming months. Companies are taking advantage of attractive drilling and completion costs and want to lock up experienced rigs, frack units and their crews as staffing issues are difficult for the sector. We expect US production to reach 12.5Mb/d during 2H/22.
Conclusion:
Bearish pressure on crude prices:
1. Omicron Covid-19 caseloads have not gone away and deaths are rising for the unvaccinated. Deaths in the US have reached 887K (up a shocking 21K over the last week) and worldwide has reached 5.67M. The US faced a record 2,400 deaths during one day last week and may reach the horrendous level of over 1M dead this year.
2. Some European countries like Germany and France are not inclined to follow the US lead to aggressively sanction Russia if it invades eastern Ukraine. They have strong reciprocal economic interests with Russia. They may be willing to accede to Russia’s annexation of eastern Ukraine. An overall invasion to take over the whole country may be a different situation for them. Berlin has not sent any weapons to Ukraine compared to other countries. They have only sent medical support and helmets so far. If there is an invasion and Germany and France do not go along with President Biden’s move to sanction energy exports from Russia then crude prices will lose their war premium.
3. Russia is expanding its port at Vyborg (NW of St Petersburg and near Finland) with the help of global trading house Trafigura. This expansion of this little used facility could export 2Mb/d of crude oil in the future.
4. Saudi Arabia and Kuwait are planning to increase crude production from the neutral zone between the two countries. Production potential from the two fields (Khafji and Wafra fields) in the zone are estimated at 550Kb/d and currently produce around 300Kb/d. Saudi sources see potentially increasing supply from these fields by over 200Kb/d within months. Longer term upside is forecast at an increase of 300 Kb/d compared to current levels.
Bullish pressure on crude prices:
1. Russia provides over 26% of western Europe’s crude oil needs and around 41% of its natural gas needs. Any sanctions on these sales would not be easily met by other producers. This effectively is a two-edged sword. The US is sending over more cargoes of LNG and has asked Qatar to do the same.
2. OPEC increased production in December by only 166 Kb/d and not the authorized 400Kb/d. OPEC+ held their February meeting today and agreed to an increase of 400Kb/d in their official target for March 2022. They are unlikely to reach this level as they have in recent months failed to see this target increase met. Many of the members have not spent to keep fields maintained and some have significant infrastructure problems.
3. The Iran nuclear negotiations are working towards getting sanctions removed so that they can sell their oil around the world. Negotiations do not appear to be making progress, holding off a potential addition of over 1.5Mb/d if sanctions were removed. The timeline for negotiations to end is the end of this month.
4. Russia has threatened cyber attacks against the US if President Biden escalates pressure on Russia to unacceptable limits. Cyberwarfare against Ukraine’s infrastructure and military control systems may be the prelude to the invasion.
5. Ukraine’s President Zelensky on February 2nd said ‘this is not going to be a war of Ukraine and Russia. This is going to be a European war, a fully fledged war.’ Prior to this he has downplayed the situation. The US yesterday agreed to move 3K troops to Romania (a NATO country) to be ready for any future missions. This is getting closer to a precipice, with war more likely.
CONCLUSION:
The growing concern about an invasion/annexation of eastern Ukraine continues to spike crude oil prices higher. WTI rose to around US$90/b in recent days. WTI today is at US$87.60/b.
If there is no invasion or if a ‘minor incursion’ does not set up sanctions against Russian energy exports as the winter weather subsides, the price of WTI crude could retreat towards US$62-65/b fairly quickly. More downside is likely when the US and China economies stagnate and/or fall into recession. If the Russian invasion is for all of Ukraine (not very likely in our view), then the price of crude could spike up over US$100/b. How long it stays up is unknown but the repercussions would likely increase the potential for a severe world-wide recession. A severe recession would kill demand for energy and prices would collapse as they did in 2008-2009 and 2020.
Energy Stock Market: The S&P/TSX Energy Index currently trades at 199 (up 9 points over the last week as the war event window closes in).
I will be presenting my annual keynote energy presentation at 7:15PM PT Friday. The two day World Outlook Financial Conference (WOFC) is on February 4 & 5. Michael Campbell will be doing a Q & A with me on Friday evening as part of this virtual event. Access passes are still available. Please go to their website to get your tickets to this excellent and informative event.
Our next quarterly SER webinar will be held on Thursday February 24th at 7PM MT. If you want to join/register for this event you will need to become a subscriber to our full product before the event. Go to https://bit.ly/34iKcRt to subscribe.
Please feel free to forward our weekly ‘Eye on Energy’ to friends and colleagues. We always welcome new subscribers to our complimentary energy overview newsletter.
Reassessing The Fed = Market Mayhem
On January 15, the lede for my TD Notes was: “Peak Fed Hawkish – Or Minsky Moment?” Since then, particularly since Wednesday’s Fed meeting, price action would tell you that we’ve had a “Minsky Moment” – that the Fed is a LONG way from Peak Hawkish.
I’m taking the other side of that trade – buying the S+P, which tumbled on Fed tightening fears.
On January 15, I wrote: Peak Fed hawkish means the markets have WAY over-anticipated the consequences of Fed tightening (the Fed will stand down) – Minsky moment means there has been a sea-change at the Fed, and you ain’t seen nothing yet! Both opinions have eloquent spokesmen; recent short-term price action has been choppy as markets decide which view will prevail.
It depends on your time frame
I can get on board the “Minsky” train in a long-term time frame (more than a year). After all, current interest rate levels are about as low as they’ve ever been in human history, (risk) assets prices have soared the past two decades and have been absolutely smoking hot since the Covid panic in March 2020. We’re “due” for a “Minsky” inflection point.
But – on a short-term time frame (the next month or two), I’m betting that markets have WAY over-anticipated the consequences of severe tightening from the Fed.
Equity markets
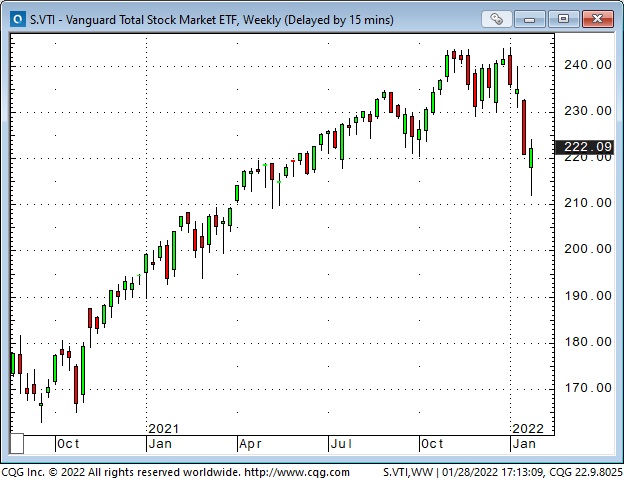
Last week, the Dow plunged nearly 2,000 points and closed right on its lows – setting up a nasty 1,400 point free-fall from Sunday’s overnight highs to early Monday’s 7-month lows. From the January 5th All-Time High the Dow fell ~3,800 points (10.5%) in only 13 trading days.
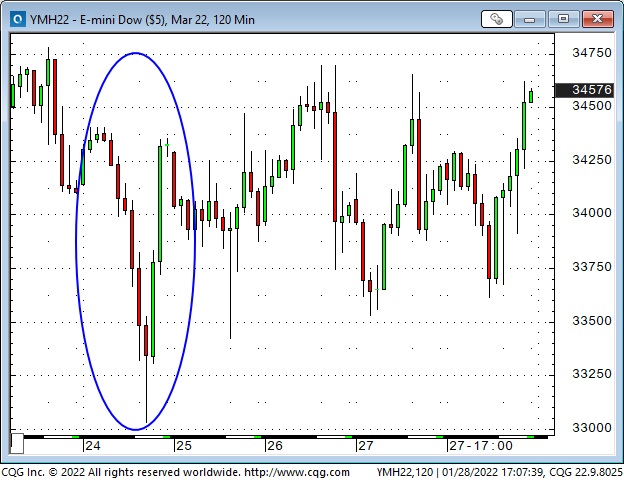
Mid-day Monday, the Dow pivoted and rallied ~1,400 points to close GREEN on the day!
Wicked hour-to-hour rollercoaster price action continued throughout the week – every day this week, Dow futures had a high/low price range of > 1,000 points! (I remember in the 1970s when the Dow was 1,000!)
I will tell you that trading equity markets this week was hard to do when the high/low range on a 30-minute bar was WAY more than it used to be for an entire BIG day!
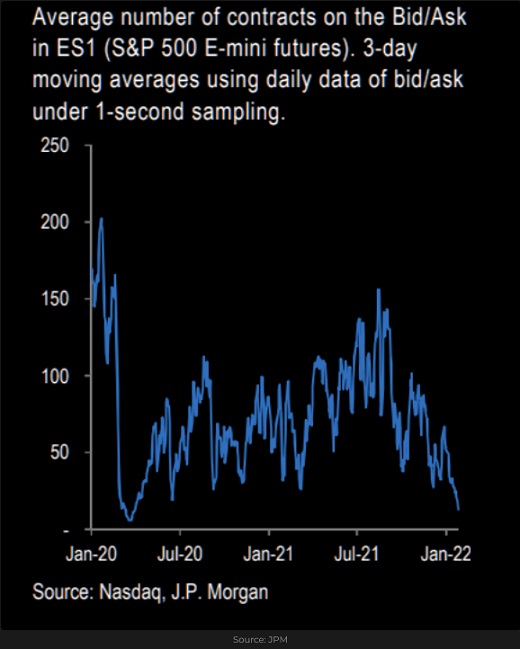
Liquidity and depth-of-market were thin, but volume was huge. Option vols were the highest we’ve seen in a year, and (you just knew) some option dealers were getting killed buying highs and selling lows as they tried to manage gamma risk.
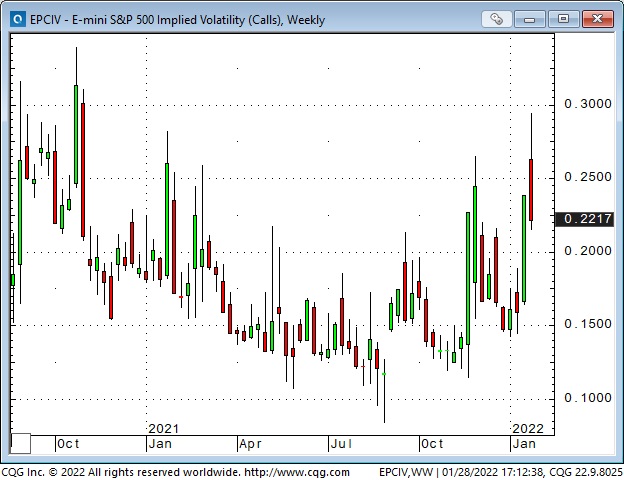
It was a violent, nasty week but all of the major indices (save the Trannies and the Russell small-cap) closed green on the week. Vols closed down on the week.
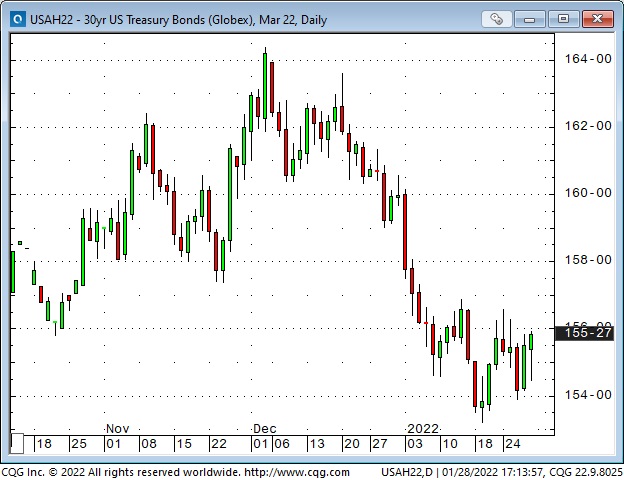
Interest rates
Yields across the whole Treasury curve jumped during Powell’s press conference – the takeaway was that the Fed would be more aggressive in its fight against inflation than previously thought. By the end of the week, the yield curve was flatter: short rates had jumped to their highest levels in two years while bond yields were steady/lower (if the Fed was going to be tough on inflation by cranking up short rates – that would be good for bonds.)

Higher American interest rates = Higher US Dollar
The US Dollar index closed the week at an 18-month high – rising against nearly all currencies.
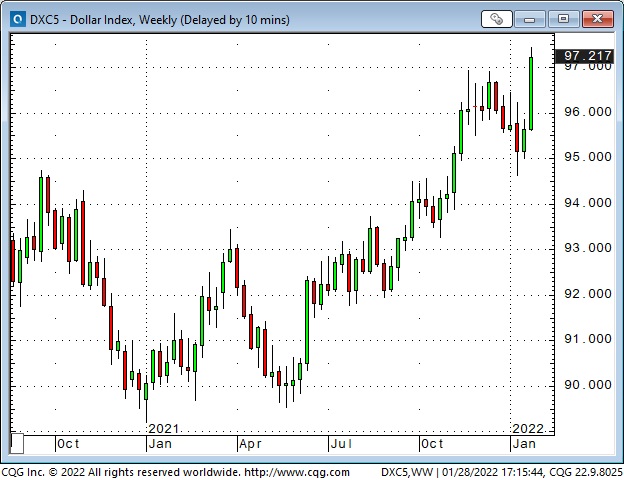
The Euro dropped to an 18-month low. It had popped out of a 6-week trading range in mid-January (a false breakout), and that added fuel to the recent decline as new buyers covered their trades.
The Euro is also a “victim” of the widening policy differences between the Fed and the ECB.
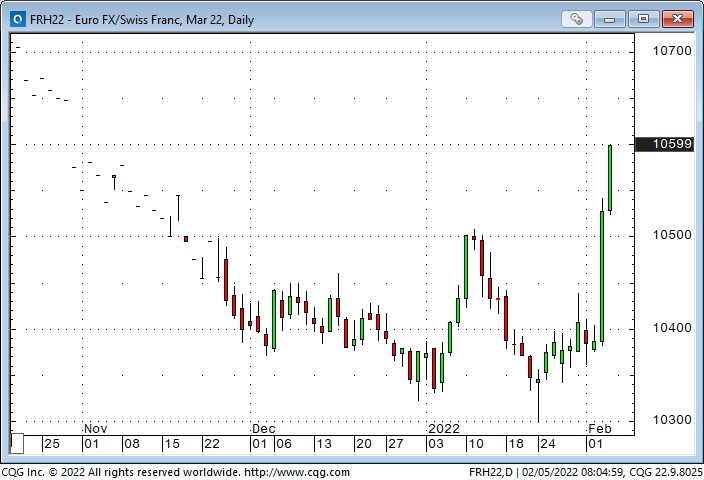
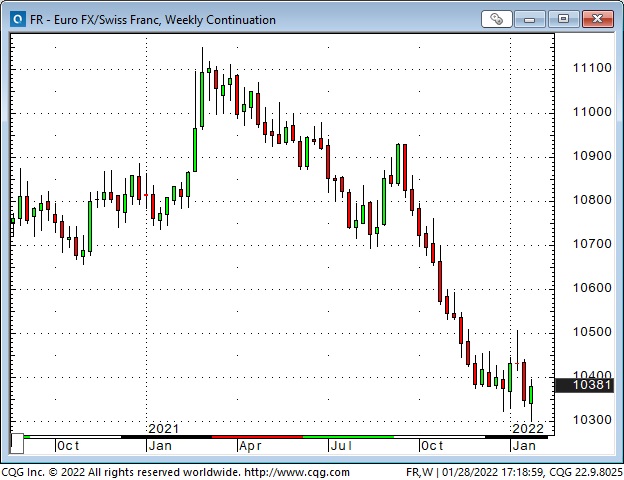
European geopolitical worries (Ukraine) also weakened the Euro against the USD and the Swiss Franc. The Euro fell to a 7-year low (essentially, an All-Time low) against Suisse this week.
The Canadian Dollar dropped ~2 cents from its January highs as the USD soared and stocks markets fell – despite solid gains in WTI and the commodity indices.
Gold hit a 2-month high at $1854 on Tuesday but fell ~$75 to Friday’s low. Higher interest rates and a higher USD are kryptonite for gold.
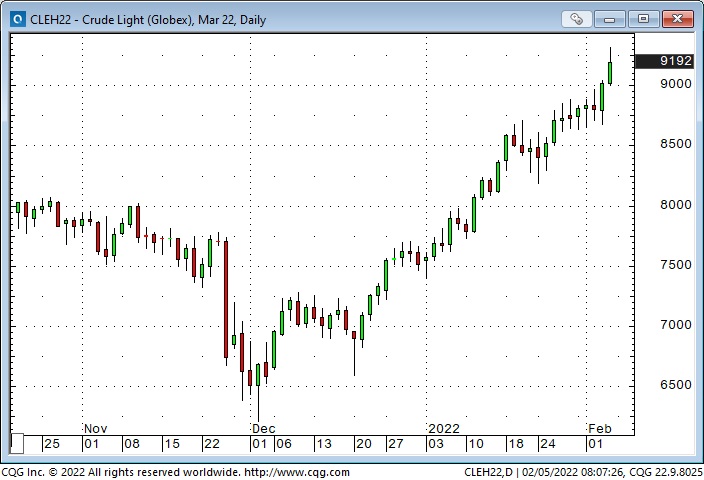
WTI crude oil hit a new 7-year high ~$89
WTI continued its relentless march higher, and backwardation across the forward curve continued to steepen – one year forward WTI is now ~ $11.50 cheaper than the front month.
My short term trading
My P+L was down ~0.75% last week as I tried, unsuccessfully, to pick a bottom in the steep stock market decline. I kept doing that this week and my P+L was down another ~0.5% by Friday morning.
I bought the S+P Friday afternoon, and my unrealized gain on that trade is ~0.5%. The strong Friday close encouraged me to stay long into the weekend.
It was not a fun week for me. I was nicely ahead on a couple of trades, but a swift, violent swing lower knocked me out. I was trading small size, given the magnitude of the intra-day swings, and I only made ~6 trades all week, but I felt like I was playing ice hockey in my boots while all the other guys were wearing skates!
On my radar
My friend, Kevin Muir, had a terrific line in his blog this week: “Opportunities arise out of Wall Street’s shift in sentiment.” I sent him a note complimenting him on that insight – telling him that was the basis of most of my trading – and asking permission to quote him.
I’ve written previously about “variant perception,” a sophisticated term for looking at markets with a contrarian’s eye. (I’ve quoted Michael Steinhardt as saying, “There is no easier way to make money in the market than to have (and to have the confidence to implement) the correct Variant Perception.”)
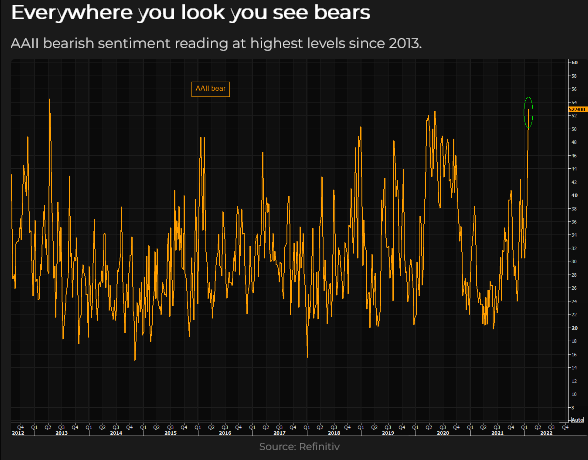
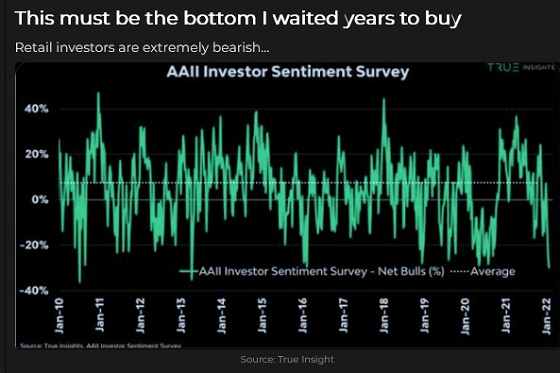
My current contrarian idea is that the market’s extremely bearish sentiment is WAY overdone (in the short term). I will be watching for support for my idea – and evidence that I am wrong.
I think the “fear” is that the Fed is WAY behind the curve and will have to be more aggressive – which sets up the possibility of “tightening into a recession” and/or a “deleveraging or volatility event” in the markets. That may be what happens, but the recent correction in the major indices masks a washout in the more speculative side of the market (since November) and this week’s price action looks like an inflection point to me.
Another “fear” is that the Fed can’t fight Main Street inflation without causing deflation on Wall Street. I understand. I’ve previously written that the Democrats, sensing a disaster in the upcoming midterms, may be willing to throw Wall Street under the bus if that’s what it takes to kill the inflation that is worrying voters.
Next week, I’ll be watching for signs that “fear” caused some mispricing opportunities in the currency, equity and interest rate markets.
Thoughts on trading
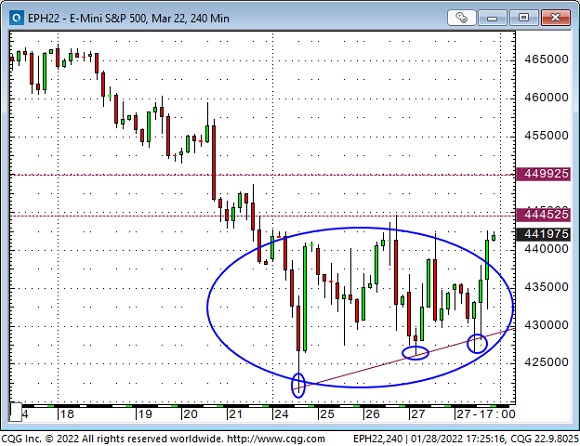
I’ve described my contrarian idea, but that doesn’t mean that I will start selling US Dollars and buying stocks and Eurodollar futures on Monday morning. I’ve got an idea, but I will be looking for price action setups that “go along” with my idea. For instance, if the S+P trades above 4450 and 4500 on this chart, that might be a “sign” that an important bottom was made this week, and I could buy more.
Quotes from the notebook
“What I’m really looking for is a consensus that the market is not confirming.” Bruce Kovner The Market Wizards, 1989
My comment: This is another way of saying “Variant Perception.” For instance, I think Bruce was saying (in effect) that if everybody is bearish, but the price action looks bullish – he’s buying.
“Focus on the process, not the outcome.” Bob Rotella, The Unstoppable Golfer
My comment: A good friend gave me this book years ago, and I’ve reread it a couple of times. Bob coached some of the best golfers in the world – not by telling them how to swing a club, but rather by helping them manage the mental aspect of the game. Traders will benefit more from managing their trading process (and mental attitudes) than looking for trade recommendations.
“Successful trading is about eliminating distractions and focusing on discipline. You have to want to get better – you have to look in the mirror.”
Peter Borish RTV 2018
My comment: Peter worked with Paul Tudor Jones years ago and became a trading coach. I agree 100% with what he says here. It’s not about being the best trader (or golfer or whatever); it’s about being the best you can be – and wanting to get better – and having the discipline to keep going when you want to quit.
The Barney report
“The Barns,” as we sometimes call him, keeps growing, and he’s getting smarter all the time. We take him for walks on off-leash trails, and he’s terrific about staying with us. When we throw one of his toys, he fetches it, brings it back and (reluctantly) “leaves it!” A breakthrough!

Please Do Me A Favour
If you like reading the Trading Desk Notes, please forward a copy or a link to a friend. Also, I genuinely welcome your comments, and please let me know if you would like to see something new in the TD Notes.
Victor Adair retired from the Canadian brokerage business in 2020 after 44 years and is no longer licensed to provide investment advice. Nothing on this website is investment advice for anyone about anything.
-
I know Mike is a very solid investor and respect his opinions very much. So if he says pay attention to this or that - I will.
~ Dale G.
-
I've started managing my own investments so view Michael's site as a one-stop shop from which to get information and perspectives.
~ Dave E.
-
Michael offers easy reading, honest, common sense information that anyone can use in a practical manner.
~ der_al.
-
A sane voice in a scrambled investment world.
~ Ed R.
Inside Edge Pro Contributors

Greg Weldon

Josef Schachter

Tyler Bollhorn

Ryan Irvine

Paul Beattie

Martin Straith

Patrick Ceresna

Mark Leibovit

James Thorne

Victor Adair