
Op/Ed
Each week Josef Schachter gives you his insights into global events, price forecasts and the fundamentals of the energy sector. Josef offers a twice monthly Black Gold newsletter covering the general energy market and 30 energy, energy service and pipeline & infrastructure companies with regular updates. We also hold quarterly webinars and provide Action BUY and SELL Alerts for paid subscribers. Learn more.
EIA Weekly Oil Data: Overall, the EIA data of Wednesday January 26th were moderately bearish for energy prices as US Commercial Crude Stocks rose 2.4Mb (a decline of 728Kb was expected). The most bearish metrics were that Motor Gasoline Inventories rose by 1.3Mb and Distillate Fuel Oil Inventories rose by 2.3Mb. Inventories would have risen even more if not for net imports falling 695Kb/d, or by 4.865Mb on the week. Refinery Utilization was at 87.7%, down 0.4% from the prior weeks 88.1%. Two years ago, just prior to the pandemic hitting, the rate was 87.2%. US Crude Production fell 100Kb/d to 11.6Mb last week which is down 200Kb/d from its 11.8Mb/d 2021 peak.
Total Demand rose 502Kb/d to 22.417Mb/d (above the level in 2020 pre–pandemic) as Motor Gasoline and Distillate demand rose. Motor Gasoline demand rose by 281Kb/d to 8.505Mb/d (in late-January 2020 demand was 8.793Mb/d). Distillate Fuel demand rose 198Kb/d to 4.754Mb/d (in late-January 2020 demand was only 3.901Mb/d). Jet Fuel Consumption fell 235 Kb/d to 1.278Mb/d compared to 1.670Mb/d in mid-January 2020. This weakness was due to staffing shortages, flight cancellations and some airport challenges with the introduction of 5G technology that cut back flights. Cushing Crude Inventories fell 1.8Mb to 31.7Mb.
Overall we would rate this week’s data as modestly negative for energy prices but it is being overshadowed and ignored by energy bulls who are focused on Russia readying to invade Ukraine. The invasion, if it does occur, is likely to commence after week two of February when the land is firm enough for tanks and after the winter Olympics have started in Beijing. President Putin is expected to attend the opening ceremonies and is a friend of President Xi Jiping.
The cyberwarfare side has already started against Ukraine but the land war is a few weeks away. If Russia invades then severe economic sanctions are being contemplated by the US and some European/NATO countries against imports of oil and gas from Russia. This would put Europe in a tough situation with no easy replacement sources right as winter gets to its coldest. This is a two- edged sword and Germany and France appear to reject following President Biden in implementing this due to their countries’ interdependence with Russia. Diplomatic efforts continue while military responses are being upped by both Russia and supporters of Ukraine.
EIA Weekly Natural Gas Data: Weekly withdrawals are rising as the coldest weeks of winter are now here. Last week data showed a large withdrawal of 206 Bcf (the largest so far this winter), lowering storage to 2.810 Tcf. The biggest US draws were in the South Central (69 Bcf), the Midwest (65 Bcf) and the East (61 Bcf). The largest US draw ever occurred in early January of 2018 at 359 Bcf and the largest draw in 2021 occurred in mid-February with a draw of 338 Bcf.
The five-year average for last week was a withdrawal of 153 Bcf and in 2021 was 187 Bcf. Storage is now 1.2% above the five-year average, so the US is not facing a natural gas shortage as is seen in Europe and Asia. NYMEX today is US$3.23/mcf due to the expected colder weather trend for the upcoming week. AECO spot today is trading at $3.86/mcf. With all of February (the key winter month for natural gas demand) we are likely to see large price moves to the upside on very cold days. Spikes over $6/mcf could occur if multiple weekly withdrawals of over 200 Bcf are seen.
After winter is over natural gas prices should retreat and if the general stock market decline unfolds as we expect, a great buying window could develop at much lower levels for natural gas stocks in Q2/22.
Baker Hughes Rig Data: The data for the week ending January 21st showed the US rig count rose by three more rigs (up 13 rigs the prior week) to 604 rigs last week. Of the total working last week, 491 were drilling for oil and the rest were focused on natural gas activity. The overall US rig count is up 59% from 378 rigs working a year ago. The US oil rig count is up 70% from 289 rigs last year at this time. The natural gas rig count is up a more modest 28% from last year’s 88 rigs, now at 113 rigs.
Canada had a sharp increase of 21 rigs (up 50 rigs last week) as activity continued to recover from the holiday season to 212 rigs. Canadian activity is up 24% from 172 rigs last year. There were 13 more oil rigs working last week and the count is now 134 oil rigs working, up from 96 last year. There are 78 rigs working on natural gas projects now, up two rigs from 76 last year.
The overall increase in rig activity from a year ago in both the US and Canada should translate into rising liquids and natural gas volumes over the coming months. The data from many companies’ plans for 2022 support this rising production profile expectation. We expect to see US crude oil production reaching 12.0Mb/d in the coming months. Companies are taking advantage of attractive drilling and completion costs and want to lock up experienced rigs, frack units and their crews as staffing issues are getting tougher for the sector. We expect US production to reach 12.5Mb/d during 2H/22.
Conclusion:
Bearish pressure on crude prices:
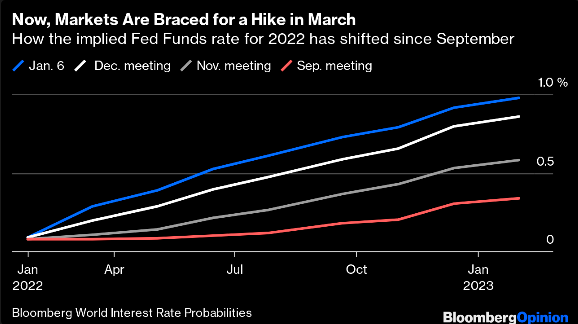
1. The Federal Reserve holds its press conference today after its official meeting is over and the market will be listening to the stance the Fed takes to fight inflation. Forecasters now expect four or five rate increases starting in March, with the first increase likely of 50BP. The responses by Chairman Powell to questions will get a lot of attention to see how hawkish he and the Fed have become to fight the severe inflation.
2. Omicron Covid-19 caseloads have not gone away and deaths are rising for the unvaccinated. Deaths in the US have reached 868K (up 14K over the last week) and worldwide 5.60M. The US faced a record 2,100 deaths during one day last week. China has tightened travel restrictions again, just before the start of the winter Olympics next week in Beijing, they may last for at least six months and will slow their economy down. China has also requested citizens not travel during the normally active travel period of the Lunar New Year holiday season due to the pandemic. This will lower transportation fuel consumption significantly.
3. Some European countries like Germany and France are not inclined to follow the US lead to aggressively sanction Russia if it invades eastern Ukraine. They have strong reciprocal economic interests with Russia. They may be willing to accede to Russia’s annexation of eastern Ukraine. An overall invasion to take over the whole country may be a different situation for them. Berlin has not sent any weapons to Ukraine compared to other countries. They have only sent medical support so far.
Bullish pressure on crude prices:
1. Russia provides over 20% of western Europe’s crude oil needs and around 40% of its natural gas needs. Any sanctions on these sales would not be easily met by other producers. This effectively is a two-edged sword. The US is sending over more cargoes on LNG and has asked Qator to do the same. Over time OPEC could send more oil to Europe while Russia could sell its sanctioned oil to China. The Biden administration believes there will be an invasion of eastern Ukraine and the US, UK and Canada have started to remove the families of the embassy and consulates from the country. Citizens of those countries have also been encouraged to leave the area. The US has put 8,500 US troops on heightened alert in the US that can be moved to NATO countries expeditiously.
2. OPEC only increased production in December by 166 Kb/d and not the authorized 400Kb/d. OPEC+ holds their next meeting on February 2nd. Many OPEC members (led by Oman) want to see US$100/b for Brent in 2H/22 and have held off raising production. Others cannot as they face infrastructure problems (Libya and NIgeria) or have not spent funds to increase capacity as they had projected.
3. The Iran nuclear negotiations are working to get sanctions removed on Iran so that they can sell their oil around the world and not just to China that rejects the sanctions.
4. Russia has threatened cyber attacks against the US if President Biden escalates pressure on Russia to unacceptable limits. Threatening to sanction President Putin is a joke as he has no assets in the US and has no desire to get a VIP tour of Disneyland. President Biden’s miscues are getting nuttier. Russia has already warned that any increase in military personnel or offensive weaponry in former USSR countries that are now members of NATO would see Russia move ‘strategic nuclear’ weapons to Cuba, Nicaraugua and Venezuela. A nastier tit for tat. This could turn out worse than the 1962 Cuban missile crisis.
5. Speculators and hedge funds are betting on over US$100/b by the summer and over US$120/b by the end of the year. Futures buyers have added >5000 contracts or over 500Mb of long positions. In addition, options buyers have added increasing amounts of ‘out-of-the-money contracts. The highest price being bought is US$200 calls for December 2022 which we think is outrageously high.
CONCLUSION:
The growing concern about an invasion/annexation of eastern Ukraine continues to spike crude oil prices higher. WTI rose to US$87.89/b today, a new high for the year and a buck higher than last week as the war drums indicated that the invasion is imminent. The poker game is on and Putin does not appear to be bluffing. President Biden is coming off as the Neville Chamberlain of this confrontation.
If there is no invasion or if a ‘minor incursion’ does not set up sanctions against Russian energy exports as the winter weather subsides, the price of WTI crude could retreat towards US$62-65/b fairly quickly. More downside is likely when the US and China economies stagnate and/or fall into recession. If the Russian invasion is for all of Ukraine (not very likely in our view), then the price of crude could spike up over US$100/b. How long it stays up is unknown but the repercussions would likely increase the potential for a severe world-wide recession. A severe recession would kill demand for energy and prices would collapse as they did in 2008-2009 and 2020.
Energy Stock Market: The S&P/TSX Energy Index currently trades at 190 (down four points from last week). The Index fell last week by 23 points to 173 before reversing on heightened invasion worries. Last week’s 11% decline was a reaction to the general stock market weakness as the MEME stocks and the FAANGs got hit. Overall the Dow Jones Industrials fell by 10% to a low of 33,200 (now 34,640) while the NASDAQ fell 19% from its high to 13,095 two days ago. It has rebounded to 13,836 today as the market awaits the Fed decision and press conference. This meeting will be critical for the markets go forward movement.
Our January SER Report will come out tomorrow Thursday January 27th and will include our concerns about the general market (MEME stocks have been massacred and the FAANGs are topping out). Many of the underpinnings of the general market are weakening and we have seen a bumpier ride in recent days. We also include a section on the Russian/Ukraine confrontation and why an invasion of eastern Ukraine could spark a bigger decline in the stock markets. In addition we will have an update of Insider Trading activity of the companies on our Coverage List.
We are planning to return to Mount Royal University (MRU) (after a two year pandemic halt) for our ‘Catch the Energy’ conference on October 22, 2022. We will be discussing the protocols on attendance, food service, masking and QR code verification with MRU in Q1/22. We look forward to adding more companies and focus the event on attendees having safe and maximum, face to face time with company management. More on this to come. Please save the date in your calendars.
I will be presenting my regular keynote annual energy macro presentation at 7:15PM PT next Friday. The two day World Outlook Financial Conference (WOFC) is on February 4 & 5. Michael Campbell will be doing a Q & A with me on Friday evening as part of this virtual event. Access passes are still available. Please go to their website to get your tickets to this excellent and informative event.
Our next quarterly webinar will be held on Thursday February 24th at 7PM MT.
If you would like to access our January SER Report or any of our previous reports or the webinar archives, go to https://bit.ly/34iKcRt to subscribe.
Please feel free to forward our weekly ‘Eye on Energy’ to friends and colleagues. We always welcome new subscribers to our complimentary macro energy newsletter.
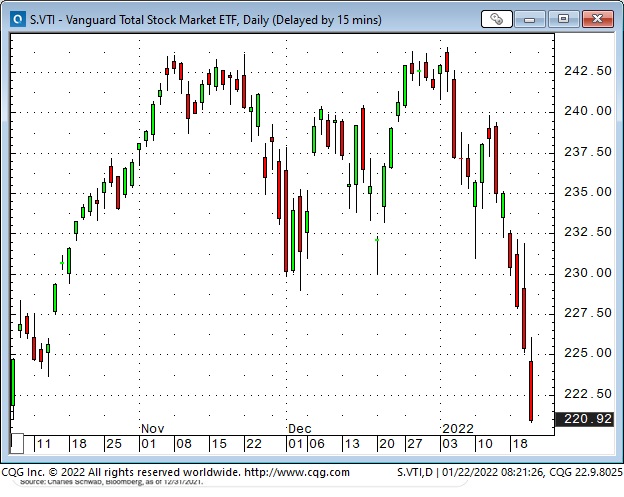
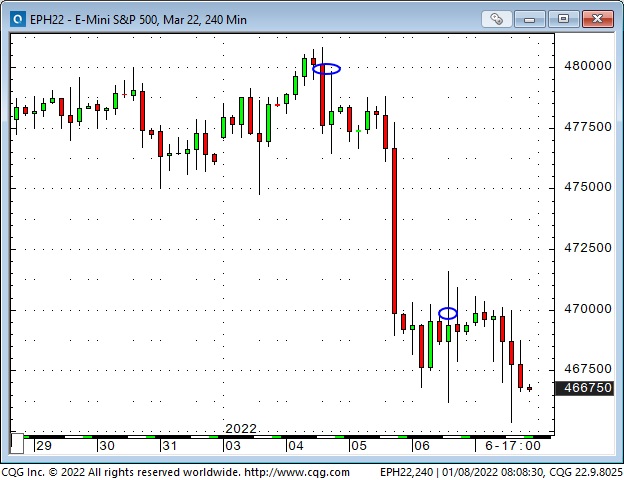
This was the worst week for the leading stock indices (including the TSE) since the February/March 2020 meltdown
Market sentiment is extremely bearish, and markets are extremely oversold. Significant “technical support” levels have been broken. With the markets closing on their lows, expect further selling pressure early next week.
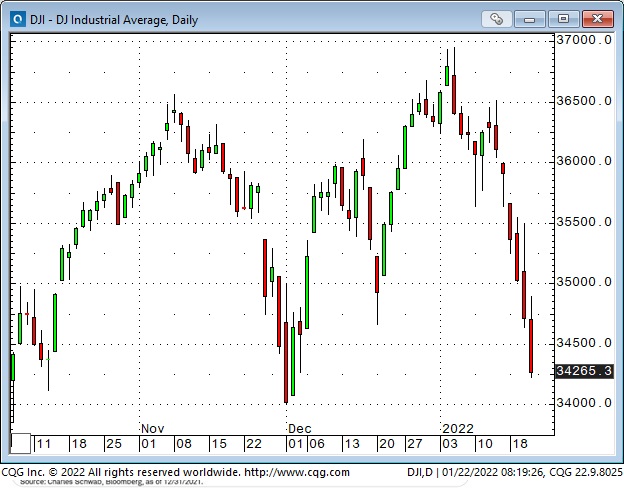
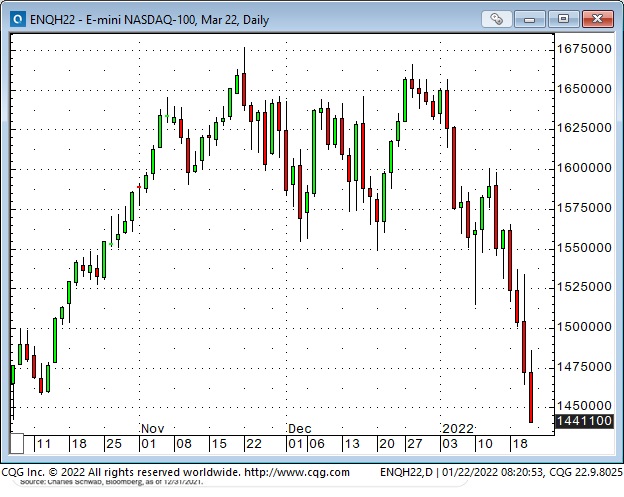
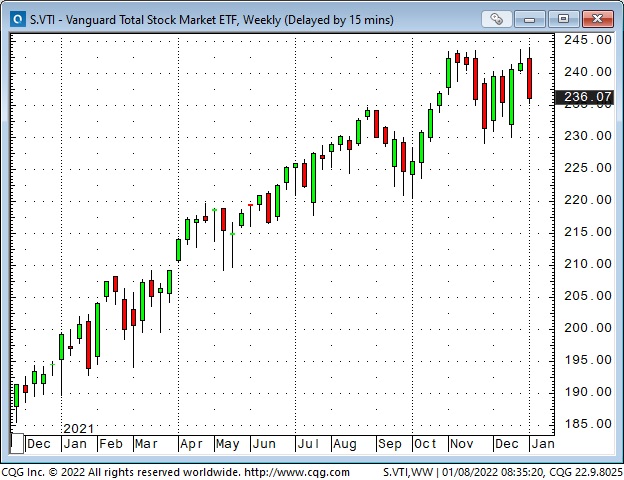
The S+P is down ~9% from its January 4 ATH; the Nasdaq 100 is down ~14% from its November 22 ATH. The Vanguard Total Stock Market ETF is down ~10% from its January 4 ATH – its lowest close in six months.
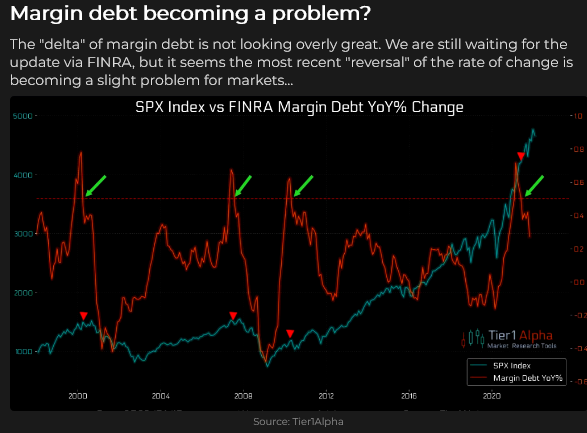
The bear case: For the past several months, the indices have trended higher on the back of Big Cap stocks while breadth deteriorated. The sea-change in Fed policies in late 2021 marks the top of a 12-year bull market that had gone parabolic on easy money, TINA, FOMO, corporate buybacks and Passive inflows. The Fed will be tightening into a slowdown, unable to cool inflation and stagflation will result.
The bull case: The pandemic policies that have crippled the economy will soon be over (note developments in England and Ireland), and the re-opening economy will be robust. Interest rates rising 1 – 2% will not be a headwind, and inflation has peaked. A 5 -10% correction in the major indices is healthy – it flushes the crap out of the system. The indices will rebound as capital “rotates” to stocks that prosper in the new economic environment.
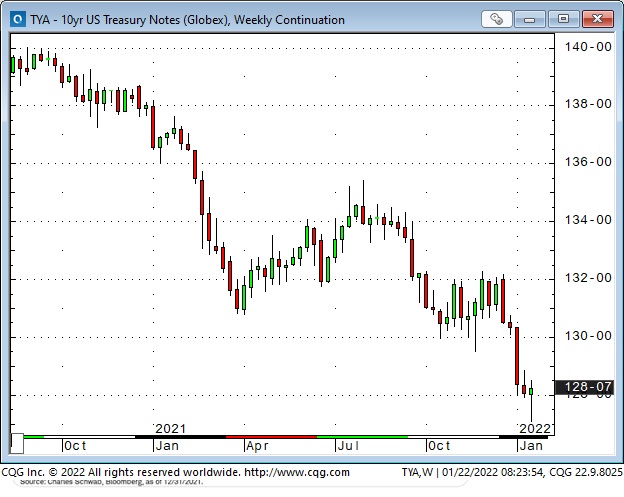
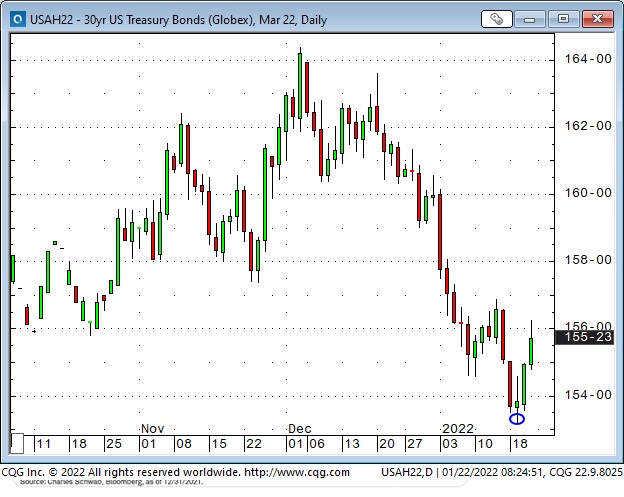
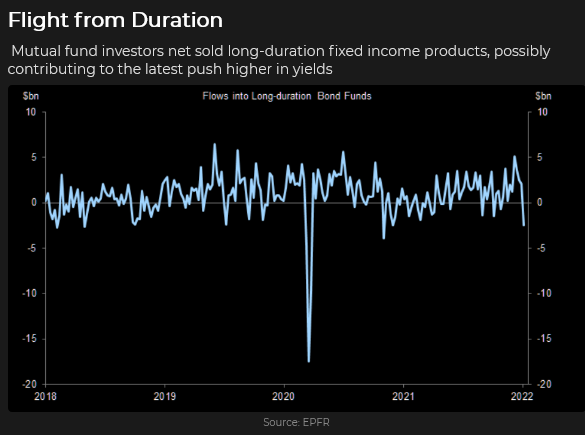
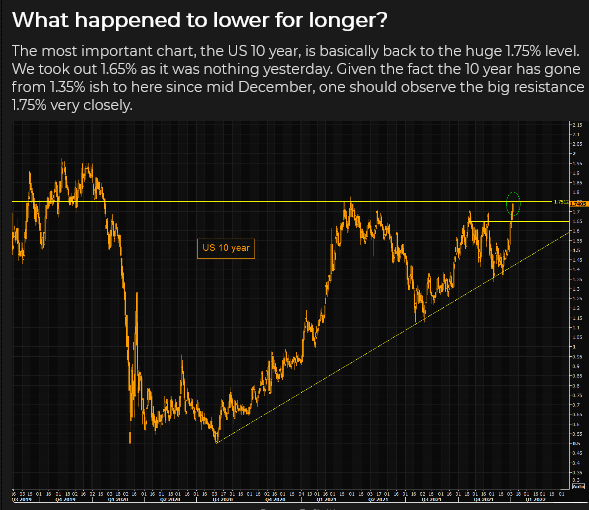
10-year US Treasury yields hit 1.9% this week – the highest since July 2019
Bond yields surged higher over the last four weeks as the Fed and other Central Banks (not the ECB, BOJ or the PBOC) signalled they will reduce stimulus and raise interest rates. The UST 10-year yield was 1.35% a month ago and hit a high of 1.9% this week.
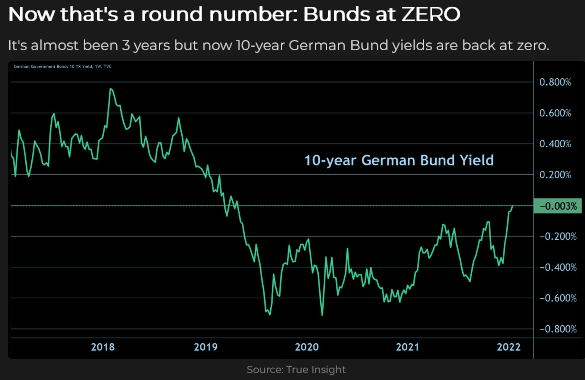
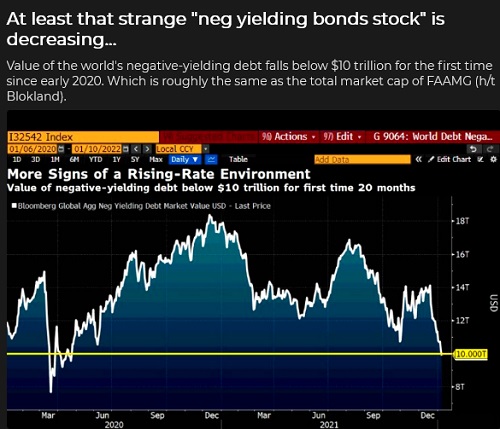
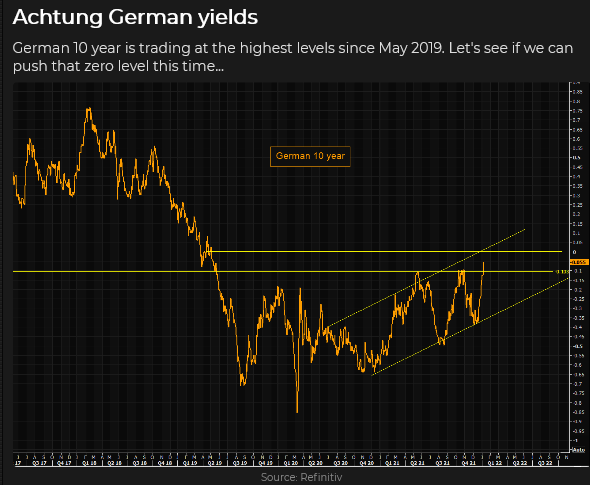
The German 10-year bund yield traded above zero this week for the first time in 3 years. The global stock of negative-yielding debt is down ~50% from ATH.
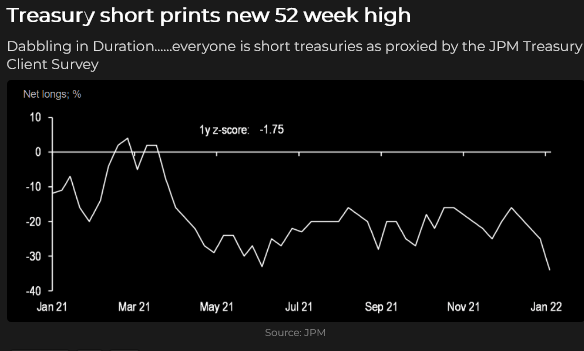
Most of the recent rise in UST yields happened this year. The rate of change accelerated as people adjusted positions – selling begot more selling – amid talk that the Fed (which had stayed too easy for too long) would have to get WAY more aggressive to contain inflation. (Dr. Doom, Henry Kaufman: “I don’t think this Federal Reserve and this leadership has the stamina to act decisively. They’ll act incrementally. In order to turn the market around to a more non-inflationary attitude, you have to shock the market. You can’t raise interest rates bit-by-bit.”)
The entire Treasury curve caught a “haven” bid Wednesday through Friday as the stock market fell (and following an aggressively bid 20-year auction on Wednesday.)
Two weeks ago, I wrote that Democrats, looking ahead to the mid-terms, might push the Fed to kill inflation at the expense of a falling stock market, as the majority of voters are hurt more by rising inflation than by falling stock markets. This week, Biden “supported” the Fed’s move to tackle inflation. Biden will be appointing new people to the Fed this year – perhaps trying to “reshape” the Fed like Trump “reshaped” the Supreme Court.
The Big Question: Will the Fed be able to cool inflation? What if they try but fail?
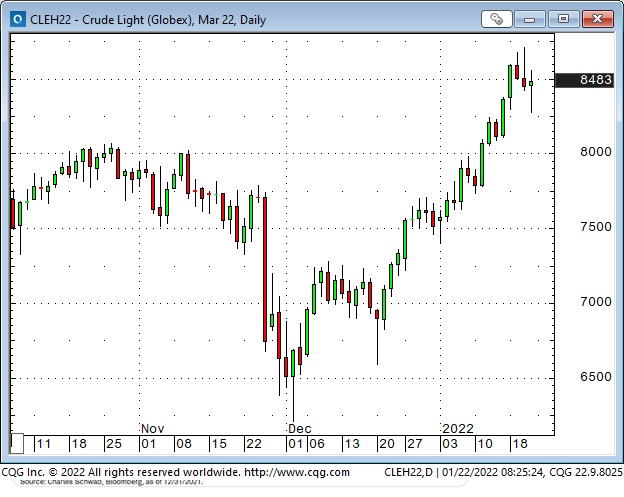
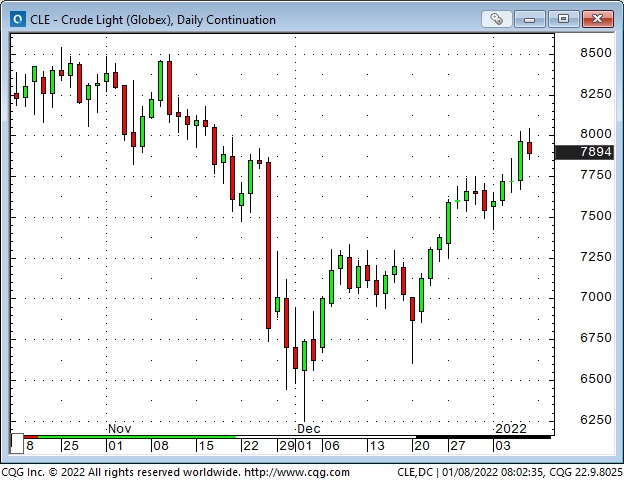
WTI crude oil traded above $87 this week – a new 7-year high
WTI rallied ~40% from early December lows in anticipation of a re-opening global economy demanding more oil at a time when inventories, and additional production capacity, are low – supply shocks (geopolitical tensions) could cause price spikes.
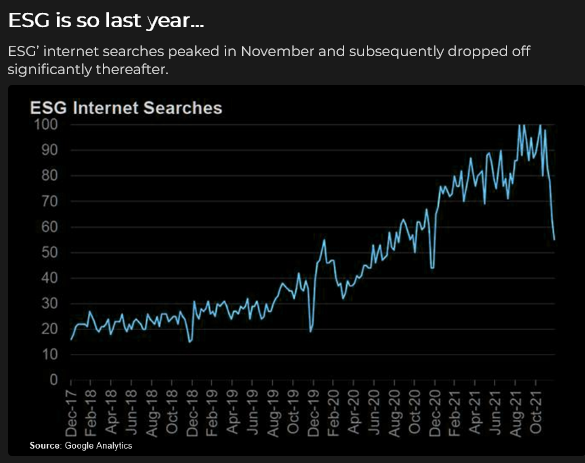
It is painfully ironic to see the US government fighting inflation and fossil fuel production simultaneously. (don’t they understand that higher energy prices = higher inflation?)
ESG fossil fuel policies that limit funding for the development of new supplies will help drive FF prices higher. In February, the re-invigorated American shale oil industry expects a new record high production in the Permian basin of 5 MBD. (The best cure for high prices is that high prices unleash ingenuity!)
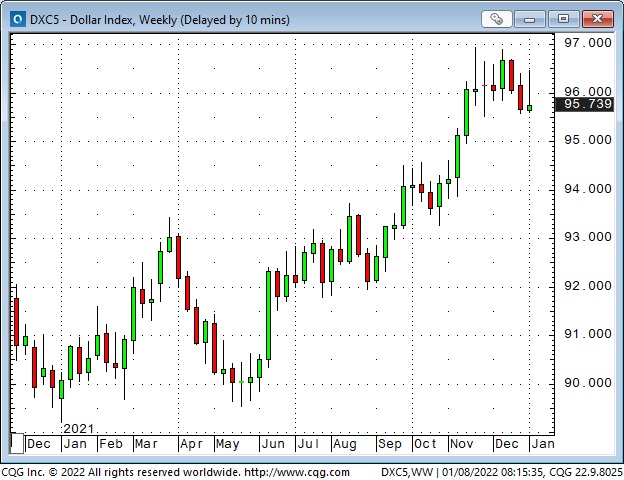
The US Dollar is NOT getting a “haven” bid while stock markets tumble
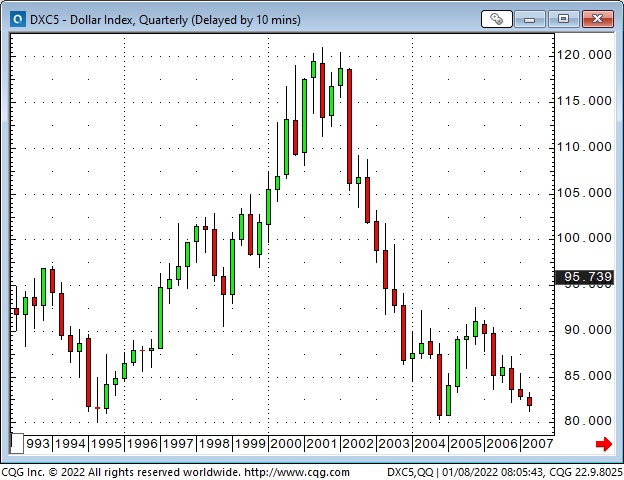
The USD initially weakened as stock markets plunged during the Covid panic in February 2020 – but then soared ~8% (to a 3-year high) in two weeks once capital realized the scope of the problem and fled to the USD for safety. (By July 2020 the US Dollar Index was making new lows for the year.)
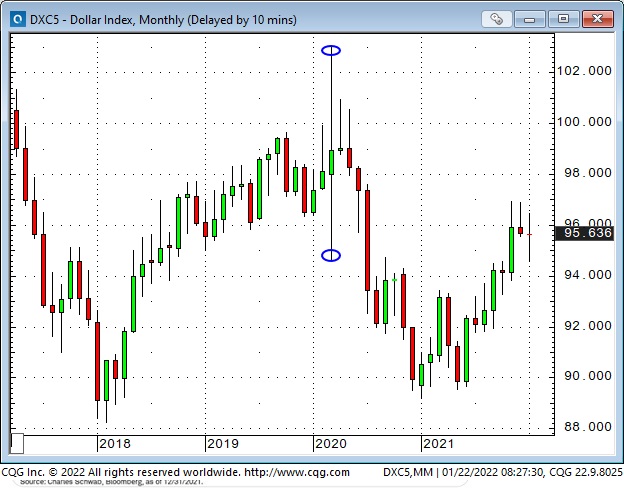
The USDX rallied ~8% from May to December 2021 (it registered its highest weekly close in 18 months in December) but (ironically?) turned lower in December once the Fed turned hawkish.
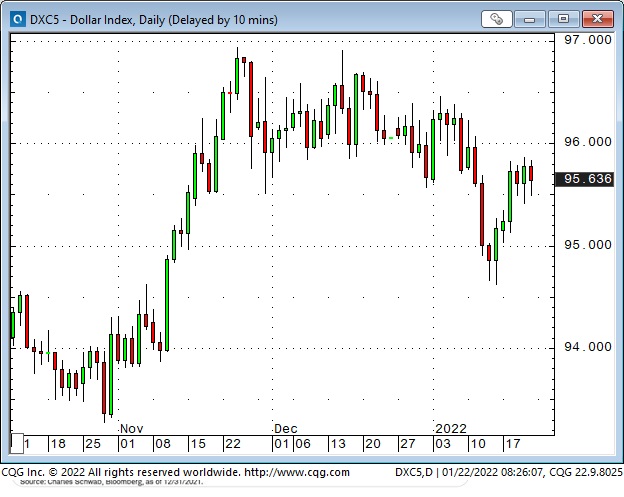
I think one of the reasons the USD has been relatively strong (in the face of continuing massive trade deficits) is that capital “came to America” to participate in the world’s most robust stock market. Perhaps that capital is now in the process of saying, “Adios Amigo, it was a great run while it lasted,” and is going home. Perhaps some American capital has also been “rotating” out of domestic markets and is looking for opportunities outside the USA. If so, that will pressure the US Dollar.
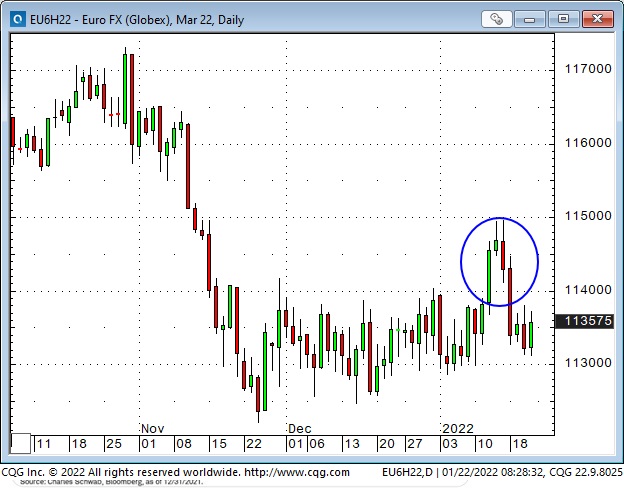
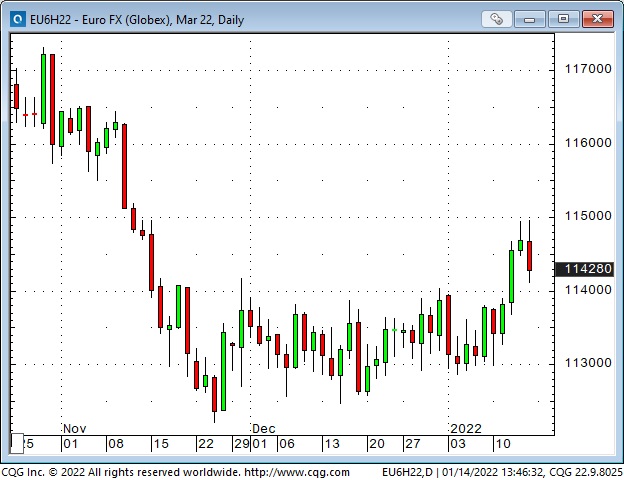
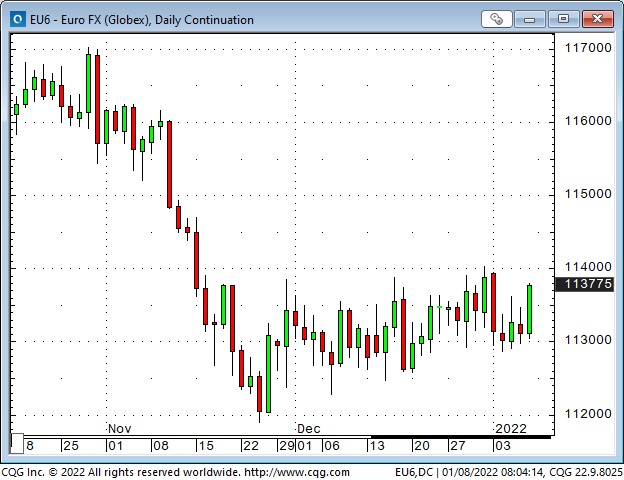
The Euro looked like it was breaking out of a narrow sideways range two weeks ago but has fallen back into the range. This week, Christine Lagarde, head of the ECB, reportedly said that the ECB “has every reason not to act as quickly or as ruthlessly as the Fed.” She expects European inflation to decline and doesn’t want to stunt economic growth with tighter ECB policies. She sees rising European bond yields as a sign of economic recovery, not a response to rising inflation. No wonder the Euro weakened (which might have been her intention.)
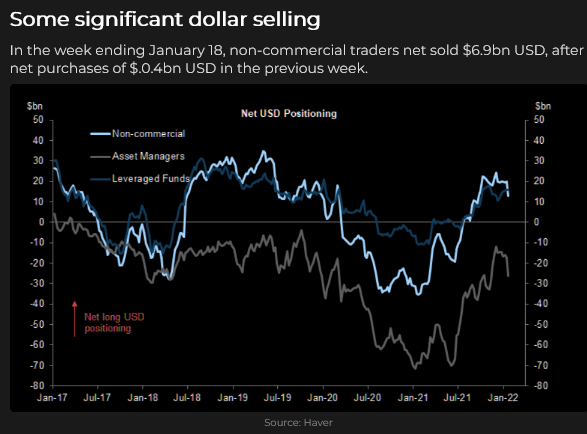
The Commitment of Traders report, as of January 14, shows that net speculative long positioning in the Euro increased by $2.6B on the rally to 2-month highs.
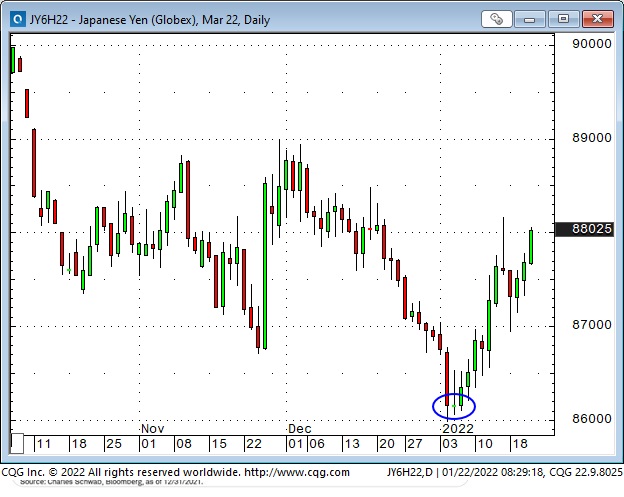
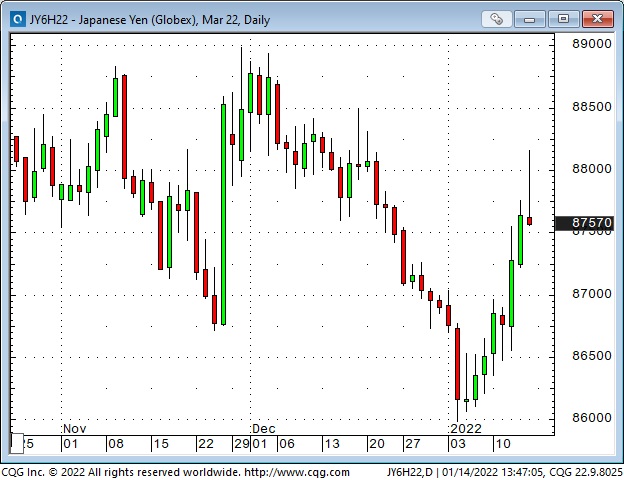
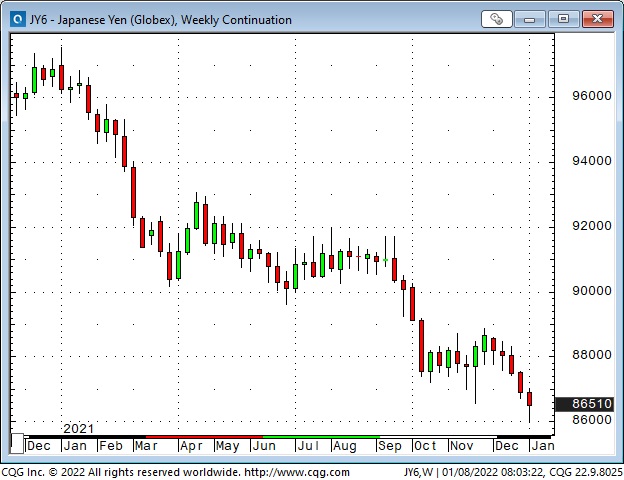
The Yen: The CoT reports that specs remain net short ~$9B of the Yen – which has rallied ~2.5% (from the 5-year lows hit last week) as stock markets tumbled.
The Canadian Dollar has tracked the rally in crude oil very closely for the past month while ignoring (until Friday) stock market weakness. (I’ve thought of the CAD as “the poor man’s WTI.”)
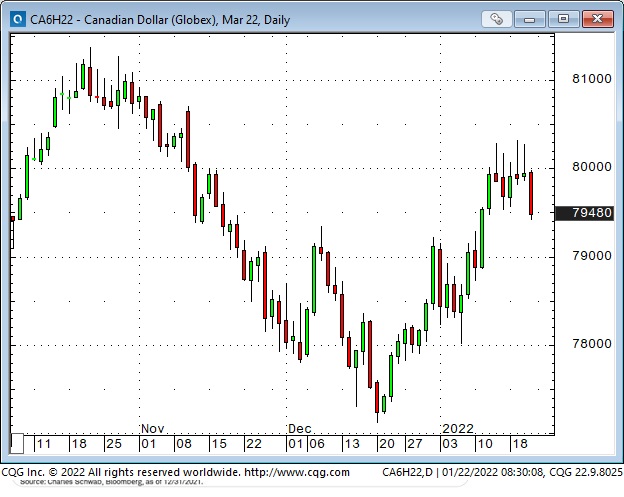
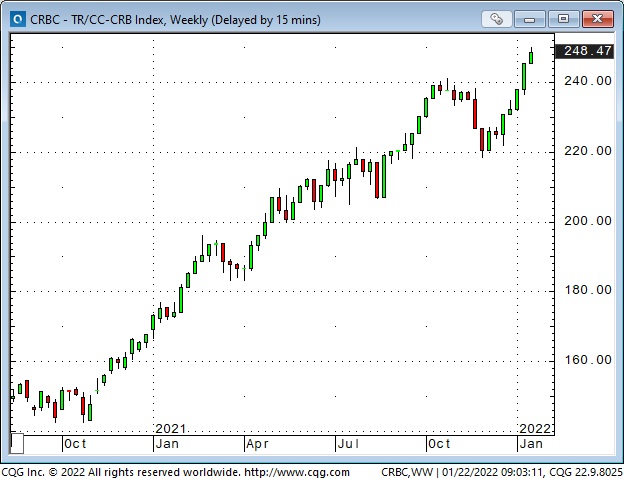
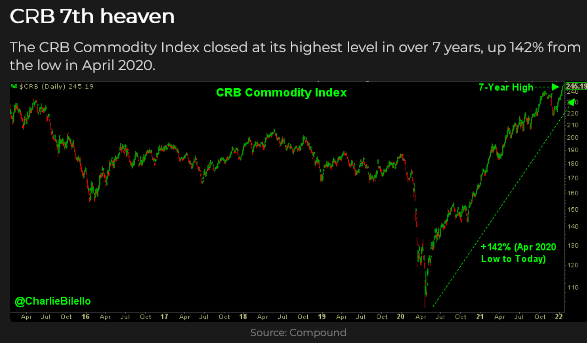
On a 20-year time frame, the correlation between commodity indices and the CAD has been solid. This week commodity indices, pulled higher by crude oil, hit fresh 7-year highs.
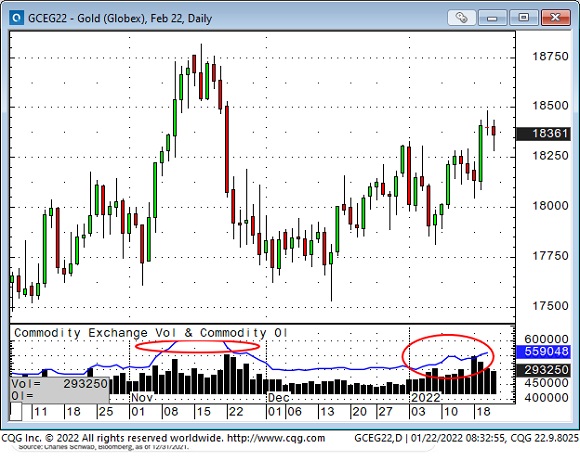
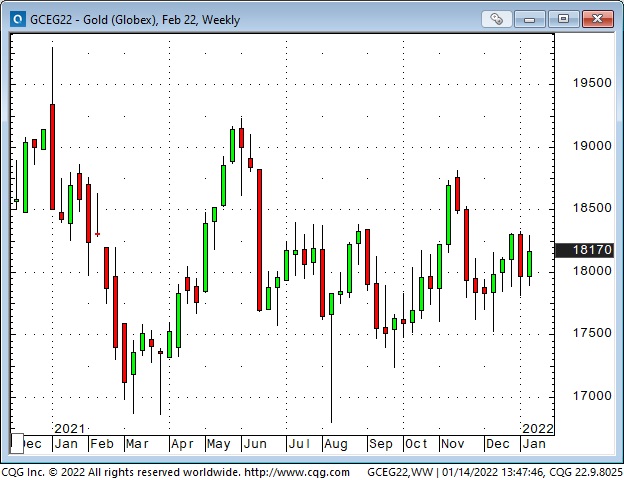
Gold and (especially) silver rallied the past two weeks – open interest has been creeping higher. Rising real yields have been negative for gold, and if the stock market continues to weaken, gold may be sold for liquidity – or it might catch a “fear” bid. If capital flows away from the USA and the USD weakens, gold should rally.
My Short Term Trading
This was NOT a good week for me. I had gone flat into the 3-day weekend and was slow getting “back to work.” I wanted to get short the stock market, but the overnight futures opened sharply lower Monday afternoon, and I decided to wait for the Tuesday day session. The market continued to fall, and I did NOT want to “chase” the market by selling into a potential hole.
For the rest of the week, I looked for buying opportunities. I found six different setups (in the S+P and the CAD), and every one of them worked initially, but in terms of closed-out trades, only one made money.
I was trading small size, with tight stops, and when the market moved in my favour, I raised my stops, but my net P+L on the week was a loss of ~0.75%.
The irony of losing money while the stock market tumbled was a bit hard to take, given that in my January 1st Trading Desk Notes, I had written, “I think we will see a severe correction sometime within the next few months. It could start as early as next week.” An additional irony was that one of my New Years Resolutions was to try to stay with winning trades longer!
I’ve had some success the past several weeks catching short-term swings, and I guess I thought that would continue. Not this week. Missing a good trade often feels “worse” than losing money on a trade.
I’m flat at the end of the week, not exactly nursing my wounds, but I’ve lived to play another day, and, as a dear old long-time friend likes to say, “There’s a rumour going around that the markets will be open again next week!”
Thoughts On Trading
Harley Bassman, the Convexity Maven, likes to say that the tails of the classic Bell Curve of option prices are cheaper than they should be. In layman’s language, that means that the “100-year flood” actually occurs much more frequently than once every 100 years.
In the “Quotes” section of my January 1, 2022 Notes, I quoted Michael Steinhardt as saying, “There is no easier way to make money in the market than to have (and to have the confidence to implement) the correct Variant Perception.”
Let’s merge those two ideas. If you have a “Variant Perception” about a market, consider buying “cheaply priced” long-dated, out-of-the-money options. If your perception is correct, you will be handsomely rewarded. The cost-benefit analysis is fantastic! (Think of Michael Burry in The Big Short.)
Harley uses to term “convexity” to describe what happens to your long option position when the market moves in your favour. The rate of change in the option’s delta (the gamma) accelerates, and you make money at an increasingly faster rate of speed (as long as theta – the clock – isn’t eating you alive!)
Harley likes to buy (rather than sell) long-dated options because that allows him to benefit from the magic of convexity – if he’s right on his call.
Harris Kupperman (Kuppy) is a very successful hedge fund manager who writes about Adventures in Capitalism. He is very bullish on crude oil as a long-term trade. He likes to point out that WTI is in steep backwardation; for instance, one year forward WTI on the NYMEX is ~$10 BBL cheaper than the front month, making the back month futures a bargain – from his perspective.
So, to put this all together: consider buying deep OTM calls on, say, one-year forward WTI options. The premium you pay for the calls is your maximum risk, and if WTI soars, your ROI could be huge (that’s the convexity part.) The bid/offer spread on such options is probably scary wide; liquidity will be “thin,” and WTI has rallied ~40% in the last month – so this might not be the best time to jump in.
This idea is not investment advice – for anybody – this idea is only intended to get you thinking of different ways to trade an idea.
Quotes From The Notebook
“In the real world, things generally fluctuate between “pretty good” and “not so hot.” But in the world of investing, perception often swings from “flawless” to “hopeless.” Howard Marks Feb 2016
My comment: I liked Howard’s book (The Most Important Thing) so much that I read it twice. It’s a funny thing for a commodity trader to do, given that Howard is a long-term value investor. But his rules and principles fit like a glove for me. This quote is particularly timely. Not long ago, the stock market was “flawless” – an easy place to make money. Today, perceptions have changed—Big Time.
“I have no time for the past. I only look to the future.” Herve Martin – July 2019 – Owner – The French Table Restaurant – explaining why he has no interest in meeting with his ex-wife of many years for a “let’s be friends” visit.
My comment: I’ve known Herve for more than 20 years. He came from the Burgundy region of France and still speaks with a heavy accent. I’ve had many wonderful dinners at his restaurants (my family organized a surprise 70th birthday dinner for me with 20 friends at the French Table.) I loved his quote because he was so STRONG about it. I treasure my memories so much that they often overwhelm me. I could never say that I have no time for the past, but I loved his passion for the future.
Please Do Me A Favour
If you like reading the Trading Desk Notes, please forward a copy or a link to a friend. Also, I genuinely welcome your comments, and please let me know if you would like to see something new in the TD Notes.
The Barney Report
Barney was lying low yesterday. He had been at the beach with Moma two days ago and must have eaten something when she wasn’t looking. He threw up his dinner that night and breakfast yesterday morning. Moma fed him some mashed potatoes and carrots last night, and he kept that down.
This is the first time Barney has been sick, and he’s taken it pretty well. He gobbled down his breakfast this morning, and I expect he will be 100% today. He was 13 pounds on November 2 when he came to live with us; he was 37 pounds two days ago.

The February 4 & 5 World Outlook Financial Conference
|
I’ve attended every one of Mike Campbell’s World Outlook Financial Conferences since 1990; I’ve been a speaker and/or MC every year since 2002.
I attend the conferences because I get valuable ideas on a variety of markets that I would never have developed on my own – ideas that I use to generate trading profits. This year’s conference will be online because of Covid restrictions. It’s not as much fun as attending in person, but, when you can watch at home there are no travel issues/expenses, and you can watch the conference live and “on-demand” later. (On-demand later is fantastic because there is so much great content that you will want to watch parts of the conference, if not the whole thing, again!) Click this link for Event Info, FAQs, Agenda, Speakers and to buy an access card. https://mikesmoneytalks.ca/world-outlook-conference-2022/ I highly recommend this conference to you. The cost/benefit ratio is fantastic! Victor Adair |
Victor Adair retired from the Canadian brokerage business in 2020 after 44 years and is no longer licensed to provide investment advice. Nothing on this website is investment advice for anyone about anything.
Peak Fed Hawkish – Or Minsky Moment?
Peak Fed hawkish means the markets have WAY over-anticipated the consequences of Fed tightening (the Fed will stand down) – Minsky moment means there has been a sea-change at the Fed, and you ain’t seen nothing yet! Both opinions have eloquent spokesmen; recent short-term price action has been choppy as markets decide which view will prevail.
Equities
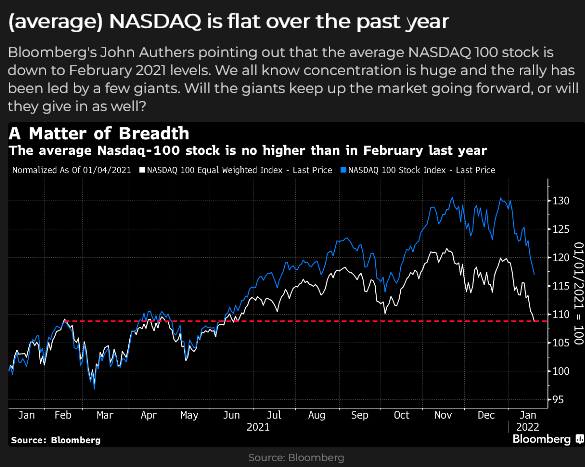
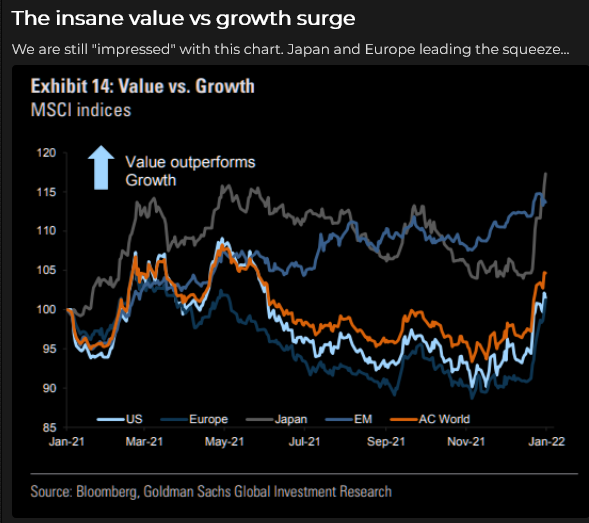
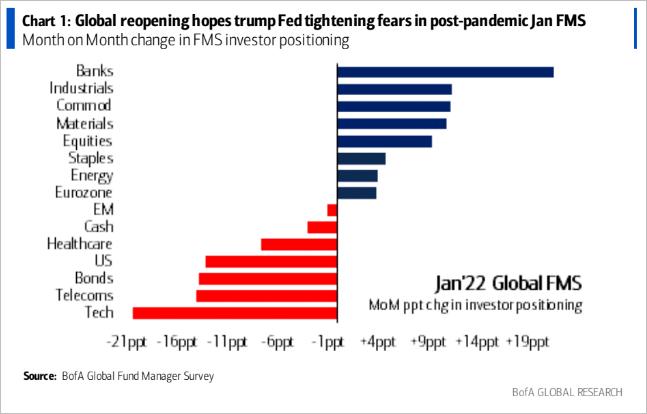
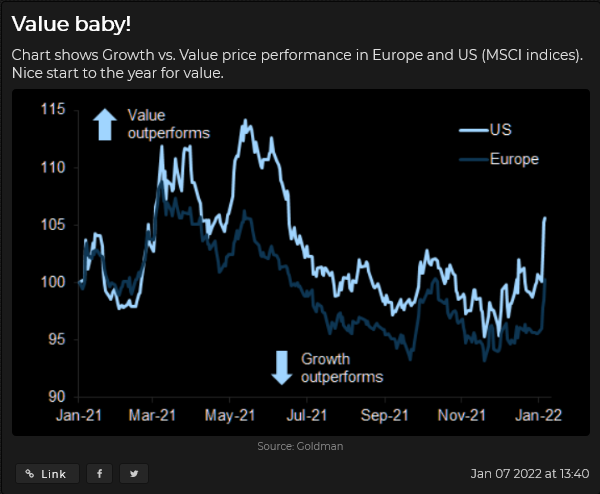
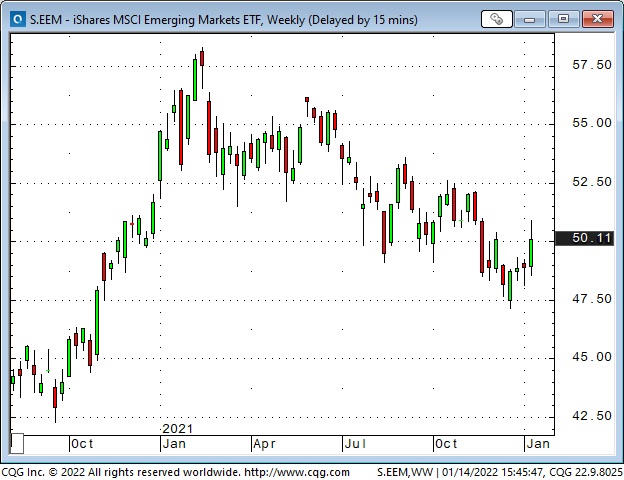
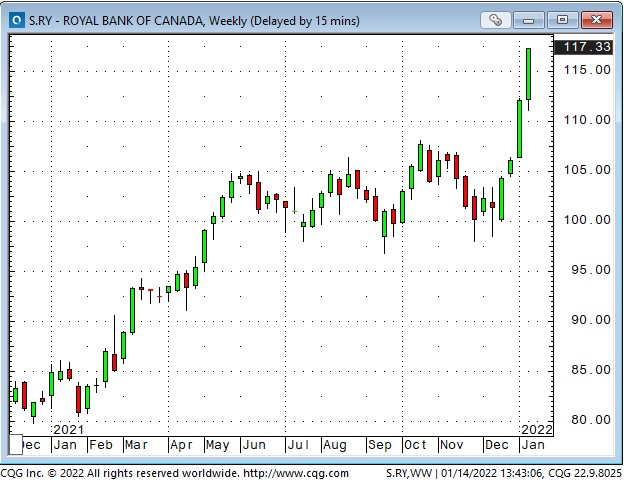
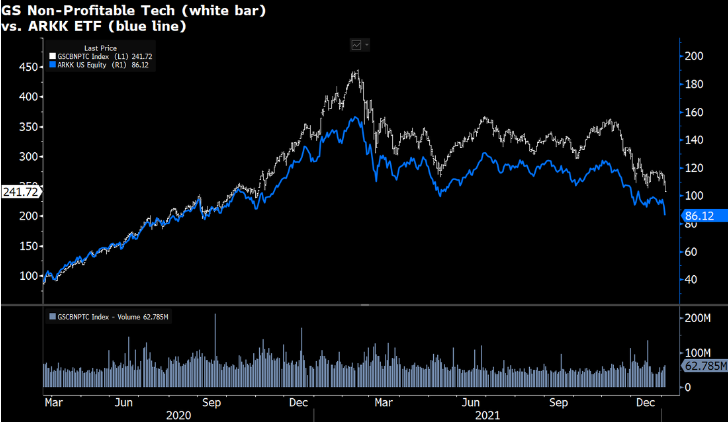
All major North American stock indices are off their highs, but the BIG action has been the rotation from sector to sector. Bank shares love higher interest rates; non-profit tech has tumbled (the bear market in crap continues.) Long-suffering Value has outperformed Growth. Emerging markets are up after a miserable 2021.
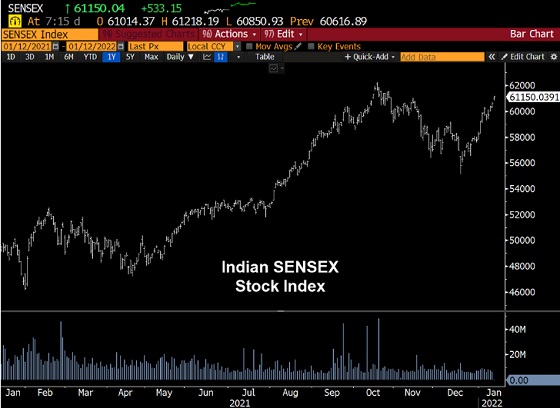
Big Tech has been the main reason American Indices have HUGELY outperformed the ROW – if that changes, then capital flowing away from US markets may weaken the USD.
Emerging market ETF:
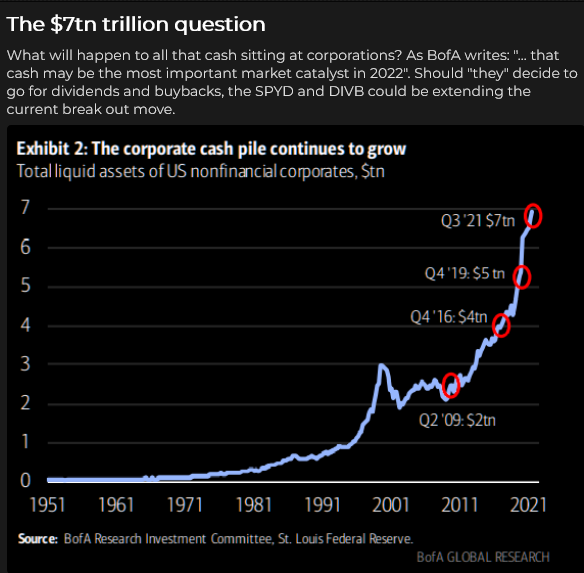
Buybacks have been a BIG source of support for the market – will that continue?
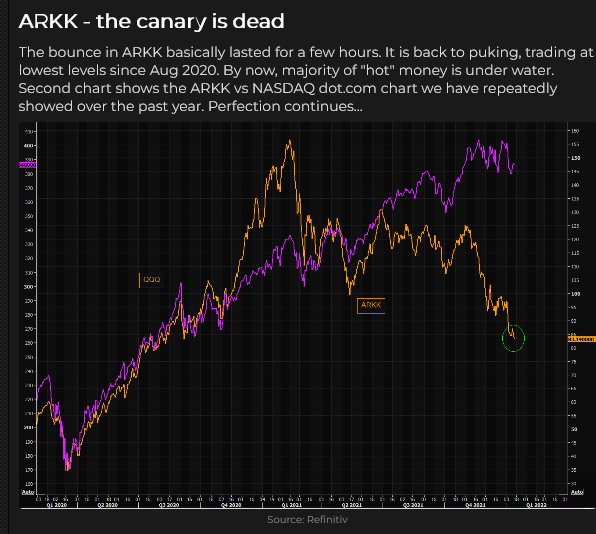
AARK Vs. QQQ
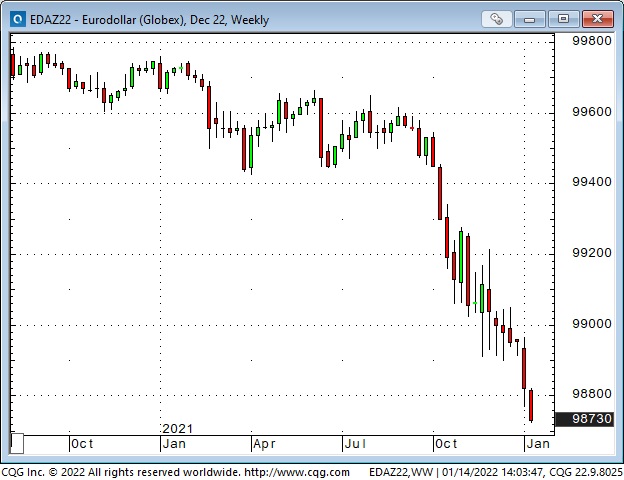
Interest Rates
Nominal and real rates have surged higher (but real rates are still negative.) Eurodollar futures are pricing in four quarter-point increases this year.
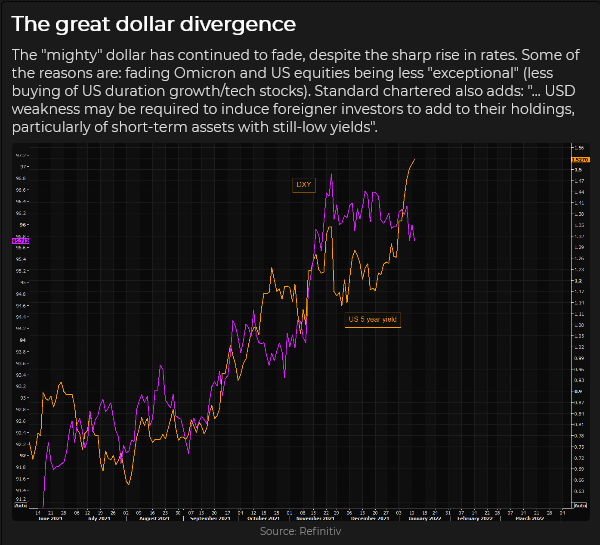
Currencies
THIS WEEK, the US Dollar Index fell to a two-month low (currency traders are taking the Peak Hawkish view) after a steady rally since early last summer. Remember, currency trends ofter reverse around the turn of the year.
In this chart, the purple line is the USD Index; the gold line is the yield on the 5-year Treasury.
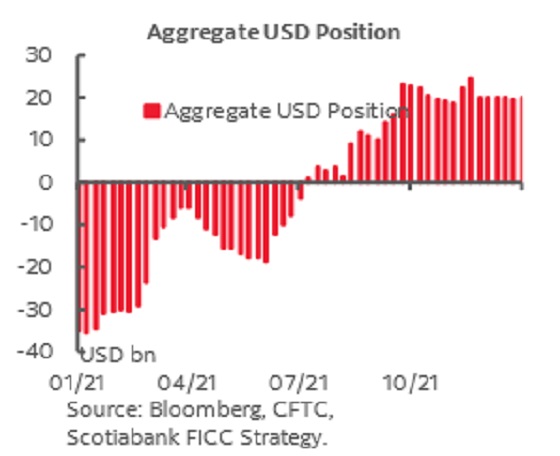
Futures market speculators have been net long the USD against other currencies. (AUD and Yen have been the big shorts.)
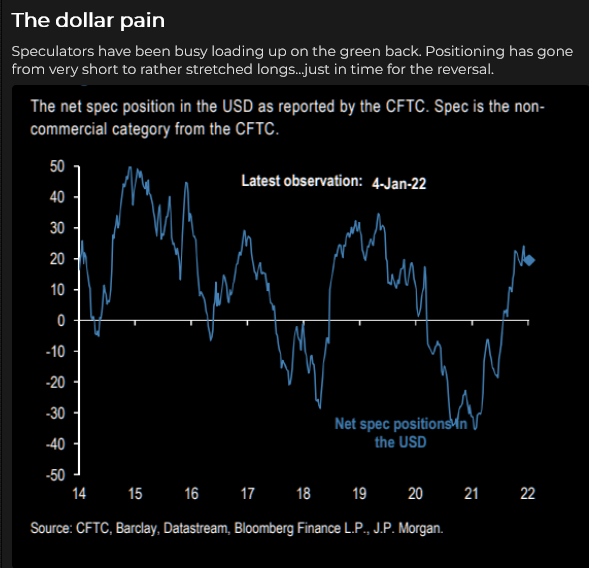
This chart shows weekly positioning to the week ending Jan 11, 2022.
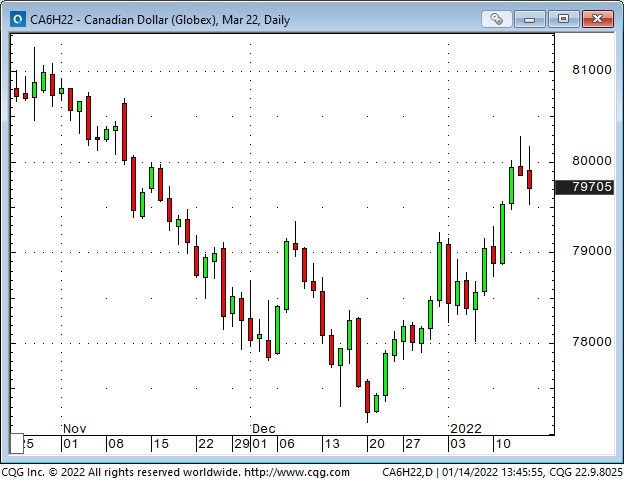
The Canadian Dollar ignored weak equities the past two weeks but rallied on strong commodities and a weak USD. Traders are expecting the BoC to increase rates at their Jan 26 meeting.
The Euro rallied out of a narrow two-month range – perhaps the ECB will increase rates to “fight” soaring inflation in the Eurozone.
The Yen hit a five-year low last week – but caught a bid this week as the USD and the stock market fell. Futures market speculators were nearly $10B short as of Jan 11, 2020 – an eight-week high.
Gold
Rising real interest rates (they’re getting less negative) have not been good news for gold. Still, gold has also struggled to benefit from recent weakness in the USD and has not caught a “worry” bid from stock market weakness or geopolitical concerns.
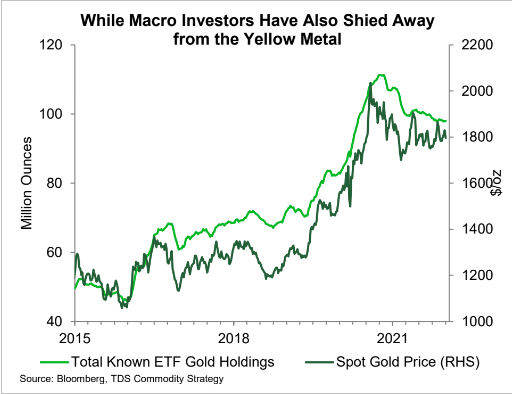
I trade gold in the futures market, but I pay attention to the gold ETF market as a good “sentiment” indicator of longer-term investor interest in gold. They have been shunning gold for the last 18 months – chasing other things. If gold starts to rally, they will begin rebuying gold ETFs.
Comex speculators are net-long the equivalent of ~620 tonnes of gold as of Jan 11. Their record net long position was >1,050 tonnes equivalent around the 2020 Covid panic.
Commodities
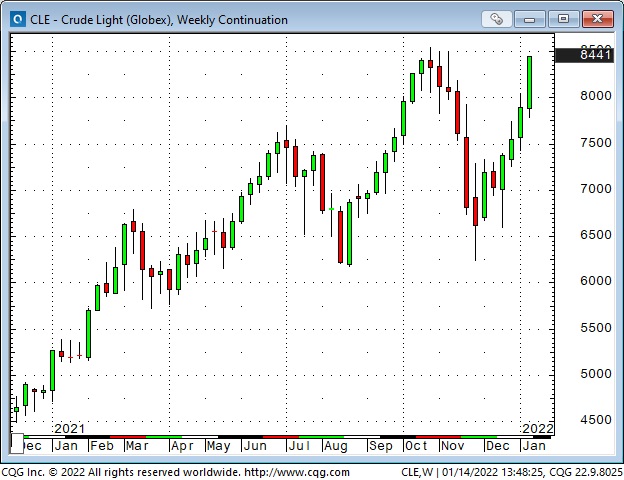
WTI crude oil has rallied >$20 from the Thanksgiving collapse and is approaching the seven-year highs made last October/November, despite the recent “risk-off” tone in other markets.
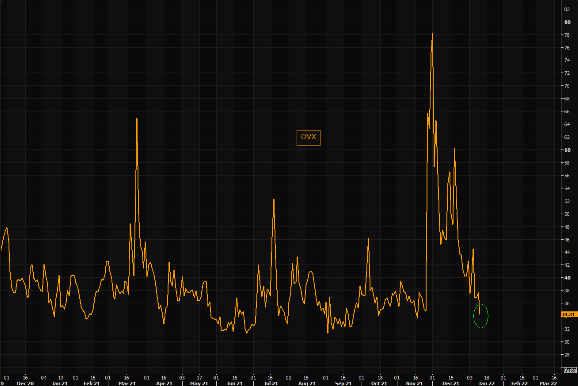
Crude oil VOL spiked on the Thanksgiving collapse – it is now back to before Thanksgiving levels.
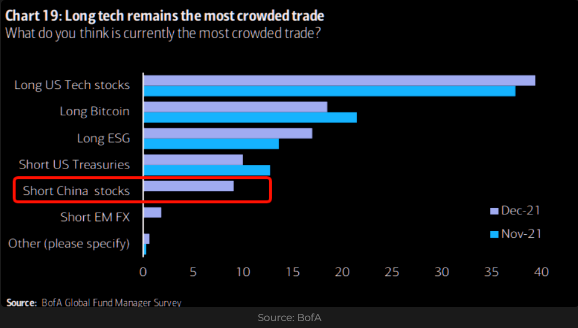
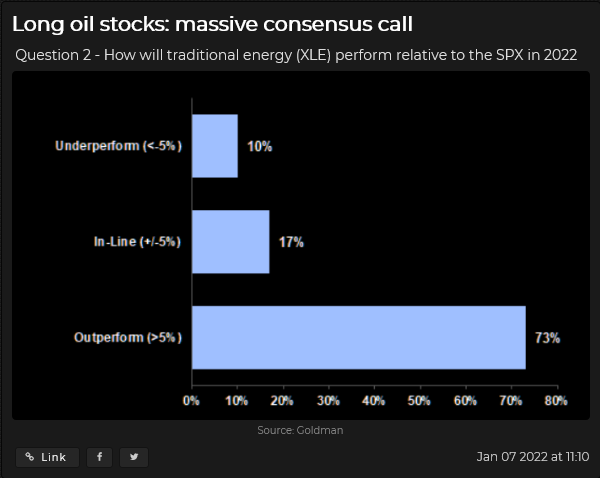
Energy stocks were dogs in 2020 but were big winners in 2021. This graphic from a Goldman Sachs survey of client expectations shows that they expect more of the same for 2022.
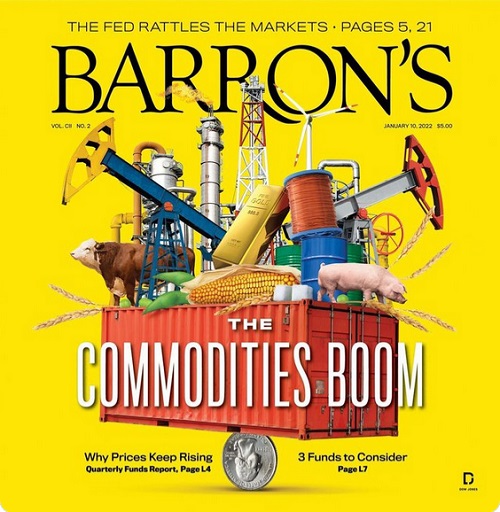
The CRB commodity index hit new seven-year highs; the Goldman Sachs index has returned to the seven-year highs made last October – different commodity weightings account for the differences in the indices. Beware magazine covers?
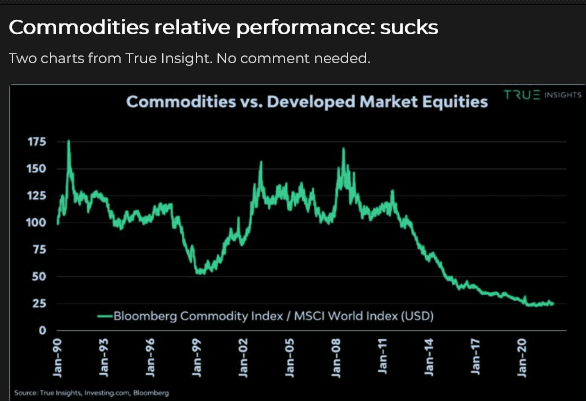
Everybody knows commodities are cheap relative to the high-flying stock market – but this chart shows how CHEAP commodities are – or how EXPENSIVE stocks are! (Maybe the long-term value pairs trade is to buy commodities against shorting stocks. But people doing that over the last five years have not made any money – the $64Trillion question is, why should it work now? )
On My Radar
There is SO much going on that it’s impossible to keep up to date, which is why I trade price action rather than the “news.”
But I don’t ignore the news. I read a wide range of market comments – to get an idea about sentiment and speculative positioning – to anticipate how speculators may react to events.
(I see a lot of marketing crap dressed up as analysis, almost always designed to provoke a fear response. I don’t like this bullshit, but folks need to realize that bad actors are out there, and they know how to take your money.)
I also try to forgive myself for missing SO many things that seem obvious in hindsight.
There is always “tension” in the markets, less during complacent times and more during stressful times. Volatility fluctuates with changing tension levels – so I’m always watching volatility.
I’m also always watching inter-market and intra-market relationships. For instance, if the USD is falling against most currencies, but gold is stuck-in-the-mud, that may be a “tell” that gold is a short if the USD rebounds.
The Peak Hawkish guys take the view that the Fed is all bark and no bite. That the Fed will “back off” if the stock market has a hissy-fit, and that with all the debt in the world, they can’t raise interest rates without causing the economy to tank. They also think that there is a good chance that the Fed is late (again) and will be tightening into an economic slowdown – exacerbating the problem. Their trade: buy Eurodollar futures.
The Minsky moment guys think that a severe correction is WAY overdue, so it will be nasty. Their trade: buy OTM S+P puts.
I could see it going either way – the back-and-forth between which view is ascendant will ramp up the tension, volatility and create choppy price action – a trader’s market!
Passive investing is on my longer-term screen. The primary rationale for passive is that active managers don’t beat their benchmarks (on a multi-year horizon) and are expensive relative to passive, so why not just buy the indices if you want to be in the stock market? (For a great history of the development and growth of passive read Trillions by R. Wigglesworth.)
More than half of all the new money going into the market these days is passive. The sales pitch (in addition to what I’ve noted above) is that the stock market always goes up (over the long-term), so make regular contributions to a passive fund, ignore short-term fluctuations, and you’ll have a lot of money when you retire. Just look at these stock market charts over the last 100 years!
There are various estimates of how much of the total market cap is now passive; Bank of America says that ~54% of US domestic equity funds are passive. Whatever the number, it is HUGE, and has grown exponentially over the last decade.
In some respects, passive is a perpetual motion machine. The more money that flows into passive investments, the more powerful they become. The fund managers “buy the indices” according to weightings. So for every new dollar coming in, the fund managers put ~25 cents into the top 10 stocks – regardless of their price. The passive investment industry holds essentially zero cash and is ~100% invested at all times, with minimal trading. (If a new company is added to the indices, like Tesla in Dec 2020, then the fund managers rebalance their holdings to include the appropriate weighting for Tesla.)
I keep an eye on passive investing because someday, some people who own those investments (individuals and institutional accounts) will start selling. They won’t sell on a 10% correction – they’ve been told to ignore the minor ups and downs, but if the stock market has been trending lower for months and is off 30% or more, they will start selling, and their selling will create more selling.
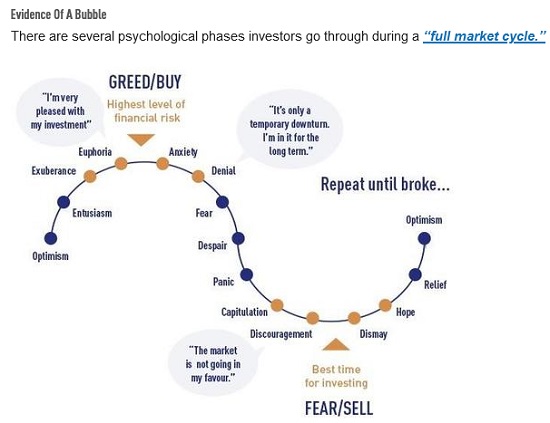
On this full market cycle chart, I would expect to see passive selling start around the “Fear” point and continue to “Dismay.”
Mike Green is an experienced market pro tracking passive investments. I highly recommend his recent interview with Daniel DeMartino Booth. “Shattering the Myth About Passive Investing.”
My Short-Term Trading
I started this week with long positions in the S+P and the Euro, looking for a bounce in the S+P after last week’s steep decline, and looking for an upside breakout in the Euro after six weeks of sideways action. During the Sunday overnight session, I was stopped for small losses in both positions. With the S+P down hard early Monday, I was glad to be out.
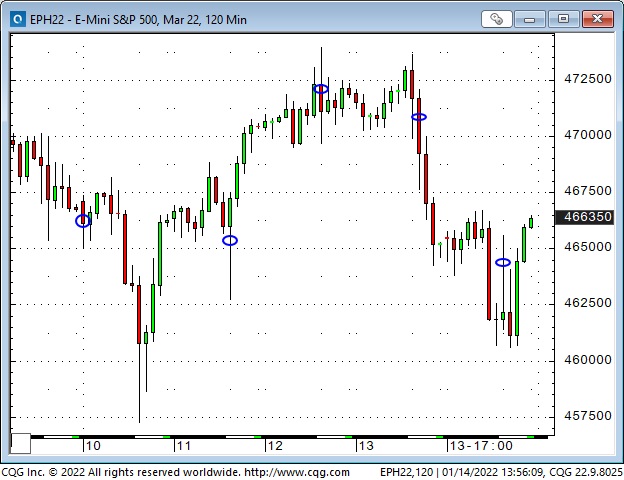
I bought the S+P early Tuesday and was stopped for a slight loss. I rebought it Tuesday and sold it Wednesday for a 70 point gain. I shorted the S+P Thursday and covered it for a 73 point gain Friday.
I bought the Euro Tuesday and sold it for a 76 point gain Wednesday.
I bought CAD calls Tuesday and sold Wednesday for a 21 point gain.
I bought gold Wednesday and was stopped Thursday for a $10 per ounce loss.
I’m flat going into the weekend. My net P+L for the week was a gain of >1.5%.
Thoughts On Trading
Could you make money by flipping a coin to decide whether to buy or sell a market? I remember pondering that question years ago – I even considered setting up a separate account to experiment with the idea, but I never did.
I was considering the coin flip idea back then because I noticed there were nearly always some “experts” forecasting higher prices while other “experts” were forecasting lower prices. People seemed to follow the experts who told them what they wanted to hear.
If the coin flip idea gave me a 50/50 chance of being right on the market direction (without my bias getting in the way), then if I applied good risk management techniques (cut losses quickly, let profits run), maybe I would be able to make money over time.
Another reason why I thought the coin flip method might work was because many famous CTAs were using technical analysis exclusively to make their buy/sell decisions. They were making HUGE money without paying any attention to what the “expert” forecasters said!
I didn’t set up a “coin flip” account because I thought it was important, no, necessary, to have an “edge” in my trade selection process – and the coin flip method didn’t provide an “edge.” (If I had thought about it more, I might have realized that my “edge” would come from sound risk management, not from trade selection.)
I was reminded of my coin flip idea a few years ago when I read some comments by Peter Brandt. Peter pointed out that managing trade risks is more critical for long-term success than trade selection.
I agree, and in recent Notes, I’ve written about focusing on “when” to enter the market rather than “why.”
These days, I don’t flip a coin to make trade decisions, and I do pay attention to bullish and bearish market analyses to get a feel for sentiment and positioning risk. (For example, I’m more likely to act on bearish market price action if I believe speculative positioning is HUGELY long.)
Sizing is a critical trading risk because my objective is to avoid taking any BIG LOSSES. Big losses not only hurt my P+L but, more importantly, they destroy my mental capital, my willingness to trade. My default sizing is to trade smaller rather than bigger. I don’t want any trade to be HUGELY important (as in, Please God, this trade has got to work!)
I’m reminded of friends telling me about being in the pit, holding too big of a position, and having the market go hard against them. They had to ask someone else to liquidate their trade – they could NOT do it themselves.
Concentration is a subset of sizing. For instance, if I hold positions in several different markets (thinking I’m diversified), I’m exposed to concentration risk if all of those positions benefit from a falling dollar – and the dollar rises. Correlations often go to one in a crisis – producing concentration risk.
Quotes From The Notebook
I don’t remember if these are somebody’s quotes or my own observations – either way, they’re worth a moment of consideration.
Big Change takes forever to arrive – then happens fast.
My comment: We knew the Fed would “turn” someday, and when they finally turned, it seemed to happen fast.
Respect uncertainty.
My comment: If you don’t feel some degree of uncertainty, you don’t have all the information.
There are always unintended consequences.
My comment: This is what they meant when they told you the road to hell was paved with good intentions.
Complacency is irrational.
My comment: With all due respect to Rudyard Kipling, if you remain complacent while other people are freaking out, you probably don’t understand what’s happening!
A Request
If you like reading the Trading Desk Notes, please forward a copy or a link to a friend. Also, I genuinely welcome your comments, and please let me know if you would like to see something new in the TD Notes.
The Barney Report
Barney thinks I should stop looking at my screens and start playing with him – and his bear. He may be right. I’ve noticed that my P+L has been improving since I started taking him for long morning walks while the markets were open.

Victor Adair retired from the Canadian brokerage business in 2020 after 44 years and is no longer licensed to provide investment advice. Nothing on this website is investment advice for anyone about anything.
Each week Josef Schachter gives you his insights into global events, price forecasts and the fundamentals of the energy sector. Josef offers a twice monthly Black Gold newsletter covering the general energy market and 30 energy, energy service and pipeline & infrastructure companies with regular updates. We also hold quarterly webinars and provide Action BUY and SELL Alerts for paid subscribers. Learn more.
EIA Weekly Oil Data: The EIA data of Wednesday January 12th was seen by the market as bullish for energy prices as US Commercial Crude Stocks fell 4.6Mb (a larger decline than the forecast of down 1.9Mb). Refinery Utilization was at 89.4%, above the 82.0% level of a year ago but below the 92.2% of two years ago. Offsetting this positive news for energy bulls was that Total Motor Gasoline Inventories rose a massive 8.0Mb on the week while Distillate volumes rose 2.5Mb as demand weakened and refineries processed more product. US Crude Production fell 100Kb/d to 11.7Mb last week. Total Demand rose 1.164Mb/d to 20.829Mb/d as other oil consumption rose by 1.529Mb/d. Motor Gasoline demand fell 265Kb/d or to 7.906Mb/d (in early 2020 demand was 8.133Mb/d). Jet Fuel Consumption rose 138 Kb/d to 1.606Mb/d compared to 1.611Mb/d in early January 2020 before the pandemic hit. Cushing Inventories fell 2.5Mb to 34.8Mb/d. Overall we would rate this week’s data as modestly negative for energy prices.
EIA Weekly Natural Gas Data: Weekly withdrawals started seven weeks ago as winter demand initiated the withdrawal season. Last week Thursday’s data showed a moderate withdrawal of 31 Bcf, lowering storage to 3.195 Tcf. The biggest US draws were in the Midwest (25 Bcf), and the Pacific (16 Bcf). The five-year average for last week was a withdrawal of 100 Bcf and in 2021 was 134 Bcf. Storage is now 3.1% above the five-year average, so the US is not facing a natural gas shortage as is seen in Europe and Asia. NYMEX today is US$4.79/mcf, due to the frigid Arctic weather forecast for the upcoming week. AECO spot today is trading at $4.21/mcf. Last week’s natural gas data (out today) is likely to show a large draw of over 100 Bcf last week due to the cold weather and high heating needs. With the two key winter months for natural gas demand now here (January and February) we should expect large price moves to the upside on very cold days. Spikes over $6/mcf are likely to occur when weekly withdrawals of over 200 Bcf are seen. After winter is over natural gas prices should retreat and if the general stock market decline unfolds as we expect, a great buying window could develop at much lower levels for natural gas stocks in Q2/22.
Baker Hughes Rig Data: The data for the week ending January 7th showed the US rig count rose two rigs (unchanged the prior week) to 588 rigs last week. Of the total working last week, 481 were drilling for oil and the rest were focused on natural gas activity. The overall US rig count is up 63% from 360 rigs working a year ago. The US oil rig count is up 75% from 275 rigs last year at this time. The natural gas rig count is up a more modest 27% from last year’s 84 rigs, now at 106 rigs.
Canada had an increase of 51 rigs as activity recovered from the holiday season to 141 rigs. Canadian activity is up 21% from 117 rigs last year. There were 39 more oil rigs working last week and the count is now 78 oil rigs working, up from 53 last year. There are 63 rigs working on natural gas projects now, down one rig from 64 last year.
The overall increase in rig activity from a year ago in both the US and Canada should continue to translate into rising liquids and natural gas volumes over the coming months. The data from many companies’ plans for 2022 support this rising production profile expectation (note CNQ’s announcement this week). We expect to see US crude oil production reaching 12.0Mb/d in the coming months. Companies are taking advantage of attractive drilling and completion costs and want to lock up experienced rigs, frack units and their crews as staffing issues are getting tougher for the sector. We expect US production to reach 12.5Mb/d by mid-2022.
Conclusion:
Bearish pressure on crude prices:
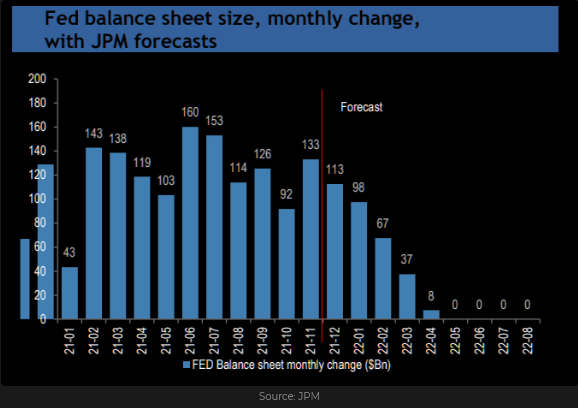
1. The US Federal Reserve is ending its US$120B/month bond and mortgage purchases in March 2022, which will remove 6%+ of monetary stimulus from the economy. Forecasters now expect three to four increases in Federal Funds rates in 2022. In addition the Fed is likely to stop repurchasing maturing bonds and mortgage holdings which would remove an additional US$100B per month of monetary stimulus. Overall this would remove 11+% of monetary heroin by the end of 2022 from GDP and should cause a weakening US economy and slow down rising inflationary pressures.
2. Omicron Covid-19 caseloads are growing around the world with record infection rates. The US hit over 1M new Covid cases per day. Hospital systems are near or at capacity and medical staff shortages are rising due to infections, burnout and quitting. Medical authorities are now focusing on ICU admissions for their measurement data of the severity of the pandemic. Deaths in the US have reached 842K (up 14K over the last week) and worldwide 5.5M. China has tightened travel restrictions that may last for at least six months and slow their economy down. Three cities with over 20M people have now been shut down.
3. China is buying more oil from sanctioned Iran which leaves less oil to be purchased from Saudi Arabia and other OPEC members. The main reason is price, which Iran is offering at >US$4/b less than the ICE Brent price. In addition Venezuela (also helped by China buying their even more discounted oil) is lifting its production with the help of Iran which is selling them diluent so that they can sell more exportable grades. According to Bloomberg, in December they reached 1Mb in one day and exported 619 Kb/d in the month. To compete, Saudi Arabia has now lowered its price for Asian buyers to regain market share. China imports may fall by 400+Kb/d as the Omicron variant spreads and more lockdowns are occurring across the country.
4. Kazakhstan has returned its oil production to full capacity of 1.9Mb/d with their largest export customer – China, happy that disruptions only lasted a few days (Chevron the operator confirmed this on Tuesday). Kazakhstan is planning to raise production to over 2.0Mb/d by the end of this year with China the key buyer.
5. Iraq plans on adding 250Kb/d to its production in Q2/22 from its Basrah after rehabilitating aging pipelines connecting to the port in recent months. Total export capacity should then reach 3.45Mb/d.
6. CNOOC sees increasing its production capacity by 7% in 2022 on top of an increase in production of 5% last year. Growth will come from both onshore and offshore fields. Their biggest success has been with the Bohai offshore cluster field that produced over 602 Kb/d in 2021. In 2022 they plan on drilling 227 offshore exploration wells and 132 onshore exploration wells (Reuters January 12th).
Bullish pressure on crude prices:
1. OPEC met on January 4th and agreed to lift February production by their 400,000 b/d long-term plan. In December they may have increased production only by 310 Kb/d according to a recent Platt’s report and not the promised 400Kb/d. The official report comes out next Tuesday January 18th. OPEC sees crude demand increasing this year and that the pandemic will not impact demand this year. They expect global demand to rise by 4.2Mb/d this year. OPEC+ holds their next meeting on February 2nd. Many OPEC members (led by Oman) want to see US$100/b for Brent in 2H/22.
2. The Iran deal is not seeing progress as the Iranians continue to want removal of sanctions to sell oil, but do not want to slow down their nuclear weapons program or allow intrusive UN inspections. For energy bulls this means that 1-2Mb/d of incremental Iranian oil is now unlikely to come onstream in 2022.
3. Libya and Nigeria continue to have production difficulties and have not been able to use their increased quota’s.
4. Once the ground is frozen for tank battles, Russia could invade Ukraine which will result in additional sanctions being added to pressure Russia to desist. Russia may face OECD sanctions on sales of crude oil to western Europe. This could add a war premium to crude prices. Natural gas is a different story and should not face production sanctions as Russia is the main provider to Europe and there are no alternatives in the short term.
CONCLUSION:
WTI rose sharply over the last week by US$6/b to US$82.64/b due to strong winter demand for heating oil in Europe and Asia (cheaper than natural gas) and the war drums by Russia regarding Ukraine. The bulls are watching the high international natural gas prices versus crude and OPEC’s positive crude oil demand outlook, to push prices higher. We remain focused on the health and strength of the US and China economies (the largest two in the world). We see crude oil prices having US$25-30/b of speculative value. This past week speculative shorts have felt the pain of margin squeezes, and this caused significant short covering, as the speculative bulls took them on and took them to their ‘give-up’ pain threshold. This is like the MEME moves against hedge fund shorts in AMC and Gamestop seen in 1H/21. Remember the offset of this when UK speculators drove the price of crude down to negative territory in April 2020 when the May contract was expiring. Crude fell from over US$25/b to negative US$20/b in under two weeks.
As the winter weather subsides, the price of WTI crude should retreat towards US$62-65/b. More downside is likely if the US and China economies stagnate and/or fall into recession in the coming months. We see the current price strength as similar to what occurred in Q2/08 when crude ran from US85/b in January to over US$147/b in July. There was little excess capacity anywhere in the world and crude demand was strong that summer. Price moves of US$3-5/d occurred during the run up into July. Then investors and speculators were extolling the sector, just like now. For investors and speculators it was to chase what was hot and make sure you owned it.
We remain bearish on crude prices due to the supply surplus that should start to be seen in Q2/22. Economic activity in the two largest economies in the world is slowing and recession is possible. The US Federal Reserve is going from supplying monetary heroin to forcing monetary withdrawal (tapering and not reinvesting maturities) in order to knock down the high inflation. US interest rates will rise materially in 2022. In 1H/08 the scenario was positive and the market viewed energy as ‘Happy Days Are Here’ and this all changed when the financial crisis hit. WTI fell in six months from US$147/b to US$33.55/b. We don’t see as abrupt a price decline but still see a material decline as the various asset bubbles burst as the monetary heroin is withdrawn. A financial and monetary crisis is likely this time as the bubble in most assets is more extreme than in 2008.
Energy Stock Market: The S&P/TSX Energy Index currently trades at 186 (up 13 points over the last week) as bullish energy investors elevated their favourite names and generalist money managers were forced into the sector. Generalist investors watch the weighting in the TSX and try to mirror the market average. This upward move is gaining extrapolation followers.
This is just the opposite of late 2008 – early 2009 or like Q1/20, when running for the exits was occurring. The S&P Energy Bullish Percent Index is at 95.24% or in SELL territory. Caveat Emptor! For a sector that was so hated in recent years, the current lovefest is disturbing.
We are working towards returning to Mount Royal University (MRU) (after a two year pandemic halt) for our ‘Catch the Energy’ conference on October 22, 2022. We will be discussing the protocols on attendance, food service, masking and QR code verification with MRU in Q1/22. We look forward to adding more companies and focus the event on attendees having safe and maximum, face to face time with company management. More on this to come. Please save the date in your calendars.
Our January Interim Report will come out on Thursday January 13th and will include our concerns about the general market (MEME stocks are being massacred) and the underpinnings of the general market are weakening. We also include a section on the Russian/Ukraine confrontation and why this could end up badly (an invasion of eastern Ukraine).
Our next quarterly webinar will be held on Thursday February 24th at 7PM MT.
If you would like to access our January Interim Report or any of our previous reports or the webinar archives, go to https://bit.ly/34iKcRt to subscribe.
Please feel free to forward our weekly ‘Eye on Energy’ to friends and colleagues. We always welcome new subscribers to our complimentary macro energy newsletter.
Interest Rates Surge Higher – Consequences Follow
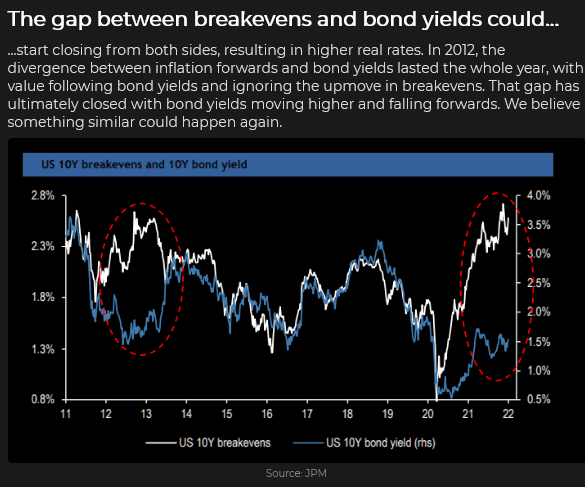
The 10-year US Treasury bond yield hit a 2-year high of 1.8% on news that the national unemployment rate fell to only 3.9% in December and that year-over-year average hourly earnings had surged by 4.7%.
American futures markets are now pricing four quarter-point interest rate increases within the next year on expectations that the Fed is determined to fight inflation and will accelerate the taper, raise interest rates and reduce the size of their balance sheet.
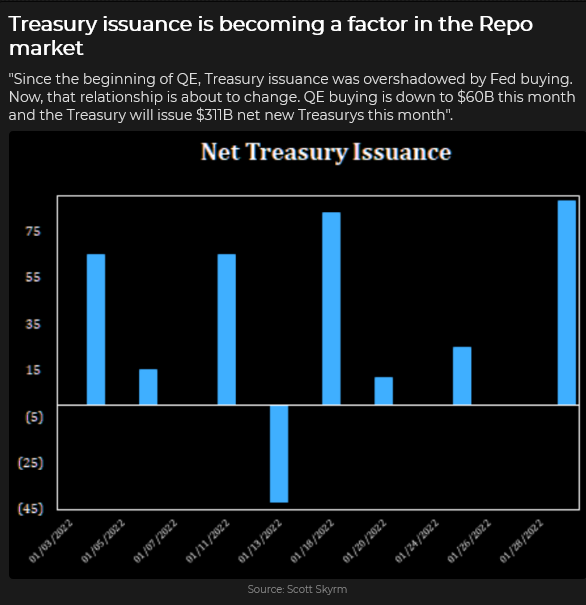
Another reason for falling bond prices: The Fed will be buying fewer bonds while the Treasury will be issuing more.
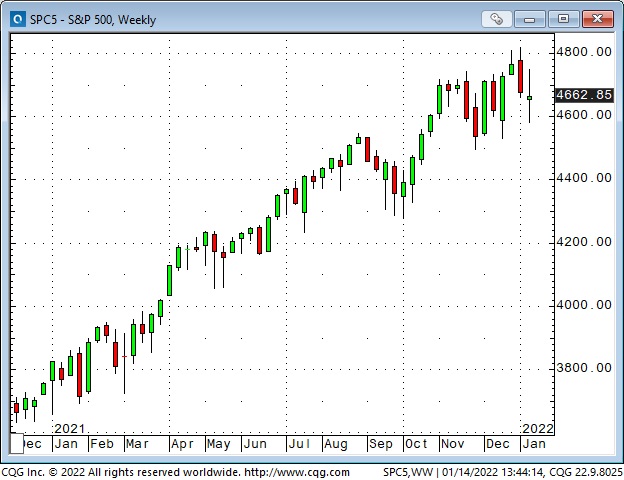
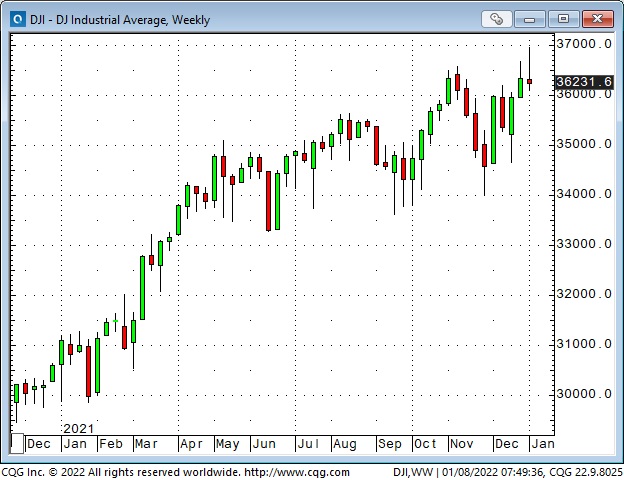
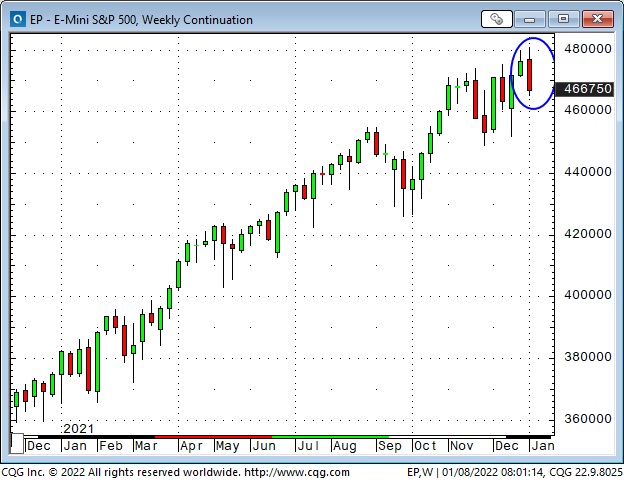
The S+P and DJIA Hit New Highs Early This The Week, Then Tumbled Wednesday On Hawkish Fed Minutes
The Santa rally from December 20 to January 5 boosted the DJIA >2,000 points to fresh All-Time Highs (front-running expectations of a TIDAL WAVE of new cash coming into the market in January). Still, the market reversed hard Wednesday when the Fed’s December meeting minutes showed a more hawkish-than-expected Fed. The S+P chart had a Weekly Key Reversal Down.
Interest rates have been rising for the past month, with the consequences initially hitting more speculative “investments” while the “Generals” soldiered on (AAPL officially became a $3 Trillion company early this week.) Rotation was a big deal this week as capital sought safety – “growth” (things that have been trendy and hot) was sold while “value” was bid.
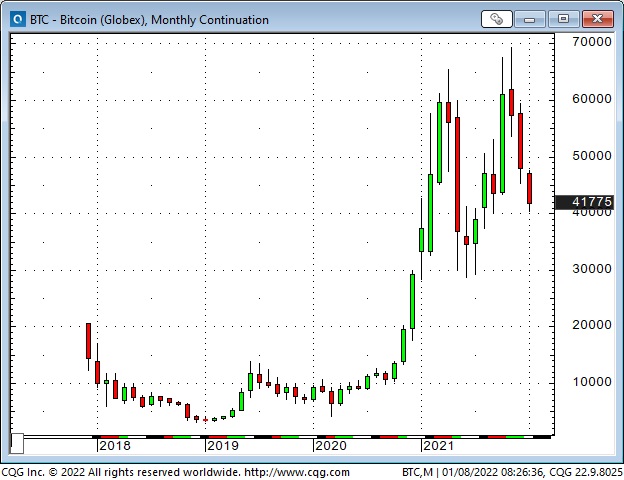
Bitcoin is down ~40% from November highs but is still a 4X gain from March 2020 lows.
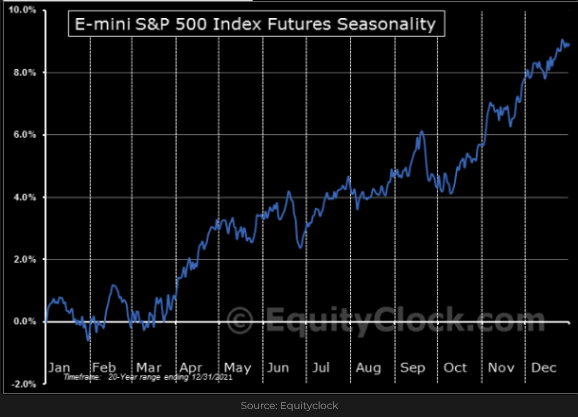
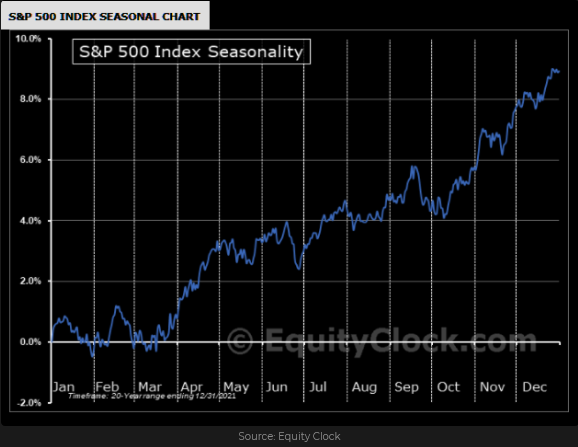
Seasonally, the S+P falls in the 2nd half of January.
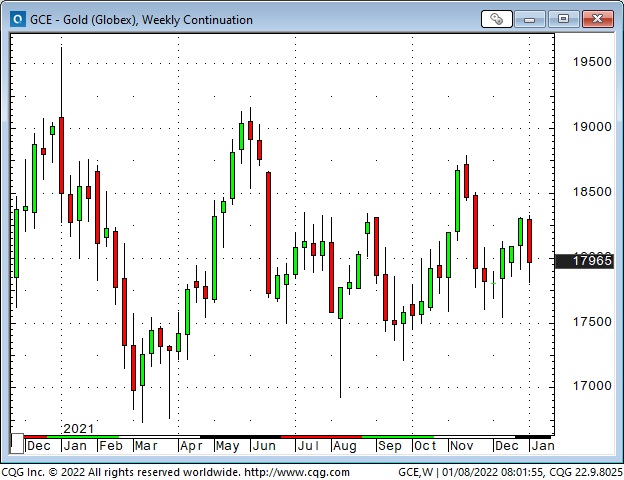
Not A Good Week For Gold
Sharply rising nominal interest rates have led to sharply rising real interest rates ( well, actually, real interest rates have just become less negative), and that’s not a good thing for gold. For the past few years, gold benefited as real rates became increasingly negative; if real interest rates (ever) turn positive, that will not be good news for gold.
WTI Crude Oil Has Rallied ~$18 From Post-Thanksgiving Lows To Hit $80
Rising American Interest Rates Have Helped Drive the US Dollar To A Five Year High Vs. The Yen
On January 6, 2020, the Yen hit a 4-year high against the US Dollar (Ex two days during the March 2020 Covid panic) when the mob invaded the Capitol Building in Washington DC. (I have repeatedly referred to that date as an inflection point – the US Dollar Index hit a 3-year low when there was “blood in the streets” and has been higher ever since.)
Last year’s fall in the Yen’s value picked up speed after September when it appeared that US interest rates would be rising relative to Japanese rates. From a technical perspective, the Yen fell through previous support levels around 90, and, from a positioning perspective, speculators were adding to their (substantial) short positions.
Last year, the Euro fell against the USD but steadied in December as European bond yields rose. (German 10-year bund yields rallied from negative 0.4% to nearly zero.)
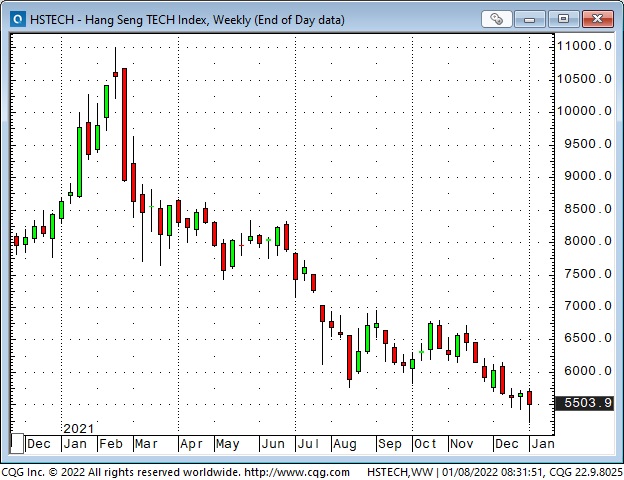
China – The Real Estate Debt Crisis Continues
70% of household wealth in China is in real estate “investments,” and Chinese real estate looks to be in the dog house. The CCP’s “Common Prosperity” policies are a significant reversal of previous policies and are slowing the economy. Formerly high-flying tech company shares continue to trend lower. China has looked like an over-leveraged accident waiting to happen. With luck, the CCP may succeed in “containing” the damage.
On My Radar
Currencies: I’m intrigued by the Euro’s price action over the past few weeks – it has gone sideways in a very narrow range. I’ve actively traded currencies for over 40 years, and I’ve noticed that 1) trends often go further than seems to “make sense,” 2) the trends often make an abrupt change in direction and, 3) the trends often change direction around the turn of the year.
The current macro environment reminds me of the late 1990s when the red-hot stock market in the USA (the DotCom bubble) was a magnet for global capital. That caused the US Dollar index to rally to a 15-year high. When the stock market (especially the Nasdaq) fell, foreign money (what remained of it) went home, and the Dollar began a multi-year decline.
One of the “reasons” the USD has been rising (especially since September) has been the idea that American interest rate premiums over other currencies would be increasing – that European and Japanese rates would not rise, or if they did, they would lag far behind US rates.
Inflation has been surging higher in Europe but not in Japan. Eurozone bond yields have been rising. Perhaps the ECB will surprise markets and start raising interest rates.
I can imagine some European capital taking profits in the US equity markets and returning home – putting a bid in the Euro. If the Euro starts to rise against the USD, other currencies might follow suit, even the Yen, and gold would likely catch a bid if the USD weakens.
At this point, this is “just an idea,” and I will be watching price action for confirmation. (I’m currently long the Euro, but only small size; if it starts to rally, I’ll try to buy more.)
The caveat here is that if the equity markets start to fall hard, then the USD will likely get a “safety” bid as it did during the early days of the Covid crisis.
Stocks: Last week, I wrote that I expected a severe break in the stock markets sometime soon, perhaps starting as early as this week. The DJIA, the S+P and the VTI (Vanguard Total Stock Market ETF) all made new highs early this week but tumbled Wednesday to Friday as interest rates soared. (Positioning risk also contributed to this week’s fall – being long the American stock market is the most crowded trade in the world.)
I don’t anticipate a nasty break like the March 2020 Covid panic (unless we get a geopolitical shock). Still, I could see a “rotation” between sectors with a trend away from “speculative” and towards “value.” That alone would let some “air” out of the major indices.
My long-time friend, Bob Hoye, likes to remind me that the “real” reason that markets could take a tumble is because speculators (who’ve had a GREAT run) get exhausted. I agree!
Some analysts believe that the Fed’s willingness to fight inflation will “cave” quickly if the stock market tumbles. (If past is prologue, they might be right.) But I’ve written many times over the years that the Fed “knows” that their policies have amplified “inequality” in America, and the “strike” on the “Fed put” might be a lot lower than some shareholders expect.
So – how “political” is the Fed? Biden’s popularity is low, and political pundits tell us that the Dems may lose both the House and the Senate in the mid-terms. Consider this: only ~50% of all Americans own shares directly (not counting shares that pension funds may hold on their behalf), but the wealthiest 10% of the population own more than 80% of all publicly traded shares.
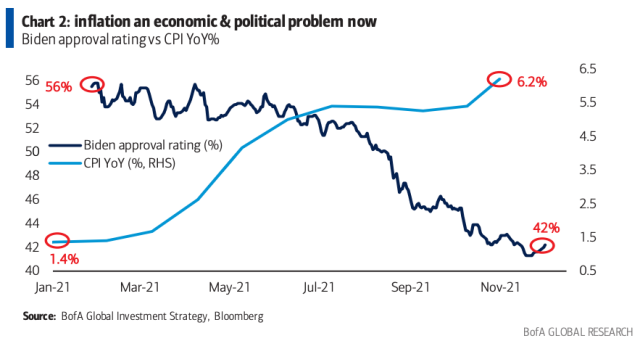
Inflation, especially in things like food and shelter, is a HOT political issue, and it hits “non-shareholders” far harder than it hits “shareholders.” Given that there are a “LOT” of voters who don’t own any shares, the Dems current political calculus might be, “kill inflation, even if it means the stock market takes a hit.”
My Short Term Trading
I began this week short WTI and long Euro, but I was stopped for small losses on both early in the week.
I began shorting the stock market on Monday, creating small gains and losses. On Tuesday, I shorted both the Nasdaq and the S+P. I covered the Nasdaq late Tuesday for a small profit; but stayed with the S+P until Thursday, earning ~100 points.
On Friday, I bought the S+P (looking for a bounce) but was stopped for a slight loss. I rebought the market later in the day (still only looking for a bounce), and I have stayed with that trade into the weekend.
I bought the Euro after the employment report Friday, looking for it to rally out of the sideways range it has been in for the past six weeks.
I’m long the Euro and the S+P at the end of the week, with tight stops. My realized P+L for the week was a gain of ~0.6%.
Thoughts On Trading
There must be a million ways to participate in the markets, but I believe every “successful” trader has found a way to participate that suits them. (I put successful in scare quotes because there must be a million ways to define successful – but let’s agree that for most people, successful trading would include making more money than they lose.)
When I was the currency analyst for Conti (a large, Chicago-based commodity brokerage firm) back in the 1980s, I thought it was important to know “why” currencies traded the way they did. I paid attention to price action but the “why” seemed more “sophisticated” and “informed.”
These days, I still pay attention to “fundamentals,” but I think important things happen in the markets that I don’t know anything about or don’t understand. To quote Donald Rumsfield, the “unknown unknowns.”
Therefore, while I can’t seem to shake the habit of trying to know/understand “why” a market is moving the way it is, I only put my capital at risk when I can find a “setup” in the price action that works for me.
A subscriber asked me a question last week about how I trade. Here’s my (edited) reply:
Yes, I’m going to try to stay with winning trades longer.
I will stay with a trade longer if it keeps working (price action supports my opinion of where the market may be going.) I will NOT stay with a trade that is not working because I think (hope) it will “eventually” start working!
I will continue to move stops higher (in a rising market) to levels that “make sense” (for instance, if the market has risen to level X, I will now want to be out if it drops below level Y.) I will NOT move stops based on a dollar amount of risk, and I always reserve the right to sell at the market if I think the rally is over or, if the market has surged higher, I want to capture that windfall and/or I believe I can reload at a lower price.
I think of stops and trailing stops as “insurance” (protecting against capital loss) rather than the optimal way to exit a trade.
(In an attempt to try to stay with trades longer) I may experiment with taking multiple positions – treating some as short-term trades and the others as long-term.
The reason I want to try to stay with winning trades longer: I didn’t have any BIG wins last year (which is unusual), and I think an occasional BIG win is necessary to balance off a lot of small losses/small wins.
I may be wrong about that. Perhaps I can continue to grind out a living by having a win/loss ratio of ~50% but with my winning trades averaging ~3X the size of my losing trades. That may fit my “personality” better – but who doesn’t want to have the occasional BIG win?
Quotes From The Notebook
“Give trade expressions (ideas, themes) the room to prosper by widening your risk tolerance.” Hugh Hendry RTV interview 2018.
My Comment: I wish I could be more like that, but I’ve seen a lot of people “go down with the ship” when they had a great idea – that either turned out to be dead wrong, or they had their timing wrong on the trade. For my short-term trading, I will only stay with a trade that is showing positive results.
I’ve made a few longer-term bets that have worked out very well. For instance, I switched about a third of my net worth from CAD to USD when the CAD was above par. I stayed with that trade for several years and gradually unwound it as CAD fell. I hope to make more trades like that in the future!
“The whole case for the stock market today is that it is cheap relative to interest rates – and rates are priced in a distorted fashion.” Alan Fournier, in an RTV interview with (the one and only) Jim Grant December 2017
My Comment: Well, ain’t that the truth! And if it was true then, it’s even more true now.
“A great trader is someone whose idea time frame matches his trading time frame.” Paul Tudor Jones
My Comment: Exactly! If your trading time frame is out-of-sync with your analysis time frame – you’re going to have problems!
A Small Request
If you like reading the Trading Desk Notes, please forward a copy or a link to a friend. Also, I genuinely welcome your comments, and please let me know if you would like to see something new in the TD Notes.
The Barney report
The feeling you get when you’ve been out having lunch with the boys – come back to the office and discover that the “New Kid” is sitting at your desk!
Victor Adair retired from the Canadian brokerage business in 2020 after 44 years and is no longer licensed to provide investment advice. Nothing on this website is investment advice for anyone about anything.
-
I know Mike is a very solid investor and respect his opinions very much. So if he says pay attention to this or that - I will.
~ Dale G.
-
I've started managing my own investments so view Michael's site as a one-stop shop from which to get information and perspectives.
~ Dave E.
-
Michael offers easy reading, honest, common sense information that anyone can use in a practical manner.
~ der_al.
-
A sane voice in a scrambled investment world.
~ Ed R.
Inside Edge Pro Contributors

Greg Weldon

Josef Schachter

Tyler Bollhorn

Ryan Irvine

Paul Beattie

Martin Straith

Patrick Ceresna

Mark Leibovit

James Thorne

Victor Adair