
Energy & Commodities
Unlocking the Crude Oil Bottleneck at Cushing
The U.S. oil infrastructure is the product of four decades of rising imports and falling domestic supply. As those trends have reversed over the last few years, America’s network of pipelines has failed to keep pace. Designed in part to ferry oil and refined gasoline from the coasts to the interior, those pipelines are now ill-equipped to handle the enormous amount of crude gushing from shale reserves in North Dakota and Texas. Which is why so much of that oil ends up trapped in the central Oklahoma town of Cushing, the primary crude oil storage hub for the U.S. Cushing developed as an oil trading center and then as the official price settlement point for West Texas Intermediate, the benchmark that most types of North American crude are priced against. Cushing is now best known as a bottleneck for the energy industry: Oil rushes in, but trickles out. There are now more than 44 million barrels of oil stuck in Cushing, a record, and 60 percent more than was stored there just five months ago. Overall U.S. crude inventories now sit at a 21-year high. Pipeline companies are racing to build new projects aimed at pushing more oil through Cushing toward refineries as part of a larger effort to revamp America’s oil infrastructure. The first of those projects goes online this week when the flow of the 500-mile Seaway pipeline is reversed. Seaway, with a diameter of 30 inches, was built in 1976 to take crude south from the Texas Gulf Coast north into Cushing. On May 17, about 150,000 barrels of oil will be injected into Seaway at Cushing. Twelve days later, that oil will start arriving in Freeport, Tex., along the Gulf Coast, where refiners can access it. As the pump stations provide more horsepower and increase the pipe’s pressure later this year, the oil will travel faster, taking just five days to reach Freeport and increasing Seaway’s capacity to 400,000 barrels per day by early 2013. By mid-2014, that flow is expected to reach 850,000 barrels a day.

The Energy Report: Since we last talked in November, oil went from $90-110 per barrel (bbl). Has it established a floor that will stick? Or, as Porter Stansberry predicted during the summit, is it getting ready to crash? He said that the same sort of technology that brought on the glut of natural gas will lead to an abundance of oil that will depress prices.
Marin Katusa: Porter was basing his comments on the success of shale gas in North America, and with that you have natural gas liquids and some oil. In North America, gas became a victim of its own success, worsened by a warmer-than-expected winter. But understand that gas, in general, has very localized markets.
When it comes to the oil sector, people think Exxon Mobil Corp. (XOM:NYSE), Royal Dutch Shell Plc (RDS.A:NYSE; RDS.B:NYSE) and ConocoPhillips (COP:NYSE) are the biggest players. The big players are actually the national oil companies (NOCs)—Saudi Aramco, Petróleos Mexicanos (Pemex) and Petróleos de Venezuela, which are not reinvesting in operations and exploration. Their production is decreasing as a result. Cantarell, in Mexico, is one of the greatest oilfields in the world, but it’s decreasing by 3.5% every year. The NOCs are distributing profits to fund massive social programs. For instance, more than 55% of Venezuela profits from oil-funded social programs.
By the way, America imports more than a million barrels of Venezuelan oil each day and pays a premium over what it pays for domestic oil. But that’s another story.
I don’t necessarily agree that the same reasons North American natural gas went under $2 per thousand cubic feet ($2/Mcf) would apply globally. India and Japan are signing $14–15+/Mcf. It’s twice that in Europe. North America is a unique case; the rest of the world is nowhere near that when it comes to shale exploration.
TER: Will that change when the U.S. starts exporting in 2015 or so?
MK: I think 2015 is a very aggressive timeline. Eventually, the market will fix itself. But to say that oil will go to $40/bbl by Christmas? I wouldn’t take that bet. That said, for two years we’ve been using $60/bbl oil for our equations. We publish the best netbacks in the business every quarter. So if a company can make money at $65/bbl oil, it will make a lot of money at $105/bbl oil. But if you invest in companies that need $90/bbl oil to break even, you’re not going to do so well.
TER: You said the market will fix itself. Will oil go down to, say, that $60/bbl you’ve been using?
MK: Buyers are not paying producers $103-105/bbl. Because of the massive differential for selling less, the Canadian oil sands producers are selling as low as $63/bbl. In the Bakken, they’re selling for $72/bbl. So it finds its equilibrium. In the Canadian oil sands, existing production can be profitable at $60/bbl, which we’ve been saying for a couple of years. New production, if it’s open pit, it needs $90/bbl oil to be economic due to the massive inflation in equipment, trucks, tires and skilled workers.
TER: Why do we quote oil at $105/bbl if it costs $63–72/bbl?
MK: A lot of people think that Suncor Energy Inc. (SU:TSX; SU:NYSE) or any given oil producer is making $105/bbl for oil, but companies are selling their product for $63/bbl. It depends on the differential and Suncor’s selling price versus the West Texas Intermediate (WTI) crude oil price, which is the posted price. Gas producers in Edmonton are getting much lower prices than what’s quoted in the Henry Hub. The oil price in North America or the Brent price isn’t necessarily the same price a company is selling its oil for.
Rick Rule: It’s pretty complex. What people think of as the posted crude oil price comes from either WTI or Brent. That used to be the way the world worked, but we have localized differentials now. One of the differentials that Marin was speaking about is the differential between light sweet crude and heavy crude. And the differentials widen and tighten depending on a variety of factors.
For example, production efficiency in Venezuela, the traditional source of Gulf Coast sour crudes, is a factor. Transportation and infrastructure bottlenecks are factors. We’re now to the point where a critical pipeline that once transported crude from the Gulf Coast to the U.S. Midwest has been reversed because of production declines in Mexico and Venezuela, which in turn encourages U.S. Gulf Coast refiners to take heavy crude out of Canada.
All of this is what creates localized markets in oil. The international light sweet crude markets are very stout. Nigerian bonny crude and Brent crude’s international trade is marked by tightness as a consequence of declining supplies in traditional frontier market exporters, such as Nigeria as well as Venezuela and Mexico.
The North American domestic market is ironically awash in oil as a consequence of three factors: The high price of gasoline has begun to destroy demand along with the weak economy. The incredible de-bottlenecking that’s gone on in the Athabasca tar sands has doubled tar sands production in four years. And the conjunction of technologies that Marin was talking about has produced a flood of shale oil, particularly in the Bakken.
….read more HERE
“The most valuable commodity I know of is information.” (Gordon Gecko in “Wall Street” by Oliver Stone)
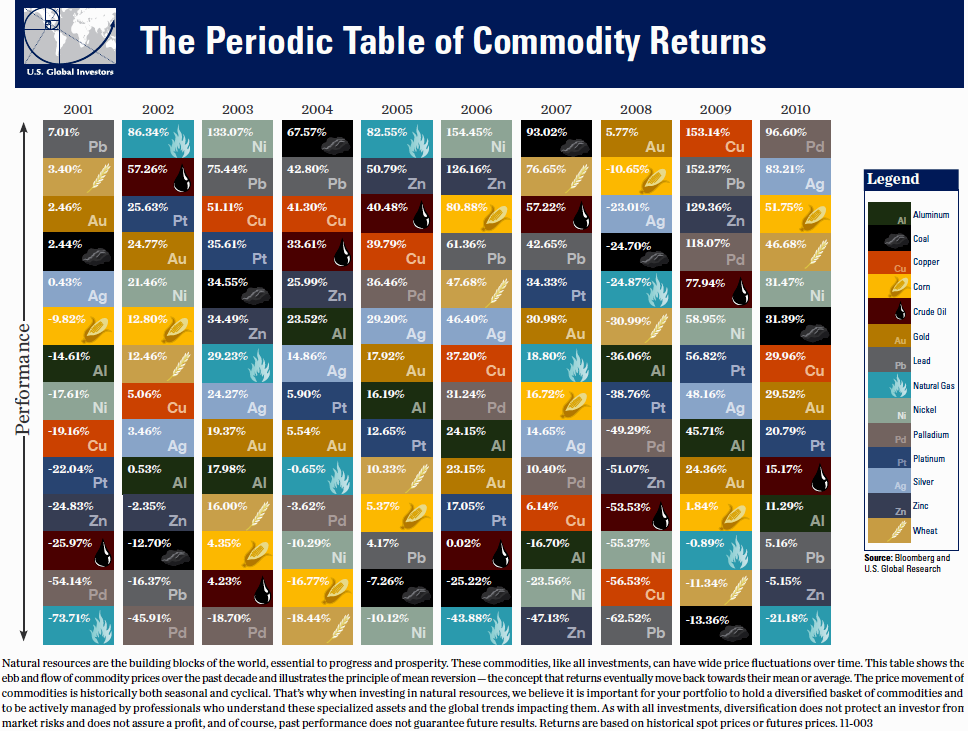
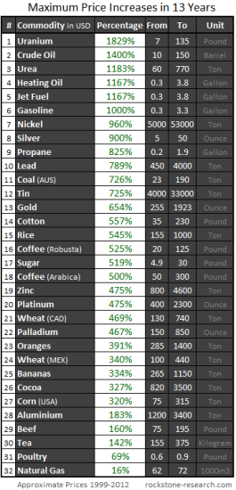
Commodities have experienced a renaissance after the bursting of the internet bubble at the end of the 20th century. The new and long-term upward trend began with most commodities in late 1990s and already lasts nearly 15 years. During this time, most commodity prices manifold strongly. The following table presents the maximum price increases of selected commodities since 1999:
Indeed, these were all pretty formidable price increases (except of natural gas) – however, also frightening at the same time. Formidable of course for investors who diagnosed correctly and timely the start of the bull market in commodities now sitting on luscious profits potentially chilling the champagne now. Yet simultaneously frightening, because what if the boom has come to an end? Are those formidable profits on the verge of being vanished into thin air? Wouldn’t it be better to sell and realize profits?
Potential new investors face similar frightening questions: Getting in now? What if the all-time highs are already behind us? What if the bubble was punctured recently and is ready to burst now? What if the globalized world economies are standing on somewhat healthy feet again after the successfully passed finance, euro and Greece crises? Shouldn’t one buy when the blood flows ankle-high and sell when the corks are popping? Is the stuff with the blood already behind us or still in front of us?
Furthermore, a highly used argument against commodities is that they can bring extreme profits solely thanks to an increased volatility that is driven by short-sighted speculators, hedge funds and other kinds of grasshoppers. An increased volatility – per definition a large price range – is also valued negatively as being unpredictable like the tempers of a diva. And when comparing with other “classical investments”, the risk-reward ratio is said to be not as prettily balanced as with bonds, stocks or fixed-income securities.
However, the Yale University calculated and empirically prove that in the long run, commodities yield an average profit of 11% per year, which is about the same as for stocks. Yet the risk is significantly lower with commodities than with stocks. This study was completed in 2004, thus at a time when the commodity boom just started and the real strong price increases were to follow.
To Read More CLICK HERE

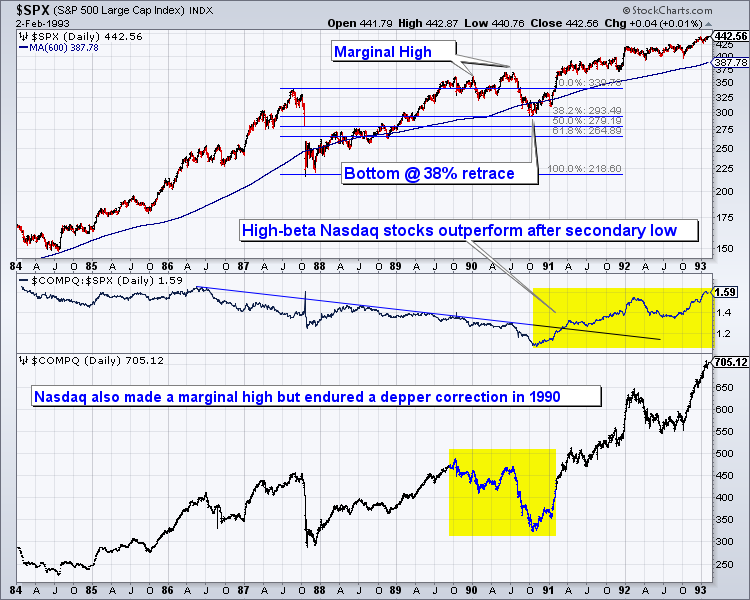
Commodities have underperformed in the past year as the US economy gained traction and the need for inflationary and stimulative measures abated, though only temporarily. At the same time, Commodities had embarked on a tremendous advance and a pullback was to be expected. Interestingly, the past can tell us something about the future path of Commodities. The resource sector has been following a very similar path as the equity market did from 1987-1991. This comparison is one of several reasons why we expect commodities will make a major low within the next few months.
In the chart below we plot the S&P 500 and the Nasdaq with the Nasdaq/S&P ratio in the middle. Both markets made marginal highs several years after the 1987 crash and both markets corrected significantly in 1990. The Nasdaq’s correction was much deeper but it soon would begin a period of strong outperformance that lasted for nine years.
To Read More CLICK HERE
Will new energy discoveries and new technology sink oil prices? Will lower oil prices rescue the world from the Great Correction?
Maybe, say Porter Stansberry and a good number of the analysts and experts here.
We’re attending an investment conference — for professionals only. It’s a beautiful place for one. The island is a barrier island, mostly sand…surrounded by ocean or marshland. There is a golf course…tennis courts…bocce courts… Maybe even a kangaroo court. Or an appeals court. And a royal court. Not to mention a food court.
The lodge looks like it was built in the ’20s…it has that glamorous look that seems to call out for a white sweater and white flannel pants… You feel you should dress like Cary Grant and hope to meet Claudette Colbert on the lawn.
The rooms are luxurious…large and quiet, while the lobby is lush with rich fabrics and comfortable chairs. The staff is poised, gracious and almost genteel. They would be good people to look after you if you were going broke or insane. Not that we’re planning on either. But it’s always a good idea to be prepared. Whether you lost your mind or your money, the nice people running the place would probably wait a few days before kicking you out.
There seems to be almost no one here. The lobby is empty most of the day. We wonder how it stays in business.
This is also where George W. Bush convened a meeting of the G7 heads of state. In the room next to ours, the walls are hung with photos of Tony Blair, Silvio Berlusconi, George W. Bush…and others.
They’re all gone from office now. Except one, Vladimir Putin, a man who looks like he might never leave.
But the news down here is upbeat. Thanks to fracking and horizontal drilling. They say these techniques are making billions of barrels of oil available. Believe it or not, the US is set to be the world’s top producer by 2020, according to a Goldman Sachs study.
An oilman from Texas showed us a map. It included a large chunk of Southwest Texas, colored to show where drillers had bought oil rights and where they were operating.
Heck, there is hardly an empty county in the whole state! The expert took the map apart, analyzing who was working where…and how much oil they were likely to get.
The results were staggering.
“Oil will fall below $40 a barrel,” predicted Porter Stansberry, our host.
Whether that will happen or not, we don’t know. But it got the group talking excitedly.
“Cheap oil will set off an industrial renaissance in America,” one suggested.
“Sell the oil and gas companies,” recommended another.
To Read More CLICK HERE

-
I know Mike is a very solid investor and respect his opinions very much. So if he says pay attention to this or that - I will.
~ Dale G.
-
I've started managing my own investments so view Michael's site as a one-stop shop from which to get information and perspectives.
~ Dave E.
-
Michael offers easy reading, honest, common sense information that anyone can use in a practical manner.
~ der_al.
-
A sane voice in a scrambled investment world.
~ Ed R.
Inside Edge Pro Contributors

Greg Weldon

Josef Schachter

Tyler Bollhorn

Ryan Irvine

Paul Beattie

Martin Straith

Patrick Ceresna

Mark Leibovit

James Thorne

Victor Adair