
Energy & Commodities
Based on the June 7th, 2012 Premium Update. Visit our archives for more gold & silver analysis.
We have all seen the newspapers headlines about the troubles in Greece, Spain, Portugal, Ireland and the entire eurozone. The situation in the U.S. is not much better, even if the press is ignoring it for the moment. In both blocks there is high debt and large, long-term entitlement programs for citizens without any clear notion of where the money to fund these programs will come from. (Hint–the printing press.)
The global economic situation is unstable and untenable. How long can citizens in the West continue to buy more and more imported manufactured goods from the East? When the West’s appetite for unessential consumer goods will lessen as people learn to do with less because they have no choice, the economic situation in China and South East Asia will be even worse than it is in the west. The West can always go back to manufacturing, but it’s unlikely that Asia can go back to agriculture.
The month of May was possibly the worst month for gold prices in three decades, but it was unexpectedly followed on Friday, June 1, by the best daily climb–$66 — since last August. The principal catalyst was the dismal US job report by the US Labor Department. Economists had hoped to hear about the creation of 150,000 positions, but the actual number was half that, 69,000, which brought on expectations of another round of QE, (that is, Quantitative Easing, not Queen Elizabeth who celebrated her 60 years Jubilee this week). It was interesting to note how the same financial media outlets that had eulogized the bull market just a week ago were now celebrating its return as a safe haven.
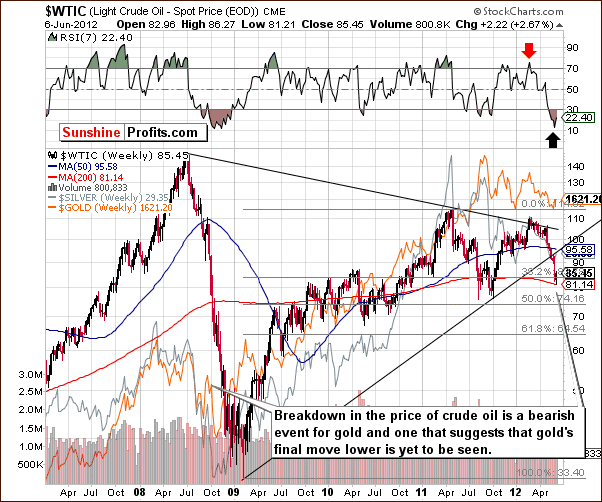
With that in mind, let’s take a look at the technical picture. Let’s begin with the analysis of the crude oil market (charts courtesy by http://stockcharts.com.)
,….read more HERE (comments & Charts on Gold

The following chart from reader Tim Wallace shows three-month usage for March, April, May compared to the same three months in prior years.

The chart shows petroleum usage is back to levels seen in 1998. Gasoline usage is back to levels seen in 2002.
This chart is consistent with reports that show petroleum usage in the eurozone is expected to fall to 1996 levels.
For more details and an analysis of tanker rates, please see Oil Tanker Rates Lowest Since 1997 as Demand in Europe Plunges to 1996 Level, Production in US at 13-Year High; IMF Smoking Happy Dope.
14-16 years of petroleum supply demand growth has vanished.
Mike “Mish” Shedlock
http://globaleconomicanalysis.blogspot.com
Click HERE To Scroll Thru My Recent Post List including Merkel Bends, Equity Markets and Precious Metals Cheer, Bond Market Yawns; Lending to Peter so Peter Can Lend to Paul


|
Most of the boom in North America’s tight oil production so far has come from the Bakken formation in North Dakota. But Texas, the biggest producer in The Union, is experiencing a huge increase—in fact, a 230-fold increase in tight oil crude output over the past three years. And it’s just getting started.
Two new tight oil plays in south Texas are attracting a lot of investor and industry attention—the Eagle Ford and the Eaglebine.
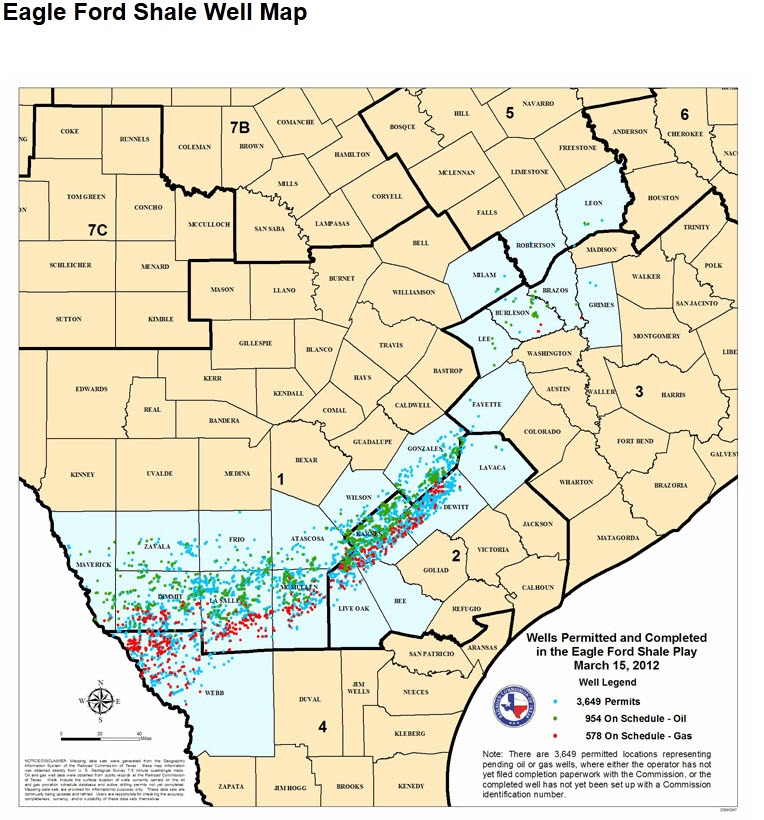
THE EAGLE FORD
The Eagle Ford has gone from obscurity in 2008 to now being the #3 play in all the United States (based on number of rigs drilling), after the Permian Basin in southwest Texas and the Bakken.
Pioneer Natural Resources (PXD-NYSE) says they get a 70% pre-tax rate of return at Eagle Ford. EOG Resources (EOG-NYSE) says it’s 80% for them.
Marathon Oil (MRO-NYSE) says it’s over 100% for them on some condensate wells (condensate is a Natural Gas Liquid that’s really more like a very light oil and often gets a better price than oil).
The formation is 400 miles long and 50 miles wide with an average thickness of 250 feet—thicker than the North Dakota Bakken. It is estimated that the Eagle Ford formation has a total recoverable resource of roughly 3 billion barrels of liquids (that’s oil and some NGLs) with a potential output of 420,000 barrels a day (bopd).
In the western part of Eagle Ford, oil is dominant with about 78% oil, 11% natural gas liquids and 11% dry gas, while the eastern part has a higher percentage of dry gas.
This high oil and liquids content (think propane that goes in your BBQ, or butane that goes into a cigarette lighter) make the Eagle Ford a very profitable play.
…read more HERE, including the list of Energy Companies operating in the Eagle Ford/Eablebine
The usual parade of clueless commentators are scrambling to explain the ongoing plunge in risk assets worldwide. One of today’s “shocker” headlines is captured in the below clip: “Crude oil futures extended declines after the U.S. Energy Department said stockpiles rose to a 22 year high”.
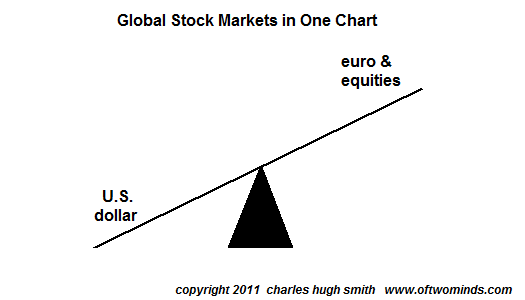
The global downturn is slowing world demand just as rising production continues to swamp the glut. (Remember all that (over) investment in the oil and commodities space during the past decade?) As Euro stress escalates and the global recession advances, the risk off teeter totter favors cash, the US dollar and treasuries over risk-credit, commodities and stocks. Remember this image to help understand present dynamics. It is precisely the pattern we have seen in previous bear markets. Ed Note: Bob Hoye also argues that in the post bubble economy “the serious money that’s still around goes to the most liquid items and that is gold, and it also is treasury bills in the worlds senior currency which is still the US Dollar.’
There is a link to a clip discussing today’s oil glut at Danielle Park’s Juggling Dynamite HERE

-
I know Mike is a very solid investor and respect his opinions very much. So if he says pay attention to this or that - I will.
~ Dale G.
-
I've started managing my own investments so view Michael's site as a one-stop shop from which to get information and perspectives.
~ Dave E.
-
Michael offers easy reading, honest, common sense information that anyone can use in a practical manner.
~ der_al.
-
A sane voice in a scrambled investment world.
~ Ed R.
Inside Edge Pro Contributors

Greg Weldon

Josef Schachter

Tyler Bollhorn

Ryan Irvine

Paul Beattie

Martin Straith

Patrick Ceresna

Mark Leibovit

James Thorne

Victor Adair