
Energy & Commodities
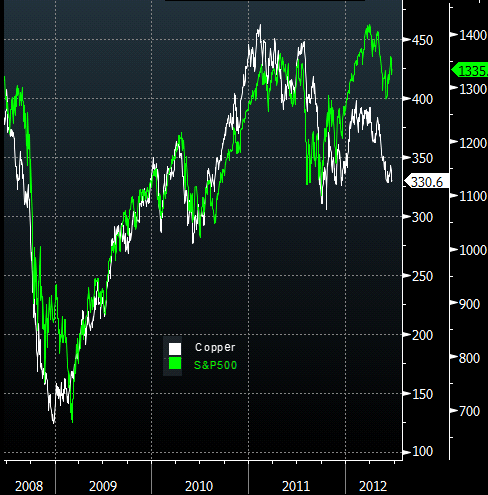
The dislocation between US equities and Brent crude (chart below and discussed there) is by no means unique. A very similar picture is developing between S&P500 and copper. And as with oil, one can blame it on supply fundamentals, but the reality has more to do with a sharp deterioration in global demand as world economies slow.
Miller Tabak : – Traders often refer to the red metal as Dr. Copper because it is the only one that has a PhD in economics, and tends to be a great leading indicator of economic conditions. If you follow that thesis, and go by recent trends, Copper could be telling an ugly story for equities.
…
Copper first bottomed in December 2008, while the S&P waited until March 2009. In 2010, Copper made its low for the year in June, vs. July for the S&P. The 2011 peak in Copper was February, vs. May for the S&P. 2012 is almost identical to last year, with Copper again topping out in Feb., while the S&P made its high in March. There are no guarantees that Copper will make a new low for the year, and even if it does that equities will follow, but it certainly bears watching given the historical significance of the relationship.
The dislocation between US equities and Brent crude (discussed here)
….more articles at Sober Look

How EWI’s Energy Specialty Service used objective analysis to anticipate the May turnaround in crude oil
One of the biggest flaws of mainstream financial analysis is that it baits traders with a specific fundamental “hook.” And once snared, they are forced to go wherever the reel draws them in, powerless to resist.
- Fibonacci-calculated price support and resistance levels on a chart
- The likely length of developing waves in relation to other waves
- And, whether the trend at hand is impulsive or corrective– as in, here to stay or not.

Let’s turn to a real-world example with the recent price action in crude oil. See, on May 2, both the mainstream experts AND EWI’s Energy Specialty Service were near-term bullish on crude oil. Herein, however, lies the difference:
- The fundamental camp presents its case with this May 2 news story: “Crude oil futures start May by bouncing to a five-week high as US manufacturing growth in April hit the highest in 10 months, boosting the demand outlook for oil.”
- That same day, May 2, EWI’s Energy Specialty Service revealed how its “preferred” bullish Elliott wave count for crude oil hinged on this crucial action: “Crude needs to continue higher to support the idea that the next leg of the advance is underway. At this point, trade below 101.82 won’t bode well for the idea that the decline from the early March peak is done… and an even longer decline would seem likely.”
Over the next few months, you’ll have a front row seat to the turning point in America’s energy independence as nearly 85 million businesses and homes have the chance to stop paying their electric bills. – NICK HODGE OF ENERGY & CAPITAL
Ed Note: Its no secret that Solar Energy is spectacularly unprofitable without massive government subsidies. Just take one look at Obama’s scandalous taxpayer investment in Solyndra that has now brought the FBI into investigate what happened with Solyndra’s, $535 million government-backed loan with the help of the Obama White House over the agressivee objections of federal budget analysts. In short, without a technological breakthrough, solar just isn’t economical withough digging into taxpayers pockets very very deeply.
Energy & Capital describes a huge technological breakthrough that is right upon us and for those in early the profits with be enormous. Though I remain cautiously sceptical with all of the boondoggles in Green Energy to date, I do think this one is worth a look – Rob Zurrer for Money Talks.
Electric Companies Are Shutting Down
Over the next few months, you’ll have a front row seat to the turning point in America’s energy independence as nearly 85 million businesses and homes have the chance to stop paying their electric bills.
This is not a revolt, organized political stand, or protest against “the corporations” — far from it, actually…
In the next few months, one of the greatest breakthroughs of the last century will hit the open market.
It will allow virtually every building in America to affordably start generating its own electricity without unsightly turbines or generators. And most importantly, without any government subsidies.
It’s all thanks to one publicly-traded tech firm that’s rapidly garnering worldwide attention.
Over the past two months alone, this company’s share price is up 44% — with near-infinite growth potential.
You don’t want to miss another point from this gem, which is why I’m giving you free access to this short presentation.
I want you to be fully informed on the situation and how to take advantage of it, come the next opening bell…
Call it like you see it,
Nick Hodge
Senior Editor, Energy and Capital
Watch the short video HERE or read Transcript HERE
This ‘Absolute Black’ Solar Panels Absorb Almost All Sunlight


In the last two months, the benchmark U.S. crude oil price has dropped more than 20%.
And it’s not done falling.
As regular Growth Stock Wire readers may remember, I began writing about a collapse of the price of crude oil back on April 4. At the time, oil prices were still up around $105 per barrel.
Back then, I noted how the huge and growing U.S. oil inventories, coupled with growing U.S. production, would cause prices to drop. Since then, the price of crude oil has fallen below $80. Last week alone, we saw prices decline 6%.
Today, I’ll show you why I think oil prices are going even lower…
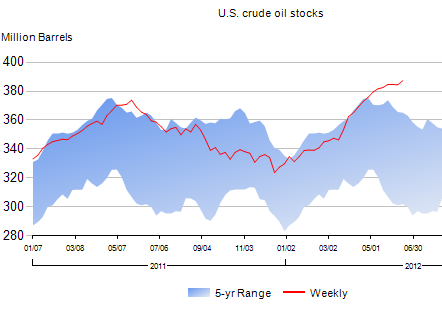
The fundamentals of supply and demand remain out of balance in the oil market. Two months ago, I showed you how much more oil we had in storage than the 10-year average. Here’s an updated chart…
You can see things have gotten even more extreme.
| One important point to note is that usually, the oil in storage is declining by June as the summer driving season kicks in.
This year, according to the Energy Information Administration’s data, the volume of oil in storage is still rising into the summer. It hit 387.3 million barrels at the end of last week. That’s 11% more than it was when we checked in April. And it’s 12% above the average for this time of year. In other words, the world’s largest oil consumer has a lot more oil around than it usually does. So supply is up, what about demand? Turns out demand is way, way down. Gasoline constitutes 42% of oil demand here in the U.S. So we can use the volume of gasoline supplied by refiners as a rough gauge. In April, which is the latest data available, we see the gasoline consumption was about 344.6 million gallons per day. That’s the lowest consumption for the month of April since 1997. Demand is not only failing to keep pace with the huge new supplies coming online… it’s actually falling. It was a recipe for lower oil prices two months ago. The same is true today. I don’t know exactly how far it could fall, but $70 or $60 is easily possible in the next six months. Good investing, Matt Badiali P.S. Yesterday, my colleague Jeff Clark showed you how oversold oil stocks are right now. He’s expecting a short-term bounce soon. He might be right. But I believe the long-term trend is still down. Unless you’re a trader, you should probably be out of oil stocks here. |
|
Energy stocks across the board have been hit hard in the last quarter—both producers and service companies. Stock charts have been laid to waste. Neither sexy resource plays nor respected leadership were enough to stem the bleeding.
But shareholders of three energy services companies—Gibsons Energy (GEI-TSX), Black Diamond Group (BDI-TSX) and Horizon North Logisitics (HNL-TSX)—are laughing all the way to the bank, as their stock charts are at or near all-time highs. (See OGIB story on Black Diamondhere.)
And strangely enough, they are all oilsands related. I say strangely because analysts have not been kind to the producers, warning investors that lower Canadian heavy oil prices could stay for a couple years, impacting profitability. And there is no close resolution on increased pipeline capacity to handle any increased oilsands production.
On the services side, Canadian securities firms like National Bank and Raymond James have been telling their clients to sell oilfield services stocks for weeks.
The first 2 oilfield services companies are Black Diamond Group (TSX-BDI) and Horizon North Logistics (TSX-HNL), which derive a substantial percentage of their revenue from business related to Alberta’s oilsands.
They provide a turnkey-style Camps and Catering service offering, including manufacturing, transportation and installation, servicing, as well as catering. These companies basically make money from renting beds to oilsands workers, including charging them for management and catering. The work camps are equivalent to small villages with a population exceeding 3,000 souls in some instances.
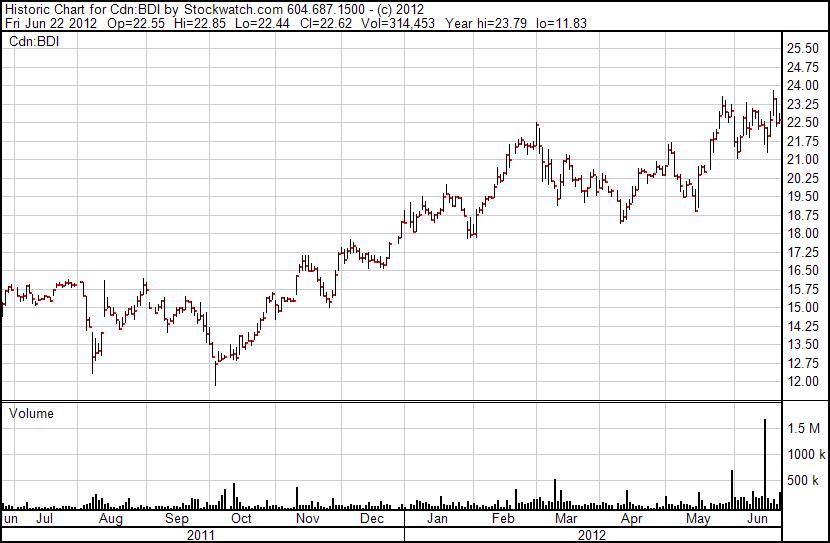
….read more and view two more charts HERE

-
I know Mike is a very solid investor and respect his opinions very much. So if he says pay attention to this or that - I will.
~ Dale G.
-
I've started managing my own investments so view Michael's site as a one-stop shop from which to get information and perspectives.
~ Dave E.
-
Michael offers easy reading, honest, common sense information that anyone can use in a practical manner.
~ der_al.
-
A sane voice in a scrambled investment world.
~ Ed R.
Inside Edge Pro Contributors

Greg Weldon

Josef Schachter

Tyler Bollhorn

Ryan Irvine

Paul Beattie

Martin Straith

Patrick Ceresna

Mark Leibovit

James Thorne

Victor Adair