

Based on the June 7th, 2012 Premium Update. Visit our archives for more gold & silver analysis.
We have all seen the newspapers headlines about the troubles in Greece, Spain, Portugal, Ireland and the entire eurozone. The situation in the U.S. is not much better, even if the press is ignoring it for the moment. In both blocks there is high debt and large, long-term entitlement programs for citizens without any clear notion of where the money to fund these programs will come from. (Hint–the printing press.)
The global economic situation is unstable and untenable. How long can citizens in the West continue to buy more and more imported manufactured goods from the East? When the West’s appetite for unessential consumer goods will lessen as people learn to do with less because they have no choice, the economic situation in China and South East Asia will be even worse than it is in the west. The West can always go back to manufacturing, but it’s unlikely that Asia can go back to agriculture.
The month of May was possibly the worst month for gold prices in three decades, but it was unexpectedly followed on Friday, June 1, by the best daily climb–$66 — since last August. The principal catalyst was the dismal US job report by the US Labor Department. Economists had hoped to hear about the creation of 150,000 positions, but the actual number was half that, 69,000, which brought on expectations of another round of QE, (that is, Quantitative Easing, not Queen Elizabeth who celebrated her 60 years Jubilee this week). It was interesting to note how the same financial media outlets that had eulogized the bull market just a week ago were now celebrating its return as a safe haven.
With that in mind, let’s take a look at the technical picture. Let’s begin with the analysis of the crude oil market (charts courtesy by http://stockcharts.com.)
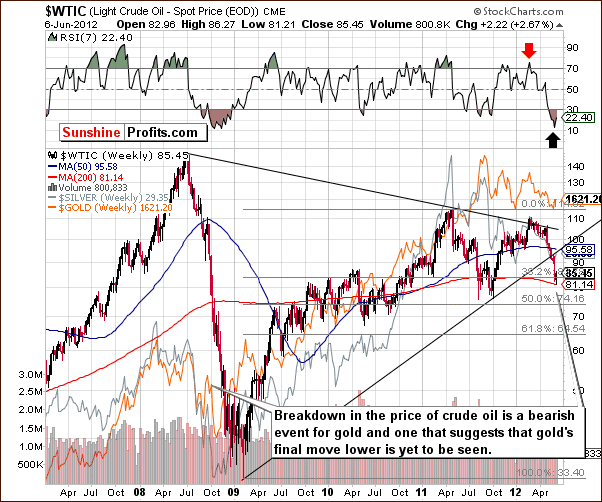
,….read more HERE (comments & Charts on Gold


