
Bonds & Interest Rates
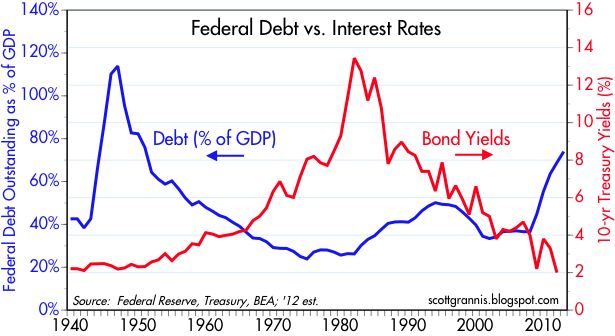
- Recent central bank behavior, including that of the U.S. Fed, provides assurances that short and intermediate yields will not change, and therefore bond prices are not likely threatened on the downside.
- Most short to intermediate Treasury yields are dangerously close to the zero-bound which imply limited potential room, if any, for price appreciation.
- We can’t put $100 trillion of credit in a system-wide mattress, but we can move in that direction by delevering and refusing to extend maturities and duration.
The transition from a levering, asset-inflating secular economy to a post bubble delevering era may be as difficult for one to imagine as our departure into the hereafter. A multitude of liability structures dependent on a certain level of nominal GDP growth require just that – nominal GDP growth with a little bit of inflation, a little bit of growth which in combination justify embedded costs of debt or liability structures that minimize the haircutting of or defaulting on prior debt commitments. Global central bank monetary policy – whether explicitly communicated or not – is now geared to keeping nominal GDP close to historical levels as is fiscal deficit spending that substitutes for a delevering private sector.
Yet the imagination and management of the transition ushers forth a plethora of disparate policy solutions. Most observers, however, would agree that monetary and fiscal excesses carry with them explicit costs. Letting your pet retriever roam the woods might do wonders for his “animal spirits,” for instance, but he could come back infested with fleas, ticks, leeches or worse. Fed Chairman Ben Bernanke, dog-lover or not, preannounced an awareness of the deleterious side effects of quantitative easing several years ago in a significant speech at Jackson Hole. Ever since, he has been open and honest about the drawbacks of a zero interest rate policy, but has plowed ahead and unleashed his “QE bowser” into the wild with the understanding that the negative consequences of not doing so would be far worse. At his November 2011 post-FOMC news briefing, for instance, he noted that “we are quite aware that very low interest rates, particularly for a protracted period, do have costs for a lot of people” – savers, pension funds, insurance companies and finance-based institutions among them. He countered though that “there is a greater good here, which is the health and recovery of the U.S. economy, and for that purpose we’ve been keeping monetary policy conditions accommodative.”
My goal in this Investment Outlook is not to pick a “doggie bone” with the Chairman. He is makin’ it up as he goes along in order to softly delever a credit-based financial system which became egregiously overlevered and assumed far too much risk long before his watch began. My intent really is to alert you, the reader, to the significant costs that may be ahead for a global economy and financial marketplace still functioning under the assumption that cheap and abundant central bank credit is always a positive dynamic.
….read the full article HERE

Analyst and author of Grant’s Interest Rate Observer offers some historical trends on interest rates, monetary policy and what is still strong in America. Here is the direct audio link.
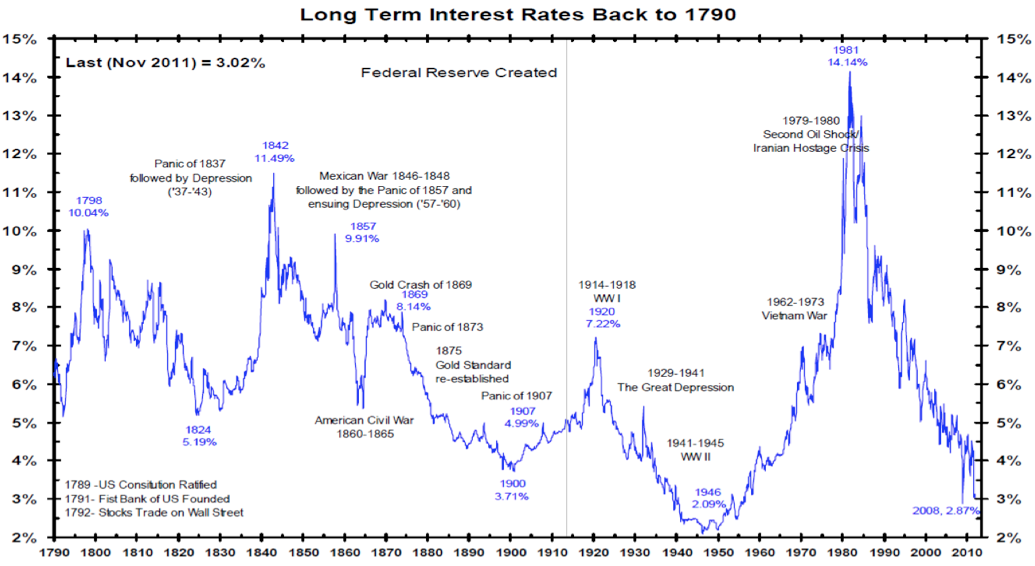
This chart since 1790 ties in nicely with discussion of the generational cycles in interest rates and underlines just how insanely low rates are today. Best advice to those still in debt: don’t use current rates to borrow more–use them to become debt free. History assures us that this-low-rate-time too shall pass. I personally look forward to the next phase where Central Banks are taken out of the driver’s seat, budgets are balanced, and markets are left to freely find fair value again. It is not a question of if–centuries of history tells us this will happen. The question is just how much mess and pain must intervene before they do.
Click on the Chart or HERE for a Larger Image
About Danielle & Juggling Dynamite:
Portfolio Manager, attorney, finance author and a regular guest on North American media, Danielle Park is the author of the best selling myth-busting book “Juggling Dynamite: An insider’s wisdom on money management, markets and wealth that lasts,” as well as a popular daily financial blog:www.jugglingdynamite.com
Danielle worked as an attorney until 1997 when she was recruited to work for an international securities firm. Becoming a Chartered Financial Analyst (CFA), she now helps to manage millions for some of North America’s wealthiest families as a Portfolio Manager and analyst at the independent investment counsel firm she co-founded Venable Park Investment Counsel Inc. www.venablepark.com. In recent years Danielle has been writing, speaking and educating industry professionals as well as investors on the risks and realities of investment behaviors.
A member of the internationally recognized CFA Institute, Toronto Society of Financial Analysts, and the Law Society of Upper Canada. Danielle is also an avid health and fitness buff.

Obama Proposes Massive Tax Hikes, Still Comes Up With $1.33 Trillion Deficit
President Obama made a pledge to cut the deficit in half by the end of his first term. Instead it exceeded a trillion dollars for four straight years.
Indeed, the president could not even make a pledge made in September to reduce the deficit to $956 billion. Finally, just to keep the deficit at $1.33 Trillion, look at the tax hikes Obama proposes.
Details below summarized from the Bloomberg article Obama Sends $3.8T Budget to Congress
Obama Proposed Tax Hikes
- Expiration of Bush-era tax cuts for couples earning $250,000 or more a year
- Limiting the value of itemized deductions to 28 percent couples earning $250,000 or more a year
- Imposing a minimum tax for individuals with annual incomes of at least $1 million
- Raise taxes on dividends received by the wealthy to 39.6 percent from the current 15 percent
- $61 billion “Financial Responsibility Fee” imposed on banks
- Increase in the terrorism-security fee charged to airline passengers
It takes all that just to hold the deficit to $1.33 Trillion. Chance of passage would appear to be about zero percent.
….read more : Republicans Miss Golden Opportunities on “Hard Choices”

So what is happening with PSI? Here is a chart of the Greek bonds due on March 20th. They have allegedly been trading up. I use the term “allegedly” because the bonds are supposedly quoted 2 to 4 points wide, on a million up. So not exactly a liquid market. But let’s assume the chart is reasonably close.
The March bonds are up a couple of points today. The May bonds trade at 33 and after that, all of the Greek bonds trade between 20 and 30, largely depending on coupon with a slight bias towards better prices for nearer term maturities.
So what is the PSI meant to do? Is the PSI meant to treat all bonds equally? If so, then it makes no sense for the March bonds to be trading at a significantly higher price. The ECB may own some of these bonds, and may be getting paid out at par, but that shouldn’t affect the price of non ECB held bonds. The payments and PSI aren’t pro-rata.
By all indications, PSI will chop the principal amount in half, and leave you with a small notional of long dated, low coupon bonds. Most estimates put the value of those long dated, low coupon bonds, between 50% and 70% of face. So the “NPV” loss shows up as around 70%. Maybe the percentage of people participating is high enough, the austerity is enough, and the EFSF kicker is enough to give the new bonds a value of closer to 90% of par, then a price of 45 for old bonds would be justified. But it would be justified for all bonds.
In the real world, bonds would exchange par plus accrued for the new bonds. So each bond would have a “claim”. So the bonds with the most accrued interest would have the most value. That is not the case here. Bonds with the shortest maturity have the most value. Is it possible that the PSI that has been cobbled together gives better payouts for bonds closer to maturity? That is possible. The IIF and Greece may have decided to pay more to shorter term bonds. It wouldn’t be standard, but on the other hand, the IIF isn’t exactly known for their bond restructuring expertise and experience.
So what else is happening here? Do investors hope to buy these bonds and guilt Greece into paying them out at par? Is the hope that the Troika will give Greece money, and Greece out of fear of default will use some of that money to pay holdouts from the PSI at par? That makes some sense, but isn’t the Troika supposed to wait for PSI before releasing money? Will they release the money if there are a lot of holdouts, particularly in this March bond?
Maybe it is simply a bet on the ineptitude of the politicians. Betting that they won’t finalize a PSI in time for the March 20th deadline, so will have to pay these off at par (remember, they just paid some bonds off at par in December). That bet also makes some sense. In “holdout” trade, you rely on Greece flinching and paying you out in spite of the message it sends to those who agreed to PSI. Under the “incompetence” trade you just need them to screw up enough that the PSI isn’t done and voted on before March 20th.
In any case, watch these short dated bonds both on an outright basis and versus the longer dated bonds. Right now, it looks like they are signaling some more monkey business coming up. Either the PSI is maturity weighted, or a decent number of investors are willing to bet that it will be profitable to holdout. Hopefully we see the PSI details soon and can make an assessment. It is possible the longer dated bonds are cheap, and I view increasing prices in the short-term bonds as signs of another round of headlines where the Troika gets mad at the private sector and it provides them with another reason to stop the bailout.
Main and IG have both drifted off their morning tights, but HY17 is still pretty much up there. Makes sense given resilience of that market. HYG caught up to HY17 on Friday and with the bounce in the actual bond market late day, actually closed “cheap” to fair value for the first time in recent memory. Given how illiquid the HY bond market is, it probably is technically still a bit rich, but worth watching this.
Read More Articles at TF Market Advisors

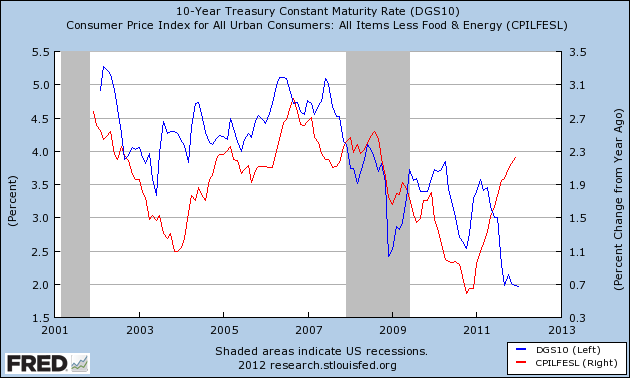
(The first powerful chart shows Interest Rates collapsing while Inflation continues to rise)
Below I show 3 charts that make the case for shorting US government bonds, specifically I’m using the 10 year Treasury. I believe that shorting US debt or 5 year+ duration is a sensible trade based on the current rate of inflation and an improving economic outlook compared to historically low Treasury yields.
1. Yields out of step with current inflation
Inflation excluding food and energy (red line – right axis) is now lower than the yield on the 10 year (blue line – left axis). Note the scales on the axis are different, but the 2 generally move together, and inflation is currently 30 bps higher than the 10 year yield. This suggests either falling inflation or an increase in yields, because it is unlikely investors will accept negative real returns on bonds for long.
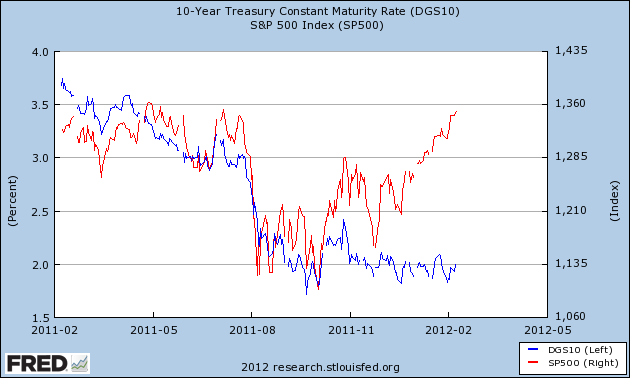
2. Disconnect between the S&P and bonds
Since late 2011, the S&P 500 (red line) has risen significantly, whereas bond yields (blue line) have remained flat. It is likely that either the stock market or bonds will decline to correct this.
3. Declining dollar may drive domestic inflation
The dollar shown below on a trade-weighted basis, is flat to declining, this matters because the exchange rate determines the relative price of domestic goods vs. imports. As the dollar falls, domestic goods become relatively cheaper, raising demand for domestic goods. More money causing the same amount of goods is generally considered inflationary. Of course, one way for the dollar to strength is for yields on US debt to rise.

A lot of this thinking is predicated on continued economic recovery through 2012 into 2013. If that were to change, perhaps if Europe’s decline deepens, many of the relationships above would unravel. I am highlighting imbalances which can be brought back into balance from either side i.e. bonds could fall OR alternatively the S&P could fall back and inflation could fall too (which is pretty much what one would expect if the economy loses steam).
In addition, the value of bonds are their diversification from equities, in shorting treasuries you are giving up that hedge and if the stock market falls, a short treasury bet would likely decline with it providing no diversification benefit. Of course, we should also not ignore the Fed and Operation Twist, which is looking to aggressively lower yields on longer term debt, however there comes a point where the Fed’s desire to lower longer term rates is overtaken by economic trends, just as the Fed cannot directly set the exchange rate.
Let me leave you with one final point, the average inflation rate in the US from 1914-2010 has been 3.4% with the current 10 year yield at 2%, we are, broadly speaking, forecasting inflation to be below average for the next 10 years. That’s not to say it can’t happen – deflation has happened before, but it’s against the run of the long-term trend.
Operationalizing the trade
This is not the easiest trade to implement and certainly not for the risk averse. Though there are plenty of inverse bond ETFs and ETNs, I am personally a little sceptical of them given short track records and relatively high fees. Personally, I prefer to short the larger more liquid bond ETFs directly, such as TLT.
Disclosure: I am short TLT.

-
I know Mike is a very solid investor and respect his opinions very much. So if he says pay attention to this or that - I will.
~ Dale G.
-
I've started managing my own investments so view Michael's site as a one-stop shop from which to get information and perspectives.
~ Dave E.
-
Michael offers easy reading, honest, common sense information that anyone can use in a practical manner.
~ der_al.
-
A sane voice in a scrambled investment world.
~ Ed R.
Inside Edge Pro Contributors

Greg Weldon

Josef Schachter

Tyler Bollhorn

Ryan Irvine

Paul Beattie

Martin Straith

Patrick Ceresna

Mark Leibovit

James Thorne

Victor Adair