
Bonds & Interest Rates
BlackRock Inc., Fidelity Investments and Charles Schwab Corp., which together manage more than $5 trillion, are all bullish on corporate debt.
The Federal Reserve’s pledge to keep interest rates at a record low through late 2014 means investors should take advantage of the extra yield, or spread, offered by asset-backed securities, commercial mortgage-backed debt and high-yield bonds in the U.S., according to BlackRock. It’s favoring securities due in five years and less, said Rick Rieder, chief investment officer for fundamental fixed-income portfolios for the company, which has $3.51 trillion in assets.
“One of the ways to take advantage of fixed income is to buy spread assets,” Rieder said yesterday in an interview from London. Yields on short- and medium-term Treasuries are “going to be very low for a long time.”
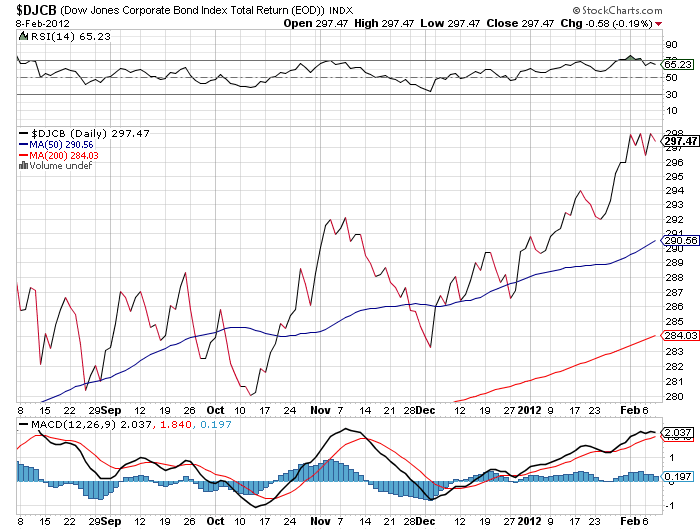
Corporate bonds (Dow Jones Corporate Bond Index chart above) are outperforming U.S. government securities this year as the world’s biggest economy shows signs of growth. Treasuries have returned 0.3 percent, versus 2.4 percent for company debt, according to Bank of America Merrill Lynch indexes.
….read more HERE


The following is part of Pivotal Events that was
published for our subscribers February 2, 2012.
SIGNS OF THE TIMES:
“Take Federal bailout money, watch your company’s stock fall 90%, become a Co-Chair of Davos”
– Bloomberg, January 20
The headline was referring to Citigroup CEO Vikram Pandit.
“Junk-bond trading volumes are rebounding to the highest levels in 11 months – optimism.”
– Bloomberg, January 27
“Societe General SA and Credit Agricole SA were among French banks to have their credit grades cut by Standard & Poors.”
– Bloomberg, January 24
“The IMF cut its forecast for the global economy as Europe slips into recession.”
– Bloomberg, January 24
* * * * *
STOCK MARKETS
The best January for the stock markets in years has restored their popularity. Bullish comments include low P/Es and attractive dividend yields as well as favourable comparisons to bond yields. Not to overlook outstanding earnings gains.
In our dispassionate approach this is considerably different to conditions in early October. Choppy action, but rising until around January was possible and couple of weeks ago we thought it could continue into February.
The February 24th ChartWorks “Complacency Abounds Oh-Oh!” outlined the probability of a top within the next four weeks.
The surge out of mid-December has been exciting enough to register some cautionary alerts and last week we were looking for some “key” technical excesses. The S&P has since reached 73.3 on the daily RSI and this compares to 70 reached with the high of 1370 at the end of April. That was on the speculative surge that out proprietary Forecaster expected to complete in that fateful April.
Stock markets are poised to roll over. If so, the latest rally is a test of the April high which we considered the cyclical best of the first bull market out of the crash.
Credit Markets
The demand for risk continues with favourable action in corporate and municipal bond markets. Yields for the Italian ten-year keep going lower and after registering scary headlines last week even the Portuguese bonds are declining in yield.
Sub-prime mortgage bonds have rallied in price from 38 in October to 51.6 – that’s up a little more than half a point from last week.
Money market stuff such as the Ted-Spread started to narrow at the end of December.
To Ross’s “Complacency Abounds” in stock market volatility we would add that it is abounding in the credit markets as well.
Fortunately, we may have an exit indicator.
The action in municipals (MUB) has been good enough to register an Upside Exhaustion. The price could roll over within a couple of weeks and the change could be part of a general reversal in risk products. This will likely show up in the reversal in the stock market VIX.
Long-dated treasuries are working on a big top. Within this the final rally has been likely to occur as the excitement in stocks and commodities fades.
This has taken the bond future from the 140 level to the 145 level. The high was 146 in December.
Currencies
Ross targeted the decline in the US dollar index to around 78.8 and so far it has bounced off this level a number of times. With this, the Canadian made it up to 103 (briefly). It is now vulnerable to a decline in commodities.
Link to February 3, 2012 ‘Bob and Phil Show’ on TalkDigitalNetwork.com:
http://talkdigitalnetwork.com/2012/02/jobs-boom-stocks-pop/
BOB HOYE, INSTITUTIONAL ADVISORS
E-MAIL bhoye.institutionaladvisors@telus.net“>bhoye.institutionaladvisors@telus.net

The people out there that believe that the U.S. economy is experiencing a permanent recovery and that very bright days are ahead for us should have their heads examined. Unfortunately, what we are going through right now is simply just a period of “hopetimism” between two financial crashes. Things may seem relatively stable right now, but it won’t last long. The truth is that the financial crisis of 2008 was just a warm up act for the economic horror show that is coming. Nothing really got fixed after the crash of 2008. We are living in the biggest debt bubble in the history of the world, and it has gotten even bigger since then. The “too big to fail” banks are larger now than they have ever been. Americans continue to run up credit card balances like there is no tomorrow. Tens of thousands of manufacturing facilities and millions of jobs continue to leave the country. We continue to consume far more than we produce and we continue to become poorer as a nation. None of the problems that caused the crisis of 2008 have been solved and we are even weaker financially than we were back then. So why in the world are so many people so optimistic about the economy right now? The Next Next Financial Crisis Will Be Devastating To The Economy
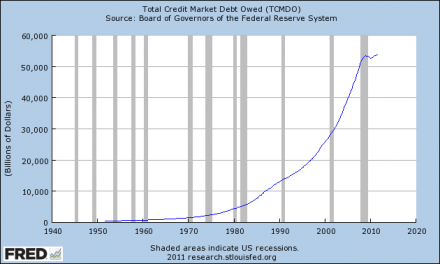
Just take a look at the chart posted below. It shows the growth of total debt in the United States. During the financial crisis of 2008 there was a little “hiccup”, but the truth is that not much deleveraging really took place at all. And since the recession “ended”, total credit market debt has gone on to even greater heights….

While the first reaction is for gold to rally and the pundits to come screaming out of the weeks yealling it’s inflationary, the harsh reality of this statement is….


-
I know Mike is a very solid investor and respect his opinions very much. So if he says pay attention to this or that - I will.
~ Dale G.
-
I've started managing my own investments so view Michael's site as a one-stop shop from which to get information and perspectives.
~ Dave E.
-
Michael offers easy reading, honest, common sense information that anyone can use in a practical manner.
~ der_al.
-
A sane voice in a scrambled investment world.
~ Ed R.
Inside Edge Pro Contributors

Greg Weldon

Josef Schachter

Tyler Bollhorn

Ryan Irvine

Paul Beattie

Martin Straith

Patrick Ceresna

Mark Leibovit

James Thorne

Victor Adair