
Daily Updates
While not being comfortable with the current gold trade, Dennis Gartman, founder of The Gartman Letter, told CNBC Monday that the price of the precious metal will “continue to go up until it stops.”
“It is a gold bubble,” Gartman told CNBC. He called the trade on gold “mind boggling,” but also said he is currently long — or betting gold will go higher”.
“Gold’s Friday low of $1,102 an ounce is the floor, according to Gartman. If it falls below that mark, he suggests investors should “head to the sidelines.”
….read more HERE.
December Gold Futures below

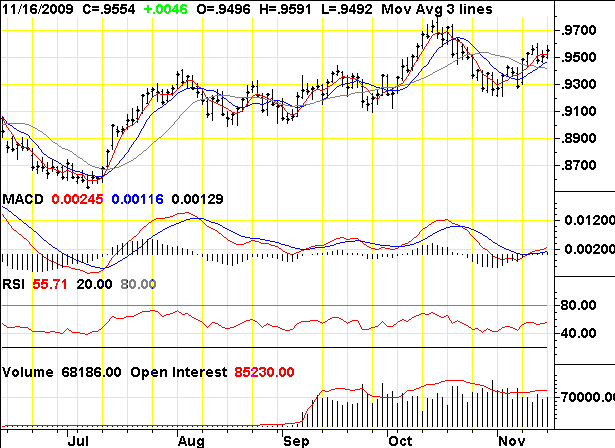
December Canadian Dollar Futures below
Dennis Gartman spoke about his very successful (and timeless )trading strategy at the Super Summitt go HERE for the Speaker Lineup and you can purchase the video HERE.

Mr. Gartman has been in the markets since August of 1974, upon finishing his graduate work from the North Carolina State University. He was an economist for Cotton, Inc. in the early 1970’s analyzing cotton supply/demand in the US textile industry. From there he went to NCNB in Charlotte, N. Carolina where he traded foreign exchange and money market instruments. In 1977, Mr. Gartman became the Chief Financial Futures Analyst for A.G. Becker & Company in Chicago, Illinois. Mr. Gartman was an independent member of the Chicago Board of Trade until 1985, trading in treasury bond, treasury note and GNMA futures contracts. In 1985, Mr. Gartman moved to Virginia to run the futures brokerage operation for the Virginia National Bank, and in 1987 Mr. Gartman began producing The Gartman Letter on a full time basis and continues to do so to this day.
Mr. Gartman has lectured on capital market creation to central banks and finance ministries around the world, and has taught classes for the Federal Reserve Bank’s School for Bank Examiners on derivatives since the early 1990’s. Mr. Gartman makes speeches on global economic and political concerns around the world.
Ed Note: If there was ever time to subscribe to Richard Russell’s Dow Theory Letters now would be that time.
Richard Russell has made his subscribers fortunes. One of the best values anywhere in the financial world at only a $300 subscription to get his DAILY report for a year. HERE to subscribe.
Richard has been Bullish Gold since below $300. He also loaded up on bonds in the early 80’s when US Treasuries where yielding 18%+. A 30 year bonds through compound interest would turn $1,000 into $300,000 at maturity. (include reinvestment of interest income, which Richard does as his view is compounding interest is the ROYAL ROAD to RICHES)

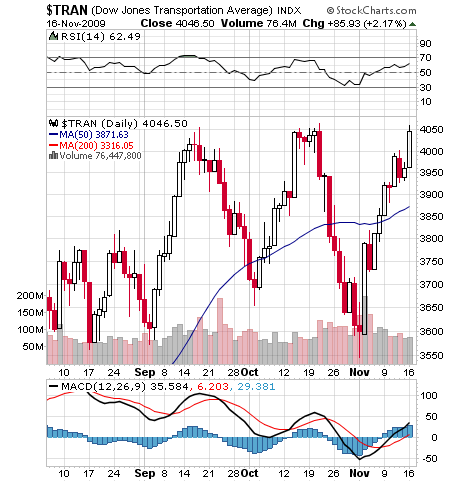
“Today the Transports finally closed above 4045.11, thereby confirming that both the secondary and primary trends of the market are bullish.”
DOW’S THEORY: From the very beginning (July 1958) I called my report Dow Theory Letters, and there are obvious reasons for that. The reasons are (1) I truly believe in the basic tenets of Dow Theory, and (2) I wanted to teach Dow Theory and I wanted to insure that the Dow Theory tenets, rules and observations were passed on to future generations.
Before I start this section let me say that there are hundreds of predictive and trend-following techniques that are now used (some very worthwhile, others less so) by market students. I follow dozens of these techniques and devices, but none of them will ever replace or negate the basic tenets of Dow Theory.
I’ve been writing these reports for 41 years and never a month goes by that someone doesn’t announce that the Dow Theory is antiquated and that it no longer works. The detractors, almost to a man, do not know their subject and have, in almost all cases, never studied Dow Theory. The Dow Theory (actually it is a set of observations) has basically to do with buying great values and selling those values when they become overpriced.
Value is the operative word in Dow Theory. All other Dow Theory considerations are secondary to the value thesis. Therefore, price action, support lines, resistance, confirmations, divergence — all are of much less importance than value considerations, although critics of the Theory seem totally unaware of that fact.
I’ve spent two-thirds of my life studying and writing about the markets. And I’d say that without a shadow of a doubt the material which has served me best are the books and papers written by the great Dow Theorists — Charles H. Dow, William P. Hamilton, Robert Rhea and E. George Schaefer.
First, let’s talk about Charles Dow, a man who, by any reckoning, must be considered a brilliant market observer and theorist. Dow started his career as an investigative reporter, specializing in business and finance. In 1885 (and few people are aware of this), Dow became a member of the New York Stock Exchange, and this provided him with an intimate knowledge of how the market works. In 1889 Dow began publishing a little newspaper which he called The Wall Street Journal. Between 1899 and 1902 Dow wrote a series of editorials for his Journal, editorials that many consider among the finest ever to come out of Wall Street. Written almost 100 years ago, these editorials are as pertinent and valuable today as they were the day they were written.
Dow was a very modest man, and although his admirers begged him to write a book explaining his theories, Dow stubbornly refused. However, Dow’s good friend, S.A. Nelson, published 15 of Dow’s Wall Street Journal editorials in a little volume entitled, “The ABC of Stock Speculation.” A footnote at the bottom of each chapter refers to the editorial as “Dow’s Theory.” But Dow himself never once used the term.
Following Dow’s death, two other men took over editorship of the Journal for brief periods. They were followed by William P. Hamilton, who was the fourth editor of the WSJ. Hamilton wrote a brilliant series of 252 editorials. These pieces appeared in the Journal between 1903 and 1929, and in Barron’s (the Journal’s sister publication) during 1922 to 1929. As time passed, Hamilton’s writing attracted a wide and devoted following. In 1926 Hamilton wrote his landmark book entitled, “The Stock Market Barometer,” in which he presented his own version of Dow Theory.
Hamilton had been Dow’s understudy at the Journal, and in his book he included much of Dow’s market observations and philosophy. But Hamilton also presented his own views on Dow Theory, and it was Hamilton who first defined the confirmation principle of the Averages. Hamilton died in 1930 soon after writing his most famous editorial, “The Turn of the Tide” (written on October 25, 1929). This fateful forecast served as the obituary for the amazing and hugely speculative 1921-’29 bull market.
The next great writer in the Dow Theory chain was Robert Rhea. Rhea was a devoted student of Hamilton’s, and Rhea adhered closely to Hamilton’s version of Dow Theory. Over a period of many years, Rhea codified and refined Dow Theory, always deferring to Hamilton in his explanations. I’ve studied every work and sentence that Rhea ever wrote, and in my opinion, Rhea was the greatest market trader of his time.
Rhea possessed a marvelous, instinctive gift for reading the Averages. He had an uncanny ability to identify and trade on the secondary as well as the primary trend of the market. Rhea was bed-ridden with TB, and he relied on his remarkable trading ability to support himself and pay his costly medical bills.
On November 12, 1932, Rhea started a stock market service which he titled, “Dow Theory Comment.” The service was successful from the start. Rhea called the exact bottom of the bear market on July 8, 1932, a feat which I consider one of the most remarkable in the history of stock market analyses. Rhea’s early letters were written during the depths of the greatest depression in American history, and you can imagine the skepticism with which his almost shocking bullish reports were greeted. Rhea also called the turn (to the downside) in the bear market of 1937, and this feat, even more than his 1932 bull market call, made Rhea a household name on Wall Street.
Sadly, Rhea’s disease took its toll. Only seven years after he started his advisory service, Rhea died (1939). Following Rhea’s death, the Dow Theory lay dormant for the many years during WWII and afterwards.
The next major figure in Dow Theory was E. George Schaefer of Indianapolis. Schaefer started his career as a stock broker with Goodbody & Co. He spent many years studying the writing of the great Dow Theorists who preceded him. But Schaefer concentrated his studies on the brilliant and seminal writings of Charles Dow. Schaefer was a firm believer in VALUES. One of Schaefer’s favorite quotes from Dow was, “An investor who will study values and market conditions, and then exercise enough patience for six men will likely make money in stocks.”
Another Dow quote used by Schaefer states, “It is always safer to assume that values determine prices in the long run. Values have nothing to do with current fluctuations. A worthless stock can go up 5 points just as easily as the best, but as a result of continuous fluctuations the good stock will gradually work up to its investment value.”
Schaefer believed that both Hamilton and Rhea placed too much emphasis on the pattern of the Averages and not enough emphasis on the principle of buying great values and holding those values throughout the life of a bull market. Schaefer wrote, “It has always been of interest to me that Hamilton and Rhea . . . both steered away from Dow’s thinking in many respects. Hamilton was very reluctant to give Dow the full credit he deserved. And Rhea, in turn, disregarded the works of Dow almost entirely and specialized in trying to improve the Hamilton version of Dow Theory.”
In 1948 Schaefer started his own advisory service which he called, “Schaefer’s Dow Theory Trader.” Schaefer’s timing was fortunate but more probably brilliant. On June 13, 1949, with the Dow at a multi-year low of 161.60, one of history’s great bull markets began. Exactly five days from that low, on June 18, 1949, Schaefer wrote what I consider an advisory masterpiece (I still have that report). In that piece Schaefer stated his reasons for believing that a great buying area was at hand and that a major bull market had begun.
In that June 18, 1949 report Schaefer wrote, “The philosophy of Charles Dow always gave first consideration to values, then to economic conditions and third to the action of both the Industrial and Rail Averages. When the low point of a bear market is reached, values will be the first indication of a change in trend. In the past 17 years only three opportunities have presented themselves to buy stocks at great values. Now the fourth opportunity is making its appearance.”
Schaefer’s June ’49 forecast turned out to be uncannily accurate. In June the Dow turned up from its 161.60 low, and a great bull market began. Schaefer stayed with the bull market through thick and thin until 1966. On February 9, 1966, 17 years later, the Dow topped out at a value of 995.15. Those who followed Schaefer’s Dow Theory interpretations and investment procedures (i.e., those who held their stocks throughout the bull market as Schaefer repeatedly advised) made fortunes.
One of the reasons Schaefer started his advisory service was to present what he terms his “New Dow Theory,” a set of principles which he insisted “could be applied profitably to present-day markets.” Schaefer wrote in 1960, “A study of the Averages themselves can be highly rewarding. But in my opinion, a forecast based on past movements of the Averages cannot be conclusive. Predictions of events to come are more reliable if they can be reinforced by analysis of other technical and more conclusive factors.”
What were the “other factors” which Schaefer referred to? Some of them were values (and again I emphasize values), the 200-day moving average of the Dow, the short interest ratio, the advances and declines, Dow’s 50% Principle, market sentiment, market phases, and the yield cycle. Remember, prior to Schaefer, orthodox Dow Theorists tended to avoid all “extraneous” items other than the pattern of the Averages and volume, claiming that other items only interfered with pure, basic, Dow Theory studies. Schaefer disagreed vehemently.
Schaefer possessed great market intuition, and he used his market instincts plus his new tools to ride the great 1949-’66 bull market all the way from the bottom in 1949 to the top in 1966. Through reactions, corrections, panics and dips, Schaefer insisted that his subscribers hold their shares and buy more during all periods of weakness.
That may sound easy, but believe me it is not. The number of people who hold stocks from the beginning to the end of a bull market can probably be counted in the hundreds. In early-1966, Schaefer turned bearish on the market (based on third phase considerations and overvaluation of stocks), and he advised his followers to “sell out.” Schaefer remained bearish until the time of his tragic and untimely death (suicide) in 1974.
Although Hamilton and Rhea took careful note of the secondary reactions in bull and bear markets, Schaefer advised his subscribers to ignore these “temporary reactions,” and to remain invested in harmony with the primary trend of the market. In his historic report of June 18, 1949, Schaefer wrote, “Once stocks are purchased, both the minor and secondary movements in the market should be completely disregarded. A new period of prosperity will follow, once the present recession has run its full course.” We now know how prophetic those words were (words which were written during a time of extreme fear and gloom) .
Later Schaefer wrote, “So far as I can ascertain from his original writings, Dow had an open mind, and there was a great deal of flexibility in his thinking regarding the price movements.”
The following is extremely important, and subscribers should take careful note of this: Schaefer believed that mass emotions were changing the character of the stock market. He realized that Wall Street was gathering a much larger following year after year, and that the American public was becoming much more involved with investments (today, of course, Wall Street has gone both electronic and global). This relatively new phenomenon of mass emotions, Schaefer believed, had to be taken into consideration as far as classic Dow Theory was concerned.
Wrote Schaefer, “My new Dow Theory involves a broad, balanced manner of thinking about the market and your own emotions. It is a far cry from the narrow ‘system’ that places a complete reliance upon what the Averages do. Yes, we who study the new Dow Theory watch the Averages. But along with any such observations we realize and understand that the market is composed of people of all types, and that all people are born emotional.”
So what was the result of Schaefer’s emphasis on the emotions of an enormous and growing investment public? It was this — Schaefer allowed for secondary reactions to far overshoot the restrictions which were laid out by orthodox Dow Theory. Years earlier Rhea had written that in a bull market, secondary reactions tend to retrace one-third to two-thirds of the preceding uncorrected primary advance while tending to last three weeks to three months.
Schaefer dismissed Rhea’s “out-dated concepts.” Schaefer believed that mass psychology and the intense emotions of the public could take the Averages well beyond the “normal bounds” outlined by Hamilton and Rhea. Wrote Schaefer, “Today our new Dow Theory allows the crowd to get as emotional in its selling or buying as it will — with no restrictions whatever on the duration or extent of the secondary or intermediate trend. In primary bull markets, when things get scary, we simply wait for the fearful to sell out, and then we assume that the main primary trend will resume as expected. In primary bear markets, just the opposite is true.”
This “new Dow Theory” thinking proved extremely valuable in late-1957 when a severe secondary reaction hit Wall Street. When the Averages broke through their preceding secondary lows, many orthodox Dow Theorists, who relied almost totally (as most do today) on the pattern of the Averages, proclaimed that a bear market had started. These bears ignored such critical factors as the phases, length of the bull market, values, Dow yield, etc.
Schaefer differed totally (as I did in 1957) with the prevailing Wall Street opinion. Both of us insisted that the bull market had not yet experienced a classic speculative third phase and that the late-1957 cave-in was not a bear market but a severe secondary reaction. We held that the reaction had been intensified by extraordinary public fear, fear that was triggered by the violent breakdown in the Averages.
In fact, I was so certain during 1957-’58 that we were witnessing a bull market correction rather than a primary bear market that I started Dow Theory Letters at that time. Furthermore, in December 1958, I wrote my first article for Barron’s (entitled “Dow Theory Revisited”). That Barron’s article drew a tremendous response and was instrumental in putting me in business (in the years that followed I wrote about 30 additional articles for Barron’s).
Basic to both Schaefer’s and my thinking during 1957-’58 was the fact that we had not yet experienced a bull market third speculative phase. Also, during the drastic 1957 decline the 50% Principle remained bullish.
Let me explain because this is important. The Dow had risen from a 1953 low of 255.49 to a record high in 1956 of 521.05. The halfway or 50% level of that three-year rise was 388.27. On the vicious 1957 decline the Dow collapsed to a low of 419.79, a level which was well above the 388.27 or the 50% level of its preceding rise. The fact that on the decline the Dow could retain better than half the gains of the 1953-’56 rise was a powerful bull argument, particularly since this phenomenon occurred in the face of such universally black pessimism (by the way, I have never, before or since, seen gloom to match that which existed during the 1957-’58 recession and market collapse).
Back to George Schaefer. Schaefer used the 200-day moving average of the Dow to advantage in his work. But he warned “that as with other technical studies, the 200-day moving average should never be considered alone. My experience has been that interpretations under the 200-day moving average rule must always be correlated with other studies.”
The experience during the 1949-’66 bull market served me well. The 200-day MA turned down in 1953 (during a secondary correction), and it turned down again in 1956 (during another secondary). Neither of these downturns in the MA indicated that the primary trend of the market had turned bearish, and each of the downturns in the MA was followed by a major rise as the bull market reasserted itself. Thus, those who say that the direction of the 200-day MA identifies the direction of the primary trend would do well to study history. But Schaefer noted, “the 200-day MA should never be used alone and to do so can cause expensive mistakes.”
I wrote the foregoing because I wanted to give subscribers an accurate (even though brief) view of Dow Theory and its evolution over the past 90 years. Few, very few, market practitioners have ever made a serious study of Dow’s Theory, although many analysts mouth meaningless Dow Theory platitudes. I know of only a handful of people who have ever read the works of Dow, Rhea, Hamilton or Schaefer. Yet, the Dow Theory remains the basis of all technical analysis. The Theory also constitutes the basis for much intelligent and profitable investing. I have shown how the Theory has evolved through the years. I have also attempted to show how the Theory has been improved with each Dow Theorist and how each practitioner has worked with the Theory and applied it to the particular markets of his time.
I’ve tried to carry on the work of Dow, Hamilton, Rhea and Schaefer. I believe, however, that the stock market is far more difficult today than ever before, mainly because so many analysts, professionals, money managers, arbitrageurs, speculators and serious individuals are involved, and competing for profits (and increasingly, for short term and even intra-day profits). Furthermore, trading has been speeded up and broadened tremendously through the use of computers and the Internet. Finally, the arrival on the scene of “derivatives,” options, futures, puts, calls, etc., makes the market game bigger, faster, more manipulative, more hazardous — and far more deceptive than ever before.
In the end, however, the “hidden ingredient” for market success is the practitioner’s own instincts or intuition. Market analysis, as some many have observed, is an art, not a science.
I guess every Dow Theorist (and every market practitioner) has added or latched on to a few devices which he feels will help him with his market studies. I’ve developed my Primary Trend Index. This composite Index has been a huge help to me in my own trading. As a matter of fact, many of my own subscribers base their market position strictly on the trend of the PTI.
The 84 yr. old writes a market comment daily since the internet age began. In recent years, he began strongly advocated buying gold coins in the late 1990’s below $300. His position before the recent crash was cash and gold. There is little in markets he has not seen. Mr. Russell gained wide recognition via a series of over 30 Dow Theory and technical articles that he wrote for Barron’s during the late-’50s through the ’90s. Russell was the first (in 1960) to recommend gold stocks. He called the top of the 1949-’66 bull market. And almost to the day he called the bottom of the great 1972-’74 bear market, and the beginning of the great bull market which started in December 1974.

Ed Note: Below is a small excerpt from Mark Leibovit’s 10 page The VR Gold Letter . The VR Letter is published WEEKLY and Mark Leibvit has been the Awarded #1 Gold Timer by Timers Digest in 2007, 2008 and is in postition to win 2009 with his fine Gold forecasts throughout the year so far including Gold zooming to another new High of $1,131 in tonights overnight trading. Money Talks highly recommends subscribing to Mark’s Gold Letter.
The disbelief in Gold is known by a phrase that was made famous by one of Wall Street’s icons, Joseph Granville in the 1970s and 1980s. It is called the ‘Wall of Worry’. Bad news, disbelief, and indifference to an advancing market reconfirms the legitimacy of that advance. The more the better and, boy, are we seeing it today! The financial press only devotes minimal coverage to the advance in Gold and the average person in the street I talked you still looks at me in disbelief or even disdain thinking I am some form of fanatic. Mark my words. When folks are standing in line waiting to buy Gold at $5000 or more an ounce (obviously fractional pieces of Gold at that time) the way they were standing in line to buy condominiums in Scottsdale Phoenix a few years ago – then and only then we will mark a top in this market. In my opinion, the $1000 level is now the floor just as was 1000 in the Dow Industrials when we barreled through it back in 1982. As I’ve said, the party has only begun.
Gold up $23.30 from Friday to NEW HIGH of $1140 (Dec. Futures) in electronic trading (30 minute chart)
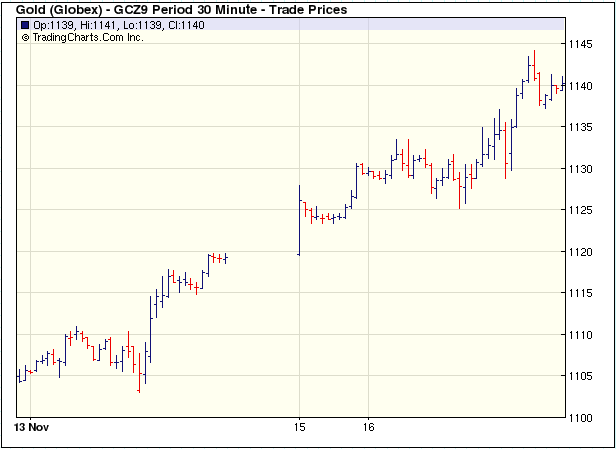
The Annual Forecast Model still shows further life to this market for the balance of 2009, so since it has been working so well to date, I am going to give it the benefit of the doubt. I hope to have the 2010 Annual Forecast Model completed in mid January, so stay tuned. Short-term, the Gold market could be quite explosive here. It could very well accelerate to the upside!
Gold Monday Daily close up $15.40 to new high from Friday Nov. 13
I have been told the feedback from “The MoneyTalks Allstar Trading Super Summit” in Vancouver on October 24 was excellent and my presentation very popular.
A the video of the conference is now available for purchase. A special promotion code has been created for VRtrader.com clients. Using this code you can get a 50% discount on the $117 price. The StockScores promotion code is – S2009ML
Folks just go to www.moneytalks.net , Click on the Banner box titled “The MoneyTalks Allstar Trading Super Summit Video“. This will take them to the shopping cart where the process is pretty straightforward.
Enjoy!

The weekly VR Gold Letter focuses on Gold and Gold shares. The letter is available to Platinum subscribers for only an additional $50 per month and to Silver subscribers for only $70 per month. Email me at mark.vrtrader@gmail.com.
Marks VRTrader Silver Newletter covers Stock, TSE Stocks, Bonds, Gold, Base Metals, Uranium, Oil and the US Dollar.
More kudos – Mark Leibovit was named the #1 Intermediate Market Timer for the 10 year period ending in 2007; the #1 Intermediate Market Timer for the 3 year period ending in 2007; the #1 Intermediate Market Timer for the 8 year period ending in 2007; and the #8 Intermediate Market Timer for the 5 year period ending in 2007. NO OTHER ANALYST SURVEYED APPEARED IN ALL FOUR CATEGORIES FOR INTERMEDIATE MARKET TIMING AS PUBLISHED IN TIMER DIGEST JANUARY 28, 2008!
For a trial Subscription of The VR Silver Newsletter covering Stocks, Bonds, Gold, US Dollar, Oil CLICK HERE
The VR Gold Letter is available to Platinum subscribers for only an additional $20 per month, while for Silver subscribers the price is only an additional $70.00 per month. Prices are going up very shortl, so act now! Separately, the VR Gold Letter retails for $1500 a year! The VR Gold Letter is published WEEKLY. It is 10 to 16 pages jam-packed with commentary and charts. Please call or email us right away. Tel: 928-282-1275. Email: mark.vrtrader@gmail.com .
Editor Note: Money Talks highly recommends that you make a regular trip to this monday morning site to this Don Vailoux monday report where he analyses an astonishing 48 Stocks, Commodities and Index charts and, provides a “Bottom Line” and some very interesting comment.
Economic News This Week
U.S. economic data is starting to show signs of a stall in economic recovery.
October Retail Sales to be released at 8:30 AM EST on Monday are expected to increase 0.9% versus -1.5% in September. Ex autos, Retail Sales are expected to increase by 0.4% versus 0.5% in September.
The November Empire State Index to be released at 8:30 AM EST on Monday is expected to decline to 29.00 from 34.57 in October.
September Business Inventories to be released at 10:00 AM EST on Monday is expected to decline by 0.6% versus a decline of 1.5% in August.
October Producer Prices to be released at 8:30 AM EST on Tuesday are expected to increase 0.5% versus -0.6% in September. Core PPI is expected to increase 0.1% versus an increase of 0.2% in September.
October Capacity Utilization to be released at 9:15 AM EST on Tuesday is expected to increase to 70.8% from 70.5% in September.
October Consumer Prices to be released at 8:30 AM EST on Wednesday are expected to increase by 0.2% versus 0.2% in September. Core CPI is expected to increase by 0.1% versus 0.2% in September.
October Leading Indicators to be released at 10:00 AM EST on Thursday are expected to rise by 0.4% versus an increase of 1.0% in September.
November Philadelphia Fed to be released at 10:00 AM EST on Thursday is expected to slip to 10.8 from 11.5 in October.
Equity Index Trends
The ratio of S&P 500 stocks in an uptrend to a downtrend (i.e. the Up/Down ratio) rose last week from 2.01 to (296/122=) 2.43. Number of S&P 500 stocks in an uptrend increased by 18. Number of stocks in a downtrend fell by 16. The ratio remains intermediate overbought, but is moving higher.
Bullish Percent Index for S&P 500 stocks increased last week from 73.20% to 76.60%. On Friday it moved above its 15 day moving average, a mildly encouraging technical event. The Index remains intermediate overbought.
Ed Note: Five interesting Charts of a total of 48 in today’s excellent analysis. Click HERE to go right away where the entire 48 plus analysis including the “Bottom Line……… and more.
The S&P 500 Index added 24.18 points (2.26%) last week. Intermediate trend remains up. The Index briefly moved above resistance at 1,101.36. It remains above its 50 and 200 day moving averages. Short term momentum indicators (MACD, RSI and Stochastics) continue to trend higher. Stochastics already have reached an overbought level. Seasonal influences are positive. Intermediate upside potential based on the move above resistance is to 1,180.
The TSX Composite Index added another 157.26 points (1.40%) last week. Intermediate trend remains down. Resistance remains at 11,648.55 set eight weeks ago. The Index remains above its 50 and 200 day moving averages Short term momentum indicators are trending higher. Stochastics already are overbought. Strength relative to the S&P 500 Index remains negative. Seasonal influences are positive. A move above resistance will change the trend from down to up. Intermediate upside potential is to 12,600 following a breakout.
The U.S. Dollar slipped another 0.53 last week, but showed signs of a short term recovery late in the week. Intermediate trend remains down. Short term momentum indicators are recovering from oversold levels with Stochastics showing early signs of bottoming. A short term recovery this week is possible, but resistance at its 50 day moving average has been consistent during the past six months and is likely to persist. The reasons for the intermediate downtrend remain: U.S. economic recovery currently is fragile at best and is almost entirely dependent on U.S. government spending at an unsustainable level.
The Canadian Dollar rose 2.06 cents U.S. last week. Intermediate trend remains up. Short term momentum indicators are trending higher. Stochastics already are overbought. The Canuck Buck remains in a two month trading range between 92.16 to 97.69 cents U.S.
Crude oil also was virtually unchanged last week. Resistance is at $82.00. Short term momentum indicators are trending lower from overbought levels.
Gold added another 24.00 U.S. per ounce last week and quickly exceeded its intermediate upside technical target of 1,117 U.S. Short term momentum indicators are overbought, but continue to trend higher. A retreat to the top of its previous trading range at $1,070.70 is possible if the U.S. Dollar briefly strengthens this week.
The yield on 10 year U.S. Treasuries slipped 0.11% last week. The market successfully absorbed several large issues released during the week. Yield remains locked in a six month trading range between 3.21% and 3.98%.
Ed Note: If you haven’t already clicked a link to this report and analysis of 48 charts, and read the Don’s “Bottom Line” go HERE and scroll to near the bottom of the report.
Don Vialoux has 37 years of experience in the Investment Industry. He is a past president of the Canadian Society of Technical Analysts (www.csta.org) and a former technical analyst at RBC Investments. Now he is the author of a daily letter on equity markets available free on the internet. The reports can be accessed daily right here at www.dvtechtalk.com.
Impossible! That’s what institutional investors say about “Timing the Market”. Mr. Vialoux will explain that, indeed, it can be done with the appropriate analysis. He also will explain why timing the market will be important during the next decade. Buy and Hold strategies are not working anymore; Investors are looking for alternatives. Mr. Vialoux will demonstrate four techniques that can be used to time intermediate stock market swings lasting 5-15 months. The preferred investment vehicles for investing in intermediate stock market swings are Exchange Traded Funds.
Comments in Tech Talk reports are the opinion of Mr. Vialoux. They are based on technical, fundamental and/or seasonal data that is believed to be accurate. The comments are free. Mr. Vialoux receives no remuneration from any source for these services. Comments should not be considered as advice to buy or to sell a security. Investors, who respond to comments in Tech Talk, are financially responsible for their own transactions.
-
I know Mike is a very solid investor and respect his opinions very much. So if he says pay attention to this or that - I will.
~ Dale G.
-
I've started managing my own investments so view Michael's site as a one-stop shop from which to get information and perspectives.
~ Dave E.
-
Michael offers easy reading, honest, common sense information that anyone can use in a practical manner.
~ der_al.
-
A sane voice in a scrambled investment world.
~ Ed R.
Inside Edge Pro Contributors

Greg Weldon

Josef Schachter

Tyler Bollhorn

Ryan Irvine

Paul Beattie

Martin Straith

Patrick Ceresna

Mark Leibovit

James Thorne

Victor Adair