
Daily Updates
11/14/09 Rome, Italy – Dave Rosenberg says the unemployment rate is headed to 12-13%. And then, it’s going to stick at more than 10% for a long time.
“Think about it. We haven’t yet hit bottom on employment but that will happen at some point. Employment is not going to zero, of that we can assure you. But when we do start to see the economic clouds part in a more decisive fashion, what are employers likely to do first? Well, naturally they will begin to boost the workweek and just getting back to pre-recession levels would be the same as hiring more than two million people. Then there are the record number of people who got furloughed into part-time work and again, they total over nine million, and these folks are not counted as unemployed even if they are working considerably fewer days than they were before the credit crunch began.
“So the business sector has a vast pool of resources to draw from before they start tapping into the ranks of the unemployed or the typical 100,000-125,000 new entrants into the labour force when the economy turns the corner. Hence the unemployment rate is going to very likely be making new highs long after the recession is over – perhaps even years.”
Like we keep saying…get ready for a long, Japan-like slump.
But here’s a headline that offers hope for a brighter future:
“Unions prod Obama to fix ailing airline industry”
On the surface of it, the idea is absurd. What does Obama know about airplanes? Who would want to fly in an airplane with Obama in the pilot seat? But the headline reveals today’s most popular delusion…….
…….read more HERE.
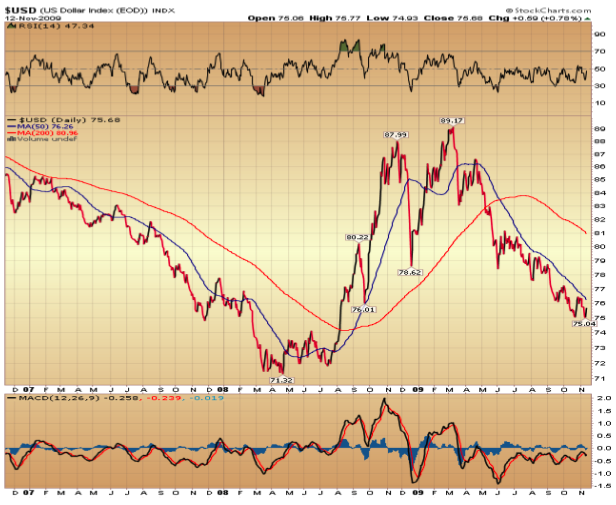
It’s Friday the 13th. Think I’ll stay home today. So must the dollar. No matter how much competitive valuation pressure we hear the dollar wants to fall. Tuesday, China said, somewhat begrudgingly, that she would allow the Yuan to rise. As you know the Yuan is now pegged to the US currency. This was probably in response to pressure from China’s Asian neighbours (Thou Shalt Not Beggar Thy Neighbour). The Euro Union leaders have also felt the pain of a jointly weaker dollar and Yuan. Time will tell if the Chinese are serious about the floating the Yuan. Today once again the dollar is weaker – across the board. This is good for Dennis Gartman’s “things that hurt when they fall on your feet.”
…..read more HERE.
Richard Russell has made his subscribers fortunes. One of the best values anywhere in the financial world at only a $300 subscription to get his report daily for a year. HERE to subscribe.
Richard has been Bullish Gold since below $300. also loaded up on bonds in the early 80’s when US Treasuries where yielding 18%+. Some of those bonds haven’t even matured in 2011 as they were 30 year bonds. Rough compound interest would turn $1,000 into $311,367at maturity. (include reinvestment of interest income once annually which Richard does as his view is compounding interest is the ROYAL ROAD to RICHES)
There are a number of items favoring higher gold now.
(1) Interest rates are at zero, which means the “opportunity cost” of owning gold now is highly favorable. You sacrifice no yield in owning gold vs. Treasury bills. T-bills pay you nothing, so you might as well have your money in gold.
(2) The Bernanke Fed will evidently stop at nothing in its all-out attempt to “jump start” the wobbly US economy. This means spending and building debt at a never-seen-before rate. This will result in inflation. The Fed can create fiat money — any quantity at will, but it cannot direct where that money will go. So far, the money is not going into the economy, banks remain reluctant to lend and consumers are reluctant to spend. The newly-created money has been going into bank reserves and into the stock market. Stocks have been rising on an ocean of liquidity. The sinking dollar has been a huge help to the big Dow-type stocks which benefit from their ability to export. This is resulting in world-wide central bank inflation as the banks seek to devalue their money in an effort to keep the dollar strong.
(3) The world’s central banks are now seeking to protect themselves from a falling dollar by buying gold. After years of selling gold, ironically, the central banks are now buying gold. In today’s WSJ we see the headline, “Central Banks Join A New Gold Rush.” Russell Comment — This is indeed ironic. In swapping their own paper for gold, many central banks are admitting that gold is superior to the very paper they are creating out of thin air.
(4) Many nations are now seeking to boost the ratio of gold to paper in their reserves. The US has the largest ratio of gold to junk fiat paper, 77.4%. But the US stupidly only places the value of our gold at $42.22 an ounce. If the US marked our gold to market, it would be a tremendous help to our government’s balance sheet. But the US prefers to live in a fantasy world where gold is worth less than $50 an ounce!
Germany has 69.2% of its reserves in gold.
Italy has 66.6%.
France has 70.6%.
UK has 17.6% (after idiotically selling most of its gold near the low below $300 an ounce).
Japan has 2.3% of its reserves in gold.
India has 4.0%.
Russia has 4.3%.
China has 1.9%.
It’s easy to see that Russia, India and China are low on gold. All three would like to at least double the percentage of gold in their reserves. The race is on for these central banks to accumulate gold without running the price of gold sky-high.
(5) In the US, literally no one owns gold. Rather US citizens are selling their gold (jewelry) to companies who are advertising that they’ll buy “your overpriced” gold for cash.
(6) A few nations are actively promoting the ownership of gold. China, the world’s biggest miner of gold, has been encouraging its people to buy gold. In London, Harrod’s department store is now selling gold coins and bars to anyone who has the paper to buy gold. Within a year or so, I expect public buying of gold to reach a crescendo. Interestingly, most Americans have never seen a gold coin.
The 84 yr. old writes a market comment daily since the internet age began. In recent years, he began strongly advocated buying gold coins in the late 1990’s below $300. His position before the recent crash was cash and gold. Richard and his subscribers also loaded up on Treasury bond @ 18% in the early 80’s when US Treasuries where yielding 18%+. Some of those bonds haven’t even matured in 2011 as they were 30 year bonds. Rough compound interest would turn $1,000 into $311,367at maturity. (include reinvestment of interest income once annually which Richard does). Wow, no wonder RR say’s compounding is the ROYAL ROAD to RICHES) There is little in markets he has not seen. Mr. Russell gained wide recognition via a series of over 30 Dow Theory and technical articles that he wrote for Barron’s during the late-’50s through the ’90s. Russell was the first (in 1960) to recommend gold stocks. He called the top of the 1949-’66 bull market. And almost to the day he called the bottom of the great 1972-’74 bear market, and the beginning of the great bull market which started in December 1974.
Quotable
“QE created a surge in excess reserves: In September 2008, central banks opened up liquidity facilities to alleviate the stress from frozen fixed income markets. These operations resulted in the build-up of ‘excess reserves’ (ER) and an expansion in central banks’ balance sheets. In the past, such a build-up in ER would have been ‘sterilised’ by central banks by selling government securities. This time around, however, that was not done for two reasons. First, we have argued that central banks have pursued QE with the intention of increasing the growth of money, given near-zero policy rates, while more ER would push overnight rates lower. Second, the sheer size of the increase in ER relative to the size of government securities held by or available to the Fed that could be used to drain reserves was at least partly responsible for central banks not being able to drain excess reserves (see Keister & McAndrews (2009), Haubrich & Lindner (2009)). Under these extenuating circumstances, the Fed even turned to the Treasury for assistance and the Supplemental Financing Program was created to help drain ER (see Appendix for details on how the SFP worked and how its wind-down will push up excess reserves).
But why have excess reserves stayed so high? Could be a supply-side issue… Tautologically, commercial banks are holding on to excess reserves because they cannot put the funds to better use. However, this does not help us in identifying whether supply or demand is the source of the problem. While reserves may be higher than required by regulators, banks may not consider them ‘excessive’ in an economic sense, as argued by Friedman and Schwartz (1963). Commercial banks could be hoarding this cash with a ‘precautionary motive’, much as consumers increase savings when uncertainty around their income stream increases. This would be a problem on the supply side of the loanable funds market.” – Manoj Pradhan
FX Trading – Video Edit: The Global Stimulus and Emerging Markets Show
REWIND:
The latest G-20 communiqué said nothing new. You know … where the leaders told us they’re not yet ready to rein in the stimulus they’ve provided to their respective economies.
FAST-FORWARD:
Dominique Strauss-Kahn, head of the International Monetary Fund, is spewing all kinds of commentary this morning.
On one hand, he’s affirming the position taken by the G-20 to remain supportive till a legitimate recovery ensues.
On the other hand he’s stressing the fact that there should be a coordinated effort to peel back stimulus amidst a firm recovery.
….read more HERE.
The Dow made another record high Wednesday as it moved further above the 10,000 level. To provide some perspective to the current Dow rally that began back in March, all major market rallies of the last 109 years are plotted on today’s chart. Each dot represents a major stock market rally as measured by the Dow. As today’s chart illustrates, the Dow has begun a major rally 27 times over the past 109 years which equates to an average of one rally every four years. Also, most major rallies (73%) resulted in a gain of between 30% and 150% (29.8% to 150.5% to be exact) and lasted between 200 and 800 trading days (9.5 months to 3.2 years) — highlighted in today’s chart with a light blue shaded box. As it stands right now, the current Dow rally (hollow blue dot labeled you are here) would be classified as both short in duration and below average in magnitude.
Notes:
– Where’s the market headed? The answer may surprise you. Find out right now with the exclusive & Barron’s recommended charts of Chart of the Day Plus
Sign up for the FREE ChartoftheDay HERE. .
-
I know Mike is a very solid investor and respect his opinions very much. So if he says pay attention to this or that - I will.
~ Dale G.
-
I've started managing my own investments so view Michael's site as a one-stop shop from which to get information and perspectives.
~ Dave E.
-
Michael offers easy reading, honest, common sense information that anyone can use in a practical manner.
~ der_al.
-
A sane voice in a scrambled investment world.
~ Ed R.
Inside Edge Pro Contributors

Greg Weldon

Josef Schachter

Tyler Bollhorn

Ryan Irvine

Paul Beattie

Martin Straith

Patrick Ceresna

Mark Leibovit

James Thorne

Victor Adair