
Daily Updates
WHEN BRILLIANCE MAKES ITS WAY TO CENTRE STAGE: We have the great good fortune to count Zack Karabell as a good friend, and we say this because he is not only a fine economist, but Zack has the mind of a trader. He sees things from an economic perspective, but leavened with tempering of the heat of a trading environment. Thus, when Zack writes, we read, and he wrote a piece in The Wall Street Journal yesterday that is more than worthy of everyone’s time; it is worthy of consideration by our friends, our clients, and even the political figures of the day. Zack wrote:
The ‘Global Imbalances’ Myth
Different countries have always played different roles in the world economy
As the economic crisis has eased in recent months, a questionable international consensus has emerged: The global economy needs to be rebalanced. “We cannot follow the same policies that led to such imbalanced growth,” President Barack Obama said during his Asia trip last month. European Central Bank head Jean-Claude Trichet declared in September that “imbalances have been at the roots of the present difficulties. If we don’t correct them, we’ll have the recipe for the next major crisis.”
These global “imbalances” supposedly include excessive American consumption, too much trade flowing from Asia to the West and not enough from the bU.S. to Asia, and too much saving combined with insufficient spending by Chinese consumers.
But what if the whole notion of global imbalances is a myth, and that policies to reversebthem only make things worse? The blunt fact is that at no point in the
past century has there been anything resembling a global economic equilibrium.
Consider the heyday of the “American century” after World War II, when Western European nations were ravaged by war, and the Soviet Union and its new satellites slowly rebuilding. In 1945, the U.S. accounted for more than 40% of global GDP and the preponderance of global manufacturing. The country was so dominant it was able to spend the equivalent of hundreds of billions of dollars to regenerate the economies of Western Europe via the Marshall Plan, and also of Japan during a seven year military occupation. By the late 1950s, 43 of the world’s 50 largest companies were American.
The 1970s were hardly balanced—not with the end of the gold standard, the oil shocks and the 1973 Arab oil embargo, inflation and stagflation, which spread from the U.S. through Latin America and into Europe.
The 1990s were equally unbalanced. The U.S. consumed and absorbed much of the available global capital in its red-hot equity market. And with the collapse of the Soviet Union and the economic doldrums of Germany and Japan, the American consumer assumed an ever-more central position in the world. The innovations of the New Economy also gave rise to a stock-market mania and overshadowed the debt crises of South America and the currency implosion of South Asia—all of which were aggravated by the concentration of capital in the U.S. and the paucity of it in the developing world. When the tech bubble burst in 2000, it had little to do with these global dynamics and everything to do with a glut of telecommunication equipment in the U.S., and stock- market exuberance gone wild.
When officials and economists today speak of correcting global imbalances, it is unclear what benchmark they have in mind. So-called excessive American consumption, East-West trade flows, Chinese savings and the like were not responsible for the recent crisis. That was instead triggered by massive misplaced bets on the U.S. housing market and trillions of dollars of derivatives built upon that flimsy foundation.
Yes, many have woven a compelling narrative of how the relationship between China and the U.S.—distorted by China’s fixed and nonconvertible currency on the one hand and America’s debt-fueled appetites on the other—led to massive flows of capital out of the U.S. But that money flowed right back into the U.S. in the form of Chinese purchases of Treasury bonds, mortgage-backed securities and other dollar- denominated assets, which then flowed into our banking system, which then made its way back to U.S. business and to the Treasury, some of which then circulated back into China.
What some see as imbalances can also be described as a system of capital and goods in constant motion. Chinese reserves and U.S. government debt didn’t trigger the meltdown, nor did U.S. consumers cause the meltdown. It wasn’t even U.S. consumer debt— after all, more than 90% of Americans have remained current on their credit cards and their mortgages. The real (and much messier) cause of the meltdown was a potent brew of financial innovation, electronic and instantaneous flow of capital, greed on the part of banks and investors world-wide, against a backdrop of an economic fusion between China and the U.S. that kept interest rates low and inflation lower.
Today’s consensus sounds very much like the orthodoxy of yesteryear—let each nation be its own system in equilibrium, interacting with other systems to create one mega-balanced system. Yet such balance has only existed in theory and only ever will.
Indeed, if the crisis of the past year teaches us anything it should be that forcing reality to conform to abstract theory is a sure recipe for disaster. Forced to act with expediency in the moment, the central banks and governments of the world did a surprisingly good job of triage during the economic emergency that swept the globe. The eclectic demands of a crisis outweighed models and theories, and that was a good thing.
Now that the crisis has eased, the greatest danger is that our collective belief in how the world should work drowns out the creative nimbleness of policy that adapts to the world as it is actually working. Policies that might stem from the global imbalances consensus include American government incentives to increase domestic savings. This sounds good, but not if it leads to underinvestment in innovation, education and infrastructure.
It could also lead Chinese officials to attempt to shift away from exports and state spending. Over the long term this might be beneficial, but it could wreak havoc on domestic Chinese growth and global supply chains if it is done under the erroneous belief that urgent action is required. For its part, the European Union rightly claims that it has not been a primary cause of the perceived imbalances. But its leaders have been central to pushing that thesis and urging China and the U.S. to redress them.
Thankfully, there is less risk of the Chinese government upsetting their apple cart than there is of the American government acting precipitously.
Mr. Karabell is president of River Twice Research and the author, most recently, of “Superfusion: How China and America Became One Economy” (Simon & Schuster, 2009) [Ed. Note: Emphasis is obviously ours!].
Zack’s point here is simple: things change and the notion of markets and economies ever being in equilibrium for more than a fleeting moment in time is little more than utopian nonsense. Capitalism demands evolutionary destruction; capitalism demands that acceptance that things change, and that government is foolish to attempt to stop or even control that change, for in so doing it hampers progress on every front.
Further, who among us knows what changes to thwart and what to embrace; what is good progress and what is inherently evil? Simply put, it is this inability to truly know what shall happen in the future but the certainty with which some honestly believe they know and wish to force others to accept that turns us always and everywhere against the Left, against collectivism and against the current Administration in Washington, for the Left, the collectivists and the Obama Administration believe they have the answers and that we are the great-unwashed awaiting their answer giving. Atlas, however, is shrugging. You can almost feel it.
ZeroHedge – Even though we presented Don Coxe’s report in full earlier, we wanted to recapitulate his thoughts on gold, as we believe they deserve a post of their own. With gold having become, as we expected more than half a year ago, the most discussed and volatile asset class to accompany the latest Fed inflated bubble, Coxe’s view is a welcome addition to other such notable perspectives from the likes of Jim Grant, David Rosenberg, Dylan Grice, Goldman Sachs and many others.
Gold
As the only major financial asset that never pays interest or dividends, gold’s performance could be the clearest, purest example of Zero-Based Investing:
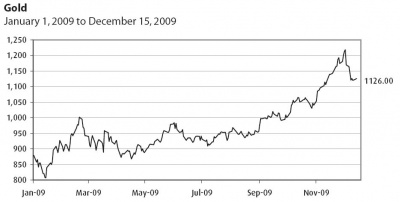
With a 25% rise this year, Gold has beaten the S&P roughly 7%. As measured by the XAU, gold mining stocks’ total return is 35%.
But gold’s investment return was exceeded by the amount of publicity and debate it generated. Its late-year blow-off past $1200 briefly made it a Page One story—thereby automatically guaranteeing a sharp correction.
The media were filled with authoritative explanations:
- Hyperventilating Commentators’ Explanations:
- the collapse of the dollar;
- the repudiation of Obamanomics;
- a warning of a coming financial collapse, leading to Depression;
- a signal of the runaway inflation to come;
- China has only begun to convert its dollar holdings into bullion: the best is yet to come;
- a short squeeze on gold ETFs which are misrepresenting how much bullion they hold: beware of counterparty risk: buy bullion, not paper;
- a coming Armageddon in the Mideast.
Sophisticated Explanations
- gold is the only asset that is nobody’s liability and is therefore a haven in an increasingly uncertain world;
- capitulation by hedged gold miners, notably Barrick;
- India’s purchase of 203 tonnes from the IMF, removing the overhang in bullion markets;
- China’s announcement that its gold holdings are higher than were previously revealed;
- “Peak gold” discussions, as investors ponder the failure of gold mines to maintain—let alone increase—their production despite record bullion prices. The classic expression for getting rich quick is to find a gold mine—but it takes time, experience and capital to bring on a mine. Reported gold companies’ reserves haven’t been rising, but soaring gold prices will change that: millions of tons of low-grade “resources” that haven’t been booked as ore reserves will be reclassified if gold prices remain near or above current levels;
- recognition of the longer-term implications of central banks’ astounding levels of creation of fi at money at a time they are collectively becoming net buyers of gold—after decades of sustained selling;
- respect for gold’s future because prices have managed the remarkable feat of setting new records at a time jewelry demand—traditionally the main support for gold—is slumping sharply;
- portfolio diversification by sophisticated investors who seek a haven at a time of zero returns on Cash—with no indications that central banks are about to abandon their Zero policies.
Clients can undoubtedly add other justifications and explanations to their lists.
We were in Toronto the week gold prices were setting records daily, and were asked—on TV—to explain the dramatic run-up. Various prominent commentators were falling all over themselves to issue ever-higher targets for bullion prices.
We admitted that we couldn’t explain the sudden rush and the dramatic daily leaps. When asked for our price target, we suggested….
“As an historian, I seek some historic data to assist our predicting. When gold broke through $1,000, we began considering appropriate targets. As every English schoolboy knows, 1066 was the Norman Conquest—the first gold target. The next important date was Magna Carta—1215—and gold has now managed to attain that level. The next big date is the Provisions of Oxford 1258 [when Simon de Montfort forced important constitutional changes on Henry III].
“My one-year target for gold is 1345—the onset of the Black Death.
“Apart from that, I really can’t say how high gold could ultimately go, although longer-term it should reach 1485, when Richard III fell in the Battle of Bosworth, launching the Tudor monarchy, and giving us the enduring quote, “My Kingdom for a horse!” The interviewers laughed, and changed the topic.
Next day, Goldman issued its authoritative target price for next year: 1350.
We were called for comment, and graciously accepted that prediction because it was the end of the Black Death.
The point of these musings is that no one really has any idea of the longer term price of gold that can be justified by sober analysis.
All that we can sensibly say is that gold’s price entered a 20-year Triple Waterfall collapse in 1980, falling from $825 to $250, and has risen every year in this decade. If it can maintain its strength at a time jewelry demand is shrinking, then investors and speculators are in charge; their motivations include momentum and malaise: Gold looks good because it keeps going up, and they’re scared about what the Fed and Obama and other central banks and governments are doing, and have no great confidence that there will be a sustained, noninflationary economic recovery, so gold is a good place to hide.
Gold has been the best-performing major commodity since the financial crisis began:
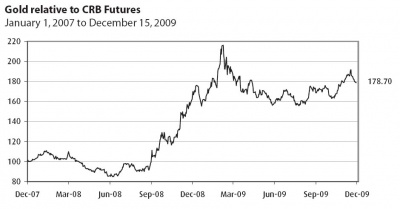
We see no big reason why that outperformance should be over. After its breathless run to $1220, it’s entitled to correct back toward $1,000—or even a bit below that chiliastic level—without ending its bull market.
Finally, gold may even be decoupling from the dollar. The sheer scale of foreign exchange reserves in China, Hong Kong, India and other countries whose currencies are pegged, directly or otherwise, to the dollar may be opening a whole new demand for gold. Just to maintain even tiny percentage exposure to gold in forex reserves means these nations must remain on the buy side. The euro was once seen as a worthwhile alternative to the dollar in Asian forex accounts, but the unfolding problems of its Eastern European and Mediterranean members are exposing the euro’s internal contradictions as a viable alternative to the dollar.
In a world in which nearly all paper money has problems, and in which the sheer supply of paper money is expanding far faster than global GDP, gold has its best claim as a constituent of foreign exchange reserves since Bretton Woods booted it out sixty-five years ago. [emphasis ZeroHedge]
Editor Note: Money Talks highly recommends that you make a regular trip to this monday morning site to this Don Vailoux monday report where he analyses an astonishing 40 to 50 Stocks, Commodities and Index charts and, provides a “Bottom Line” and some very interesting commentary.
– a few of the 40+ charts and commentary below. Full site HERE
The Bottom Line
‘Tis the season for equity markets to move higher until early January! Look for history to repeat. (Ed Note: Some really good commentary at the Bottom of Don’s site today)
The Dow Jones Industrial Average eased 142.61 points (1.36%) last week. Intermediate trend remains up. The Average continues to track above its 50 day moving average. Resistance may be forming at 10,516.70. Short term momentum indicators remain neutral. Strength relative to the S&P 500 Index has been positive, but is showing early signs of turning negative, typical at this time of year. Seasonal influences remain positive.
The TSX Composite Index added 39.47 points (0.35%) last week. Intermediate trend is up. The Index remains above its 50 and 200 moving averages. Short term momentum indicators currently are neutral. Resistance may be forming at 11,816.33. Strength relative to the S&P 500 Index remains negative. Seasonal influences are positive.
The U.S. Dollar jumped 1.23 last week. It broke another resistance level at 77.47. Next short term resistance is at 79.51. Intermediate trend remains down. Short term momentum indicators are substantially overbought, but have yet to show signs of peaking. Seasonal influences normally are negative to the end of December and positive from January to April. Weakness late in December is caused by year end transactions by international companies.
Crude oil gained $2.47 U.S. per barrel (3.43%) last week thanks to colder and stormier than average weather in North America and a surprise drop in crude oil inventories. Inventories have declined significantly since April.
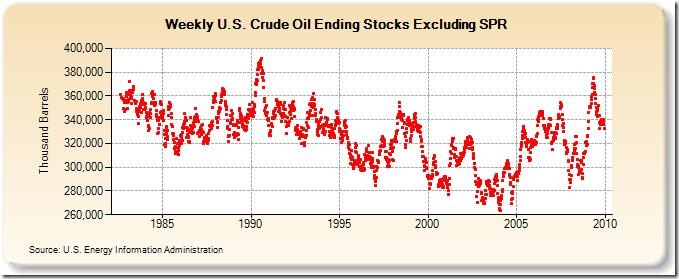
History is repeating itself. Historically, crude oil has reached a seasonal low in the first half of December, forms a base into February and moves strongly higher into May. Resistance exists at $82.00 and support appears to be forming at $69.81. Short term momentum indicators are recovering from oversold levels. MACD recorded a short term buy signal on Friday. The likelihood of a colder-than-average winter this year (partially caused by lower than average sunspot activity) suggests that the period of seasonal strength from February to May likely will come sooner this year and will be more significant than average.
Gold was virtually unchanged (down $3.00 U.S.) last week. It briefly moved below its 50 day moving average, but recovered above that level on Friday. Stochastics are oversold, but are trying to recover.
Legendary global investor and chairman of Singapore-based Rogers Holdings, Jim Rogers said the lack of supply in agricultural products is especially concerning.
As he sees it, “most agricultural products are still depressed on a historic basis.” “The story is not over, not for a while,” he said. “I don’t see any reason it’s going to be over for a few years because no one is bringing new supply on stream.”
“A catastrophe is looming,” he says. “The world is going to have a period when we cannot get food at any price in some parts of the world.” – Jim Rogers
Wheat World: The Long, and Short Of It
I often come across news items in the mainstream channels that read as follows:
“Skittish Grain Markets Waiting For Harvest For Direction.” (December 3 Stock & Land)
It’s the typical handiwork of fundamental analysis, which says that broad trends in financial markets are created as a reaction to certain outside events in a clear and consistent manner. They aren’t. While the news can and often does create volatile price spikes (although not always in a “logical” direction), it has no effect on the larger trend.
Case in point: One day after the above headline published, wheat prices got the “harvest” data it was supposedly “waiting for.” The report was decidedly bearish and included these stats: U.S. winter wheat planting advanced to 90% versus 86% last week; conditions showed 64% of the crop in good/excellent condition; AND, export sales were down 3% from a week earlier, “way behind” 2008’s sales profile. (December 4 Associated Press)
YET — wheat prices rallied.
Now take a long look at the following close-up of wheat prices since the start of 2009. Labeled in print are several excerpts of our past wheat analysis taken from various Futures Junctures Service publications.
Here are the broader insights as they appeared at the time:
March 2009 Monthly Futures Junctures:
“Grains Selloff cooling Down: The decline from the January peak at 658 ¼ shapes up quite nicely as a countertrend move, which we can expect will be more than fully retraced in the weeks ahead.. clearing the way for a run up on the January high.”
June 2009 Monthly Futures Junctures:
“The Party’s Over In Grains: Wheat prices finished a three-wave corrective advance at the recent June peak of 677. We can now look for wheat to more than completely retrace the December 2008 advance that began at 497.”
October 6 Daily Futures Junctures: “Wheat is at an interesting juncture. I think it prudent to acknowledge that an important low could be in place…” with prices likely to see the $6.00 per bushel level soon.
The Stock Market
“Last February, wave guidelines indicated that a rally was coming and that it would be “sharp and scary.” This was at a time when 97% of traders (according to MBH Commodities’ poll) thought the market would continue down. Our ideal upside target zone for the S&P was 1000-1100, which so far has been exceeded by only 19 points. “
So, just as with the dollar in recent months, the stock market is still signaling exhaustion of its 2009 counter-trend move. The gaps up and down through 1096 on the S&P, which are playing havoc with many people’s psyches, have been entertaining from a technical point of view. This level is right at the upper end of our ideal target range, and the market’s action
seems to reflect its importance. Each time the December S&P futures contract gapped up to breach 1100, it waited a few days and gapped right back down through it.”
Fiat Money and Social Trends
“The economy, as measured in inflated nominal terms, has also had somewhat of a respite, as we expected. But the trend of presidential popularity reflects this year’s net decline in real stock prices, much as happened during the Bush Administration, as shown in Figures 1 and 2. “
This continuing correlation is particularly interesting given that the political establishment is primarily responsible for the bad-debt guarantees, mortgage loans to broke people and transfers of debtors’ obligations to the public, which have kept the credit supply inflated over the past year. Unconsciously, yet justly, the public is not letting inflation snow its opinion of the political leader. Its mood with respect to the President is falling right along with real stock prices, which started down in 1999 and have never looked back. The main reason that Barack Obama enjoyed a high initial popularity is that he was not George Bush. That’s why the motto “hope and change” resonated with voters. But his popularity peaked ten days before the inauguration. The trend in social mood that was previously working against Bush is now working against Obama. I am quite sure that the lowest level for the President’s popularity during the current term will break records.

Sign up for Your Free Elliott Wave Newsletters HERE
Paid Services HERE.
Ed Note: Chris Vermulen saw the correction in Gold coming in the posting “Exhaustion – a breather is due” commenting “Don’t get me wrong, I don’t think gold is going to crash, I just think we could get a 10% correction before moving much higher”. Full article HERE.
Gold Trends, Hot Commodities and the Major Indexes, Trade the Trend!
Gold has been leading the market for almost a year. Last week gold and gold stocks were trading at support looking ready to bottom but as you will see in my charts below, both broke support on heavy volume.
With gold now under performing the stocks market, I get the feeling we could see the broad market top. Topping is a process and after this strong climb I figure it will be choppy (tough to trade). Much like the price action on the Dow and S&P500 the past month, but this time it will be on a larger scale.
From a technical stand point the major indexes are trading at a key resistance zone from Oct 2008. This has been an amazing year for trading but I think the time has come for a correction or another melt down depending on how you view the US economy. It does not really matter which happens as we can play both directions.
As far as the fundamentals go, well the US economy in my opinion is scary. All I know is that if the markets start to melt down everyone better make BIG money on the way down because a severe correction will cripple the county as millions more will become unemployed. I am concerned that current recession may turn into a depression.
‘If’ we get another stock market meltdown, literally every asset class will go down with it. The only difference I think will be the trend of gold. Everyone has started to buy gold or at least thought about buying some.
‘If’ a meltdown occurs I think gold will go down in price at first with everything else, but if we are headed for another market collapse EVERYONE will turn to gold as the safe haven, triggering a massive parabolic spike straight up which could last years.
Enough of this negative talk, Lets take a look at the short term gold trends.
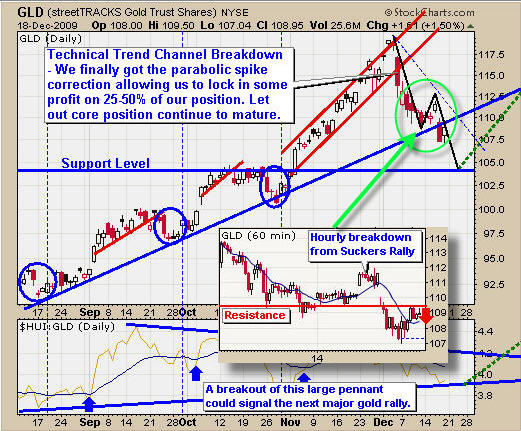
Gold Trend – Daily & 60 Minute Chart
The trend of gold broke down from the red rising channel a couple weeks back as expected. We were taking profits at the $115 level.
The more recent price action shows two technical breakdowns on the daily chart and the small 60 minute overlaid chart. The daily breakdown crashed through our support trend line and the 60 minute chart shows the breakdown below the previous low. The price is currently trading at resistance and the odds now favor lower prices.
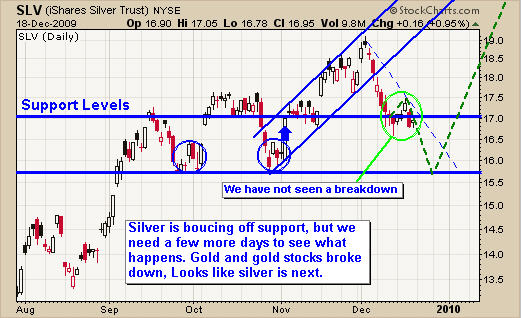
Silver Trend – Daily Chart
Silver is trading at support and has yet to break the previous low. I think we will see this happen in the next few days.
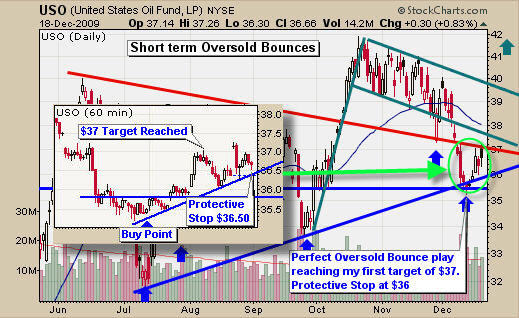
Crude Oil Trend – Daily Chart
Oil had a great setup last week with many readers profiting from the oversold bounce off support which I pointed out on the daily chart last week. When buying into an oversold setup like this I scale in over 2-3 days in case prices dip lower as the selling dissipates. Average price was $35.75 and sold at first target of $37 for a 3.5% profit. Many of us still hold a core position with a tight stop.
The 60 minute chart shows this play and how the price popped once the sellers were cleared out.
Natural Gas Trading Trend – Daily Chart
Trend lines provide excellent levels for support and resistance and this chart is a perfect example of that. Not much to say about this chart other than UNG is trading at resistance and volume is big. This tells me we could see lower prices from here or some sideways price action first.

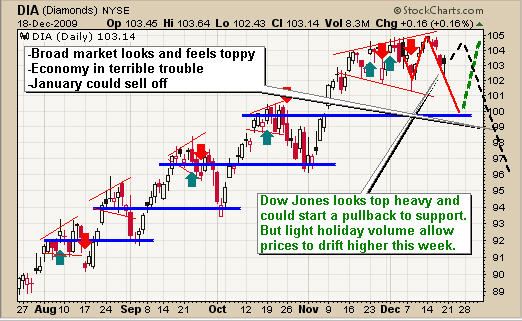
Broad Market Index – Dow Jones ETF – Daily Chart
In short, the market is starting to correct as we thought. It still has more to go before testing support. But because this week is a holiday week, volume will be light and like volume favors higher prices. So we could see the highs tested or sideways action.
From looking at the monthly, weekly and daily charts of the major indices I think the market is about to have a sharp correction. If we get a breakdown then we are headed to the next support level which is about 9% down from the recent high in the DIA etf fund.
GOLD TREND AND TECHNICAL CONCLUSION:
The trend of gold has been very predictable over the recent months and this correction seems to be text book pullback. I see the short term trend of gold still down but the longer and more powerful underlying trend is up. Let’s wait for the price of gold and silver to sort itself out and wait for low risk entry points before jumping back in.
Crude oil is in pinball mode. It’s just bouncing around between support and resistance levels now. Not much we can do but wait for another setup.
Natural gas is trading at resistance and if we get the proper price action in the next few days we could have a great short trade. Only time will tell.
The broad market trend is looking and feeling very toppy. A lot of money has been moving out of stocks the past 4 weeks and January could be a roller coaster. Last week I exited all my positions except XTR.TO (Energy and Financial dividend fund) which many of us took a position in late February and first week of March. I have set a tight stop and hoping to get the 4th dividend payout before it corrects.
I want to note that I am not going to be shorting the market until the bear trend is definitive. This could be 2-3 months down the road still. But after a great year of trading and the market and economy looking the way it does I am happy to be sitting in cash.
Receive my Free Weekly Gold Trend and Market Analysis: Sign Up & Get FREE Technical Trading Charts HERE.
My name is Chris Vermeulen, founder of TheGoldAndOilGuy newsletter. I provide you with unparalleled trading newsletter with charts, signals and email support. Unlike other investing newsletters, I’m a one man show. That’s because I don’t want some hired hand giving you advice while I take it easy on a beach somewhere. You ALWAYS get precise, valuable information DIRECTLY from ME.
Interview: Trading Expert Helps Investors Learn the Ropes
Testimonial: Chris, Your reports are technical and thoughtful and above all you are cautious. I learn something from every report. WH Toronto.
I believe this is the perfect trading service for active traders who want a conservative yet highly profitable trading strategy and signals. The GLD Gold exchange traded fund allows for very accurate signals when used along with the price of gold, HUI, USD, bullish percent charts and gold stocks. I also focus on USO, UNG, XLE, and XEG.TO energy funds. When these factors are used together with technical analysis and my proven trading strategy, trades become very CLEAR and SIMPLE to execute. My strategy makes your trades extremely accurate with very little downside risk.
-
I know Mike is a very solid investor and respect his opinions very much. So if he says pay attention to this or that - I will.
~ Dale G.
-
I've started managing my own investments so view Michael's site as a one-stop shop from which to get information and perspectives.
~ Dave E.
-
Michael offers easy reading, honest, common sense information that anyone can use in a practical manner.
~ der_al.
-
A sane voice in a scrambled investment world.
~ Ed R.
Inside Edge Pro Contributors

Greg Weldon

Josef Schachter

Tyler Bollhorn

Ryan Irvine

Paul Beattie

Martin Straith

Patrick Ceresna

Mark Leibovit

James Thorne

Victor Adair