Editor Note: Money Talks highly recommends that you make a regular trip to this monday morning site to this Don Vailoux monday report where he analyses an astonishing 40 to 50 Stocks, Commodities and Index charts and, provides a “Bottom Line” and some very interesting commentary.
– a few of the 40+ charts and commentary below. Full site HERE
The Bottom Line
‘Tis the season for equity markets to move higher until early January! Look for history to repeat. (Ed Note: Some really good commentary at the Bottom of Don’s site today)
The Dow Jones Industrial Average eased 142.61 points (1.36%) last week. Intermediate trend remains up. The Average continues to track above its 50 day moving average. Resistance may be forming at 10,516.70. Short term momentum indicators remain neutral. Strength relative to the S&P 500 Index has been positive, but is showing early signs of turning negative, typical at this time of year. Seasonal influences remain positive.
The TSX Composite Index added 39.47 points (0.35%) last week. Intermediate trend is up. The Index remains above its 50 and 200 moving averages. Short term momentum indicators currently are neutral. Resistance may be forming at 11,816.33. Strength relative to the S&P 500 Index remains negative. Seasonal influences are positive.
The U.S. Dollar jumped 1.23 last week. It broke another resistance level at 77.47. Next short term resistance is at 79.51. Intermediate trend remains down. Short term momentum indicators are substantially overbought, but have yet to show signs of peaking. Seasonal influences normally are negative to the end of December and positive from January to April. Weakness late in December is caused by year end transactions by international companies.
Crude oil gained $2.47 U.S. per barrel (3.43%) last week thanks to colder and stormier than average weather in North America and a surprise drop in crude oil inventories. Inventories have declined significantly since April.
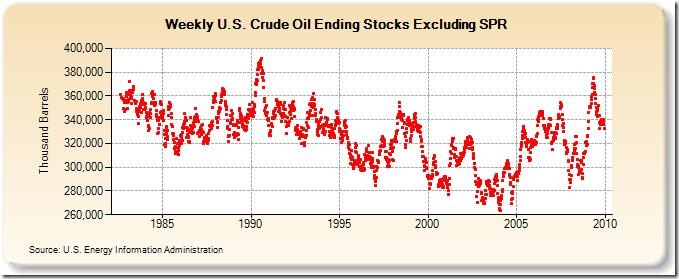
History is repeating itself. Historically, crude oil has reached a seasonal low in the first half of December, forms a base into February and moves strongly higher into May. Resistance exists at $82.00 and support appears to be forming at $69.81. Short term momentum indicators are recovering from oversold levels. MACD recorded a short term buy signal on Friday. The likelihood of a colder-than-average winter this year (partially caused by lower than average sunspot activity) suggests that the period of seasonal strength from February to May likely will come sooner this year and will be more significant than average.
Gold was virtually unchanged (down $3.00 U.S.) last week. It briefly moved below its 50 day moving average, but recovered above that level on Friday. Stochastics are oversold, but are trying to recover.