
Daily Updates
U.S. Stock Market – Was it just me or did anyone else hear this music yesterday throughout Wall Street and in the financial media? Ah how nice it is all is well again and the stock market has become once again the engine that could… Oh forgive me for dreaming for a minute. Heck, as a forty year NY Jets fan, I even dreamed the Jets made the playoffs.
This seemingly disregard of numerous serious economic, social and political factors both here and abroad is exactly what is needed before I would put my bear suit back on. I can tell you it’s out of storage, pressed and ready to go. My target since last spring of DJIA 10,500 – 11,000 is now upon us even though I thought it wouldn’t be until this summer. That belief is the main reason why I have yet to pull the trigger. My work has suggested for quite awhile that the economy would bounce through this summer before puttering out. All indications continue to suggest fairly decent growth for the first two quarters
So while it’s okay for now to hum along with the “Don’t Worry, Be Happy” crowd, don’t forget our bags are packed and both eyes are on the exit door.
Gold – AS noted near year-end, the bulk of the correction appeared behind us and it was okay to get back into bullion. While it would be best for gold to back and fill while working its way higher, I’ve stated for several years now the surprises in gold are mostly to the upside.
Daily Chart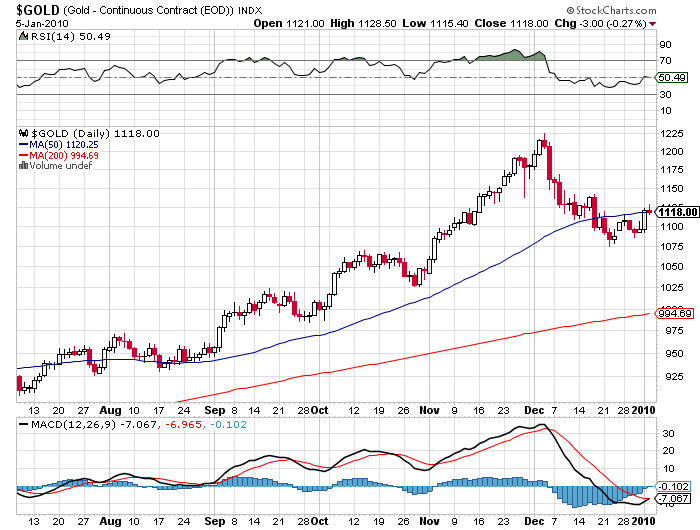
We’re close to turning quite bullish again technically. As I type this early AM, gold is breaking above its 50-Day M.A. and the MACD is about to turn bullish. Closing above $1,150 should remove any lingering doubt the correction was anything more than a refreshing breeze.
U.S. Dollar – We all know that the bear camp became so overloaded that we witnessed record low percentage of dollar bulls in the future pits in the last month or so of 2009. Naturally, a countertrend rally evolved and can last for several weeks to a few months. One of the reasons I question its ability to be anything much more than a blip up is how fast the dollar bull camp filled up and the fact that all the bearish factors that have led to terminal illness for Uncle Sam remain.
I noted that the perma-gold bears were praying to the dollar gods for a big rally in futile hope that their horrific track record on gold could somehow be salvage with some massive sell-off in the gold price on the back of some gigantic dollar rally. I stated the surprise should be how well gold performs without a declining U.S. Dollar. The New Year is only two trading days old but I can assure you a few balloons have already busted in the gold perma-bear camp.
Daily Chart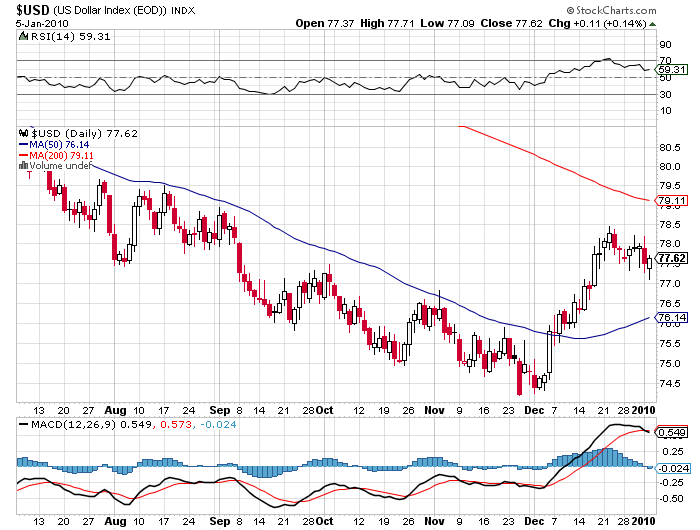
U.S. Bonds – Avoid! Any questions?
Weekly Chart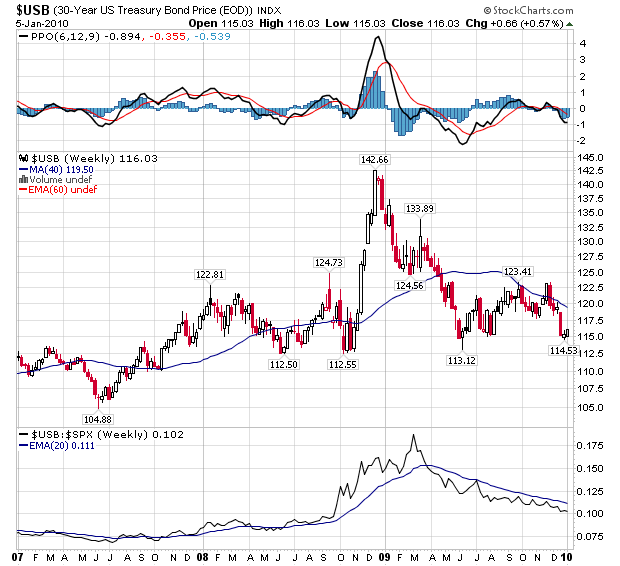
Oil and Gas – A worldwide severe winter has aided in the nice pop in oil and natural gas. For oil, I also believe underneath the surface there’s an element of geopolitical concerns that are supporting prices. I’m neither bull or bear on energy.
Daily Chart
New Buy Recommendations For Model Portfolio – The following six stocks are being added to my model portfolio today (8:21 AM on Tuesday, January 5th, 2010). They are:
Barrick Gold (ABX-NYSE/Amex $40.39)
Entrée Gold (EGI-NYSE/Amex $ 2.84
Goldcorp (GG-NYSE $ 40.68)
Kinross Gold (KGC-NYSE $18.88)
Newmont Mining (NEM-NYSE $ 48.45)
Richmont Mines (RIC-NYSE/Amex $4.22)
Tidbit on Continental Minerals – I’m told KMK’s CEO Dave Copeland flew to China yesterday and Scott Cousens, another board member and partner of Hunter-Dickinson is going to China this week. I know Scott well. He likes Chinese food a lot. But I doubt he’s going there just for the cuisine.
On Major Moves, Grandich has been very right and not only saved many investors fortunes, but expanded them dramatically. On November 3, 2007 at the MoneyTalks Survival Conference, Peter Grandich of the Grandich Letter warned that “an unprecedented economic tsunami will hit American beginning in 2008”. Peter advised publicly to short the US market two days from the top in October, 2007 and stayed short until the last week of October, 2008. He began to buy stocks in March 7th, 2009. He also bought oil and oil related investments near the lows after the dive from $147…..go to visit Peter’s Website.
Crude Oil
From its trough on December 22, 2008 through December 22, 2009, crude oil spot prices, as reflected in the West Texas Intermediate price and reported by Bloomberg, were up 135%. But that impressive return bears qualification.
First, it was only available to those who bought a physical barrel of oil at the Cushing, Oklahoma terminal. For those investing in oil futures, as measured by the S&P/GSCI total return, oil was up only 13% over that period (the difference, as mentioned earlier, is due to the contango of the futures curve in oil). It was also a fleeting opportunity; if we use the price on December 31, 2008 as our starting point, the crude oil price increase was less than half, at 66%, highlighting the immense volatility in commodities.
One can point to five factors as plausible explanations for the increase in prices to the current level of $74/barrel. First and foremost, we believe that a significant part of the increase is driven by the virtual elimination of the risk of a Great Depression-style global economic meltdown. Other possible factors are a decrease in the value of the dollar, fears of high inflation, expected increases in demand from the emerging market countries and resumed talk of underinvestment in the energy sector and peak oil. It is also important to remember that while oil has recovered from its December 2008 lows, it is still about 50% below its July 2008 peak.
Let’s first look at the relationship between oil and the dollar. The dollar is, in fact, slightly negatively correlated with oil with an average 12-month rolling correlation of -0.11. The latest 12-month correlation stands at -0.47. As oil prices have increased from their lows in late December 2008, the dollar has depreciated by 5.2%. Since its peak level during the financial crisis in March 2009, the dollar has depreciated by 12.8%.
While the current increase in the price of oil has coincided with a fall in the dollar, this relationship is not very stable; there are many periods where oil and the dollar have been positively correlated. From November 1985 through April 1987, for example, the dollar depreciated by 21% and oil dropped by 37%. No negative correlation there. Similarly, between December 1998 and February 2002, the dollar rallied 17% against a trade-weighted basket of currencies and oil rallied 80%! The explanation for this shifting correlation is that many other factors drive changes in the price of oil. In fact, on average, movements in the dollar explain only 16% of the changes in the price of oil.
We do not recommend overweighting crude oil as a hedge against further deterioration in the dollar. First, the dollar-oil relationship is not stable enough to be a primary driver of returns. Furthermore, we believe that the dollar is, in fact, cheap, and our long-term view of it is favorable. While the dollar might depreciate further, we believe that the US economy will outperform Europe, the UK and Japan, and its currency will adjust accordingly sometime over the next 12 months.
Another explanation for the rally in oil has been an expectation of higher inflation. With an expected debt/GDP ratio of over 70%, a Federal Reserve balance sheet of $2.2 trillion as of year- end 2009 and a near-zero interest rate policy, some have argued that inflation is inevitable and commodities – both oil and gold – are an effective hedge against it. As shown in our discussion above, commodities are not an effective hedge against generalized inflation; they are an effective hedge against commodity-induced inflation as witnessed in the 1970s during the Arab Oil Embargo, the Iranian Revolution and the early part of the Iran-Iraq War. So buying commodities to hedge against generalized inflation brought about by extensive fiscal stimulus and loose monetary policy is not effective in our view. Furthermore, we are not worried about inflation in the current environment. As detailed in our 2010 Outlook, there is significant excess capacity globally, from labor to industry to most services. Inflation, as measured by the Headline Consumer Price Index, has been 1.8% over the last year; consensus for the next 12 months is 2.0%. In our view, a muted inflation level of 2-3% will not drive up oil prices in the next year or two.
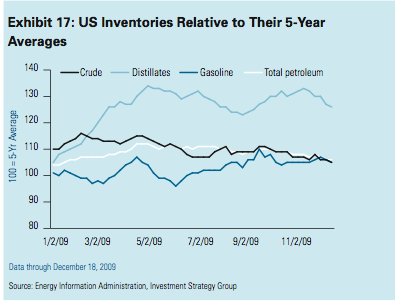
Turning to supply and demand for oil over the next 12-24 months, it seems that most of the data points to stable or lower prices in the near term. Take inventory levels; at 1.06 billion barrels, commercial inventories in the US (which exclude the 726 million barrels stored in the Strategic Petroleum Reserves) are above the high end of the range seen in the last five years, as shown in Exhibit 16. US distillates, including diesel and heating oil, are 26% above their five-year average (Exhibit 17).
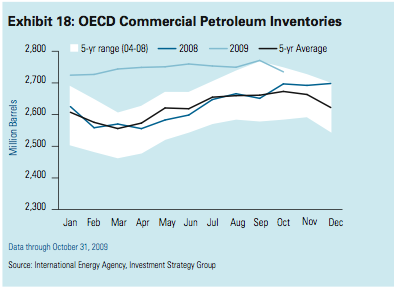
Looking globally, official Organisation for Economic Co-operation and Development
(OECD) inventories stand at a strong 2.73 billion barrels, as shown in Exhibit 18. According to the International Energy Agency (IEA), there is another 150 million or so barrels of crude oil and products stored in tankers in the high seas; you may have noticed a recent article in The Wall Street Journal about how the oil tankers used as floating storage off the coast of southeast England have raised concerns about a possible oil spill that could ruin the area’s beaches!12
At these levels, inventories cover 59.4 days of OECD consumption (reliable inventory data on all emerging countries is not readily available).Exhibit 16:
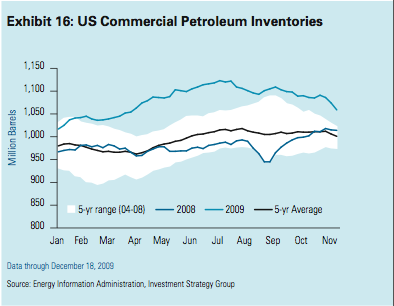
US CommercialPetroleum Inventories Exhibit 18: OECD Commercial Petroleum Inventories
As can be seen in Exhibit 19, this coverage ratio is substantially above the 20-year low of 49.3 days and not far from the 20-year high of 64.6 in 1990. Such high levels of inventory coincide with lower levels of demand. In the US, total petroleum product demand is 8.9% below its 5-year average.
With such high levels of inventory as a backdrop, small supply and demandimbalances become a little less critical. And as is typical in the oil industry, there is a wide range of estimates on supply, demand and excess capacity. It is clear that the rebound in global growth will reverse the drop in demand we saw in 2009. IEA estimates that oil demand will increase by about 1.5 million barrels per day (b/d) (Exhibit 20).
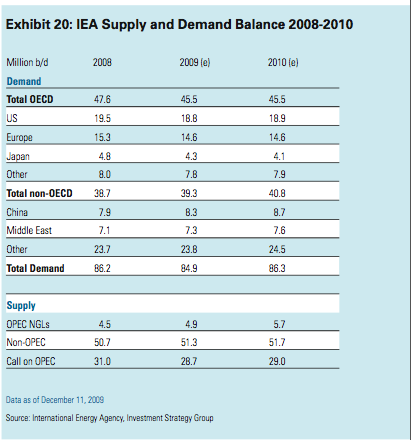
At the low end of the range, OPEC estimates an increase of about 800 thousand b/d, while our colleagues at Goldman Sachs Global Economics, Commodities, and Strategy (ECS) Research estimate 2.2 million b/d. The average of 8 highly- regarded forecasters is about 1.3 million b/d. This incremental demand can be met from both OPEC and non-OPEC sources.
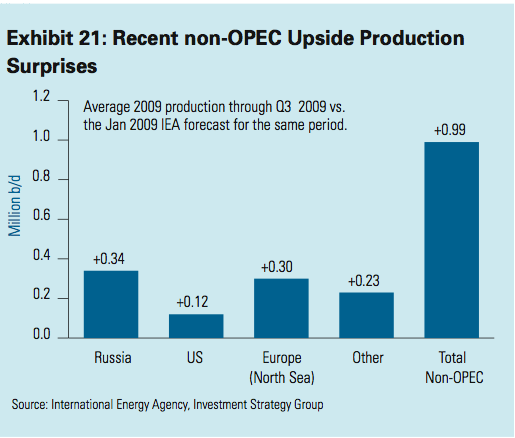
On the supply side, the IEA estimates an increase in non-OPEC supply of about 400,000 b/d and an increase in OPEC Natural Gas Liquids (NGLs) of about 900,000 b/d. The call on OPEC supply is estimated to increase by about 230,000 b/d. In the most optimistic scenario, FACTS Global Energy estimates supply exceeding demand by about 1.5 million b/d; in a more pessimistic scenario, our colleagues at Goldman Sachs’s ECS Research expect a short-age of about 580,000 b/d. We should note that in spite of repeated warnings of depleteing oil wells, non-OPEC production has actually surprised to the upside in 2009, as shown in Exhibit 21, by about 990,000 b/d.
It seems to us that with a combination of high inventory levels, increased production in non-OPEC countries, marginal increases in OPEC crude production and increases in OPEC NGL production, prices do not have much further upside from current levels, barring a major geopolitical event. Even if economic growth exceeds our expectations and drives up consumption, OPEC spare capacity is quite significant. As shown in Exhibit 22,
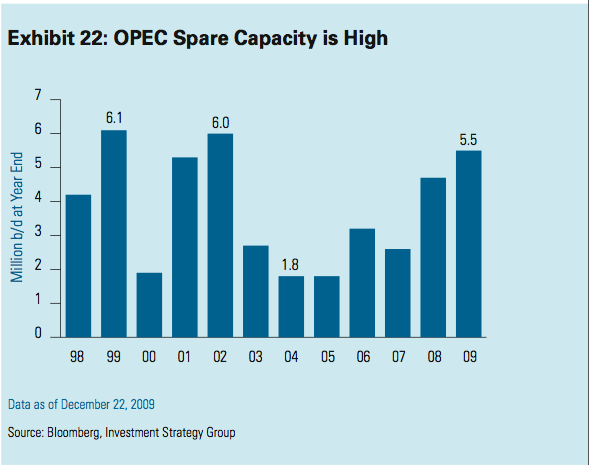
year-end 2009 spare capacity is estimated at 5.5 million Exhibit 19:
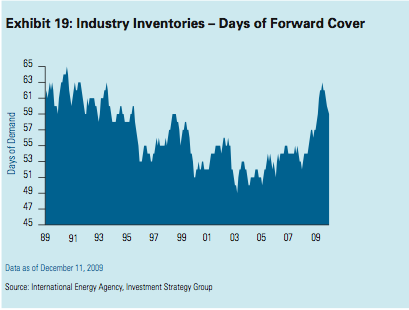
Industry Inventories – Days of Forward Cover b/d, which is 3.7 million b/d above the low levels seen in 2004 and 2005. This spare capacity is expected to increase by up to 1 million b/d in 2010 and excludes any growth in Iraq’s production capacity. While Iraq’s future production capacity is highly uncertain given the structural and political problems the country faces, it is reasonable to assume that the increase in productionwill be over 2-3 million b/d in the next few years. In the last year, Iraq has signed deals with several major oil companies including Exxon Mobil, BP, Royal Dutch Shell, China National Petroleum Corporation and Eni with incentives to increase production quickly. In fact, some have estimated an increase in production capacity by as much as 10 million b/d by 2020.
For the near term, we estimate prices will range between $60-85 per barrel. The low end of the range among major contributors to the Bloomberg consensus survey for year-end 2010 is $60. Goldman Sachs research is at the high end at $95 per barrel.Some OPEC members have indicated a preference for stable prices in the $70-80 range; the futures curve for end of 2010 is $80 per barrel. With current prices at about $74 per barrel and 6-month realized volatility at 36%, we do not believe that a tactical overweight to oil is warranted at this time. While we realize that “financial buyers” may drive short term prices higher, we think that the supply and demand factors point toward stable or slightly declining prices. Furthermore, our view of muted inflation for the next two years does not provide any tailwind and our favorable view of the dollar might actually provide a slight headwind to sustained oil price increases.
“Peak Oil” and the Long-Term Upside
One of the common themes that pervades most oil discussions is the impending shortage of supply to meet the increasing demand from emerging markets. People conjure images of hundreds of millions of cars in China and India juxtaposed with declining production in non- OPEC countries, attacks and kidnappings in Nigeria’s Niger Delta and 24,000-foot deep wells in the offshore Tupi field in Brazil. Such discussions end with a conclusion that oil prices are on a significant upward trajectory. At the extreme, the discussion ultimately leads to “peak oil” – a point in time when the maximum rate of global production is reached, and after which production declines. In 1956, M. King Hubbert predicted peak oil production in the US between 1965 and 1970 (US peak production was, in fact, reached in 1970) and globally by 2000 (this obviously has not occurred, and we do not expect it to in the foreseeable future). Peak oil theorists generally believe that supply shortages will be very disruptive to global economies.
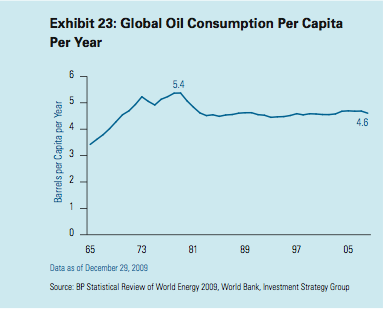
We do not believe in peak oil. First, improvements in energy efficiency and concerns about carbon emissions have led to a decline in global oil consumption per capita per year since 1979, as shown in Exhibit 23.
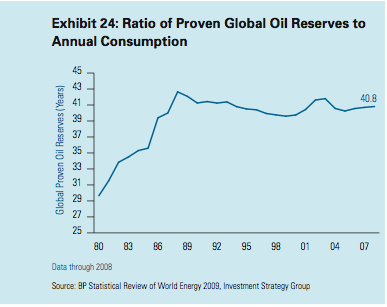
Even more amazing to us is the fact that the ratio of proven global oil reserves to consumption has held quite steady near the 40-year level; in other words, in spite of increasing overall consumption and depletion of reserves of many fields, proven global oil reserves have steadily increased with consumption to maintain this reserve to-consumption ratio, as shown in Exhibit 24.
In addition, technological improvements in exploration and production have increased recoverable reserves from existing fields and made deep-water fields such as Tupi accessible. In spite of earlier predictions that no major finds were going to occur, these discoveries have surprised to the upside, as shown in Exhibit 25.
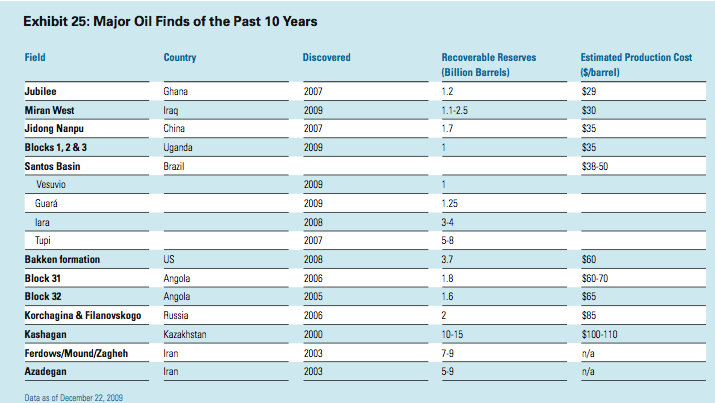
For example, in 2008, the US Geological Survey reported 3.65 billion barrels of undiscovered technically recoverable oil in the Bakken formation in North Dakota. While production in the Bakken dates back to 1970, improvements in horizontal drilling and hydraulic fracturing and the higher prices that make such techniques economical have increased the recoverable reserves substantially. In another example, Chevron has been trying to extend the life of one of the world’s oldest oil fields, the Kern River, by using enhanced recovery techniques involving high-technology temperature sensors to monitor production.13 It is worth noting, incidentally, that not all the discoveries will require higher production costs.
Outside the United States, the potential for significant discoveries is also high. As shown in Exhibit 26, with the exception of North America and Latin America, most of the drilling activity is small relative to the current estimates of proven world reserves: the Middle East holds 60% of the world’s proven reserves, yet accounts for only 15% of the world’s drilling activity; Africa has 10% of the proven reserves, yet accounts for just 4% of drilling activity.

In our view, the peak oil theories are alarmist and unwarranted. After steady price increases in the 1970s from a low of $1.80 per barrel to a high of $44 per barrel (which is equivalent to $109 per barrel in today’s dollars), it was common to hear about production peaks and long term oil shortages. Some 30 years later, the message is being repeated. However, we go back to Economics 101: higher prices beget higher supply, albeit with some lag and at higher marginal costs. So while we don’t believe in oil short- ages in the foreseeable future, we do think that, on average, marginal costs will be higher, thereby putting a floor on prices and supporting a sustainable increase in prices toward the $80- $100 range over the next several years.
Our expectation of broadly higher prices represents only a modest and gradual increase over current levels, and it is not significant in the context of oil’s volatility level (which averaged about 40% over the past decade). As such, we don’t believe that investing in oil futures is an optimal long-term solution at this time.
Furthermore, contango will be a persistent drag on returns and short-term downside risk, given oil’s volatility, is significant.
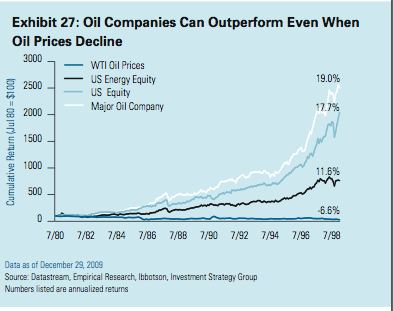
For those who have a strong bullish view, we recommend investing through the public or private equity market, where an effective operator can add value in the long run irrespective of the direction of prices and provide some downside protection should oil prices decline to the low end of our 12-month range (which, as noted above, is $60-85 per barrel). Exhibit 27 shows how a major oil company performed well over an 18-year period where oil prices declined over 70% in nominal terms.
Now that 2009 is drawing to a close, it’s time to read the tea leaves and gauge how the metals markets might perform going forward.
The U.S. dollar story is as much about the shift of wealth to the East and disenchantment with Western governments’ fiscal management as it is about the perils of Wall Street. It’s following a path trodden by many imperial currencies before it, and there are good reasons to think the dollar will be at lower levels before its fall ends.
The gold market continues to look good, as do the gold explorers added to our Hard Rock Analyst (HRA) list this year.
With that said, we’ll move on to look at the base metals complex. Commodities in general and metals in particular have been among the best performing sectors of the market this year. This has led to a lot of confusion among traders and commentators. Many view current metal prices with great suspicion because they are not doing what they are “supposed” to. There has been grudging acceptance of recent moves in precious metal prices, but prices for other metals have many screaming “bubble!”
Are current base metal prices all about liquidity and hedge-fund trading, or have there also been fundamental changes in the market that point to good things ahead? We are very much in the “good things ahead” camp.
That said, most tradable metals are definitely getting a heavy assist from the declining dollar. There is no doubt some of this year’s renewed strength in base metal prices is from traders using them as “anti-dollar” trades or hedges against potential future inflation.
That does not negate the big picture story how- ever. Metals are in a secular bull market. While the rapid reversal of fortunes comes as a shock to some, this is what a secular bull market looks like.
For some perspective, take a look at Chart 1. This….
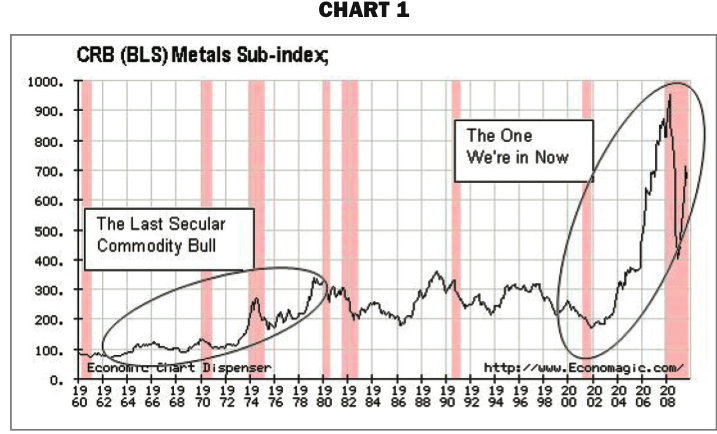
……read page 2 and 3 HERE.
Rare earth metals had a bumpy ride during 2009. After years in relative obscurity, the investment community suddenly discovered the potential returns from rare earths after the little-known metals were cast into the spotlight by reports that China might restrict exports and cause prices to move much higher. Several rare earth metal explorers watched their share prices double in a matter of weeks and some put in gains of over 400%.
The NY Times article “China Tightens Grip on Rare Minerals” helped to shine the light on the extreme geographic concentration of rare earth metal production. Over 95% of rare earth metals are currently mined in China and the Communist government is trying to ensure that all raw REE materials are processed within its borders. During the past seven years it has reduced by 40 per cent the amount of rare earths available for export and some are estimating they will begin halting exports as early as 2012.
Even if China continued exporting at current rates, demand is rapidly outpacing supply and many are predicting a 40,000 tonne annual shortfall by 2015. Watch the Reuters video on rare earth metals.
After a brief period of rare earth mania, the share prices of many companies have since returned to more fair valuations. But a rebounding worldwide economy and growing concern over China’s control of such a strategic resource are once again pushing rare earth metals into the spotlight. On January 2nd, an article in the UK Independent titled “Concern as China Clamps Down on Rare Earth Exports,” is once again stirring up investment demand.
……read more HERE (scroll down to the quotation by ZHAO ZENGQI:) for more analysis and company charts and profiles.
So what’s next? What’s the trade of the coming decade? Well, your editor has decided not to double-down on the identical trade. Gold will remain in our core holdings, but not in our Trade of the Decade for the next 10 years……..
Our NEW Trade of the Decade!
01/04/10 Bethesda, Maryland – Well, that was it for 2009. Whew!
Another great year for gold. But it wasn’t a bad year for stocks either. The NASDAQ rose 45%. The Dow went up about 20%.
As we guessed back at the beginning of the year, stocks bounced. What we didn’t guess was that they would bounce so much for so long. All over the world, stocks went up…and continued to go up. A bounce is inevitable, following a stock market drop. And it’s impossible to say how big a bounce it will be…or how long it will go on.
But a kiss is still a kiss…and a bounce is still a bounce. No kiss lasts forever. Neither does a bounce. Looking ahead, we have to anticipate that it will come to an end…probably in 2010.
If you’ve profited from the 2009 run up in stocks…bravo! Now, sell them… Yes, the bounce could continue. But it’s not worth the risk.
And how ’bout the gold market! Gold has risen every year of the decade. It was the surest, safest place for you money – by far.
Does that mean gold will go up in 2009? Does that mean we will stick with our ‘Trade of the Decade’ for another ten years? Not to brag, but our trade was a big success. Even we were surprised by how well it did.
As long-suffering Daily Reckoning readers will recall, we announced our ‘Trade of the Decade’ in 2000: Sell Stocks; buy gold.
“It turned out to be a good plan,” observes colleague, Merryn Sommerset, in a recent Financial Times story. “In 2000, you could buy an ounce of gold for $280 (the average price over the year). Now, it will cost you about $1,100. At the time, Bonner saw what most others did not. He saw the US not as an economy carefully and cleverly managed by then Federal Reserve chairman Alan Greenspan and his passion for low interest rates, but as a massive credit bubble waiting to burst.
“He also saw the massive and growing national debt, the trade and budget deficits, and fast growth in the money supply as factors that would naturally debase the dollar over the long term. He also saw the credit bubble as global rather than peculiar to America. So it made sense to him to hold the only non-paper currency there is – gold.”
So what’s next? What’s the trade of the coming decade? Well, your editor has decided not to double-down on the identical trade. Gold will remain in our core holdings, but not in our Trade of the Decade for the next 10 years. Why? Because we think the US economy is going the way of Japan.
Japan went into a slump in 1990. It has come out…and gone back in…and come out again…and gone back in again. In terms of the amount of wealth destroyed – at least, on paper – it was the worst disaster in human history. The value of real estate went down 87% in some cities. Stocks fell from a high of 39,000 on the Nikkei Dow down to the 7,000 range in 2009…their lowest point in 27 years.
Why such a bad performance? As we keep saying, if you really want to make a mess of things you need taxpayer support. The Japanese put more taxpayer money into the effort to prevent the correction than any nation theretofore ever had. The result: the correction was stalled, delayed, and stretched out over more than two decades.
And now, US economists are looking at Japan…not with alarm, but with admiration. They are beginning to believe that the Japanese model is the way to go…because it prevented widespread unemployment and a deeper slump.
Here’s our best guess:
….scroll down to the headline above and continue reading HERE (more than 1/2 of the article to go which reveals the New Trade of the Decade and the reasons why)
-
I know Mike is a very solid investor and respect his opinions very much. So if he says pay attention to this or that - I will.
~ Dale G.
-
I've started managing my own investments so view Michael's site as a one-stop shop from which to get information and perspectives.
~ Dave E.
-
Michael offers easy reading, honest, common sense information that anyone can use in a practical manner.
~ der_al.
-
A sane voice in a scrambled investment world.
~ Ed R.
Inside Edge Pro Contributors

Greg Weldon

Josef Schachter

Tyler Bollhorn

Ryan Irvine

Paul Beattie

Martin Straith

Patrick Ceresna

Mark Leibovit

James Thorne

Victor Adair