Crude Oil
From its trough on December 22, 2008 through December 22, 2009, crude oil spot prices, as reflected in the West Texas Intermediate price and reported by Bloomberg, were up 135%. But that impressive return bears qualification.
First, it was only available to those who bought a physical barrel of oil at the Cushing, Oklahoma terminal. For those investing in oil futures, as measured by the S&P/GSCI total return, oil was up only 13% over that period (the difference, as mentioned earlier, is due to the contango of the futures curve in oil). It was also a fleeting opportunity; if we use the price on December 31, 2008 as our starting point, the crude oil price increase was less than half, at 66%, highlighting the immense volatility in commodities.
One can point to five factors as plausible explanations for the increase in prices to the current level of $74/barrel. First and foremost, we believe that a significant part of the increase is driven by the virtual elimination of the risk of a Great Depression-style global economic meltdown. Other possible factors are a decrease in the value of the dollar, fears of high inflation, expected increases in demand from the emerging market countries and resumed talk of underinvestment in the energy sector and peak oil. It is also important to remember that while oil has recovered from its December 2008 lows, it is still about 50% below its July 2008 peak.
Let’s first look at the relationship between oil and the dollar. The dollar is, in fact, slightly negatively correlated with oil with an average 12-month rolling correlation of -0.11. The latest 12-month correlation stands at -0.47. As oil prices have increased from their lows in late December 2008, the dollar has depreciated by 5.2%. Since its peak level during the financial crisis in March 2009, the dollar has depreciated by 12.8%.
While the current increase in the price of oil has coincided with a fall in the dollar, this relationship is not very stable; there are many periods where oil and the dollar have been positively correlated. From November 1985 through April 1987, for example, the dollar depreciated by 21% and oil dropped by 37%. No negative correlation there. Similarly, between December 1998 and February 2002, the dollar rallied 17% against a trade-weighted basket of currencies and oil rallied 80%! The explanation for this shifting correlation is that many other factors drive changes in the price of oil. In fact, on average, movements in the dollar explain only 16% of the changes in the price of oil.
We do not recommend overweighting crude oil as a hedge against further deterioration in the dollar. First, the dollar-oil relationship is not stable enough to be a primary driver of returns. Furthermore, we believe that the dollar is, in fact, cheap, and our long-term view of it is favorable. While the dollar might depreciate further, we believe that the US economy will outperform Europe, the UK and Japan, and its currency will adjust accordingly sometime over the next 12 months.
Another explanation for the rally in oil has been an expectation of higher inflation. With an expected debt/GDP ratio of over 70%, a Federal Reserve balance sheet of $2.2 trillion as of year- end 2009 and a near-zero interest rate policy, some have argued that inflation is inevitable and commodities – both oil and gold – are an effective hedge against it. As shown in our discussion above, commodities are not an effective hedge against generalized inflation; they are an effective hedge against commodity-induced inflation as witnessed in the 1970s during the Arab Oil Embargo, the Iranian Revolution and the early part of the Iran-Iraq War. So buying commodities to hedge against generalized inflation brought about by extensive fiscal stimulus and loose monetary policy is not effective in our view. Furthermore, we are not worried about inflation in the current environment. As detailed in our 2010 Outlook, there is significant excess capacity globally, from labor to industry to most services. Inflation, as measured by the Headline Consumer Price Index, has been 1.8% over the last year; consensus for the next 12 months is 2.0%. In our view, a muted inflation level of 2-3% will not drive up oil prices in the next year or two.
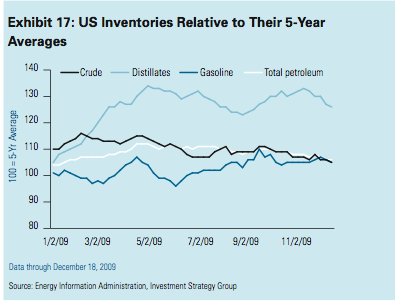
Turning to supply and demand for oil over the next 12-24 months, it seems that most of the data points to stable or lower prices in the near term. Take inventory levels; at 1.06 billion barrels, commercial inventories in the US (which exclude the 726 million barrels stored in the Strategic Petroleum Reserves) are above the high end of the range seen in the last five years, as shown in Exhibit 16. US distillates, including diesel and heating oil, are 26% above their five-year average (Exhibit 17).
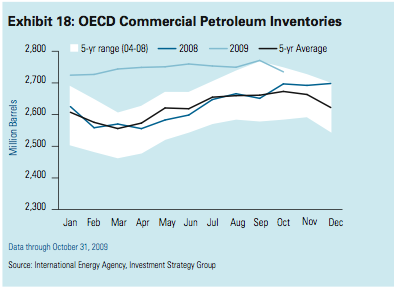
Looking globally, official Organisation for Economic Co-operation and Development
(OECD) inventories stand at a strong 2.73 billion barrels, as shown in Exhibit 18. According to the International Energy Agency (IEA), there is another 150 million or so barrels of crude oil and products stored in tankers in the high seas; you may have noticed a recent article in The Wall Street Journal about how the oil tankers used as floating storage off the coast of southeast England have raised concerns about a possible oil spill that could ruin the area’s beaches!12
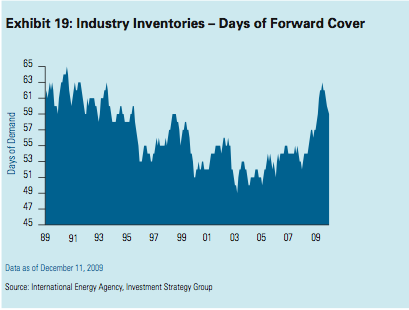
At these levels, inventories cover 59.4 days of OECD consumption (reliable inventory data on all emerging countries is not readily available).Exhibit 16:
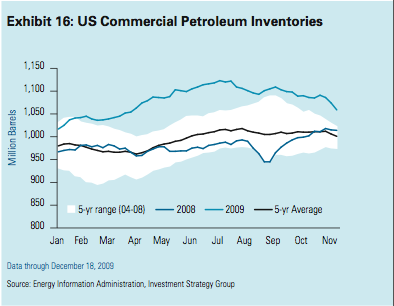
US CommercialPetroleum Inventories Exhibit 18: OECD Commercial Petroleum Inventories
As can be seen in Exhibit 19, this coverage ratio is substantially above the 20-year low of 49.3 days and not far from the 20-year high of 64.6 in 1990. Such high levels of inventory coincide with lower levels of demand. In the US, total petroleum product demand is 8.9% below its 5-year average.
With such high levels of inventory as a backdrop, small supply and demandimbalances become a little less critical. And as is typical in the oil industry, there is a wide range of estimates on supply, demand and excess capacity. It is clear that the rebound in global growth will reverse the drop in demand we saw in 2009. IEA estimates that oil demand will increase by about 1.5 million barrels per day (b/d) (Exhibit 20).
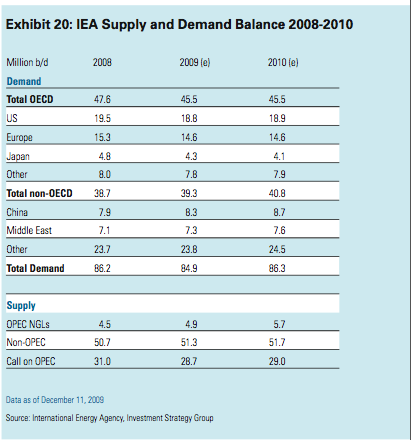
At the low end of the range, OPEC estimates an increase of about 800 thousand b/d, while our colleagues at Goldman Sachs Global Economics, Commodities, and Strategy (ECS) Research estimate 2.2 million b/d. The average of 8 highly- regarded forecasters is about 1.3 million b/d. This incremental demand can be met from both OPEC and non-OPEC sources.
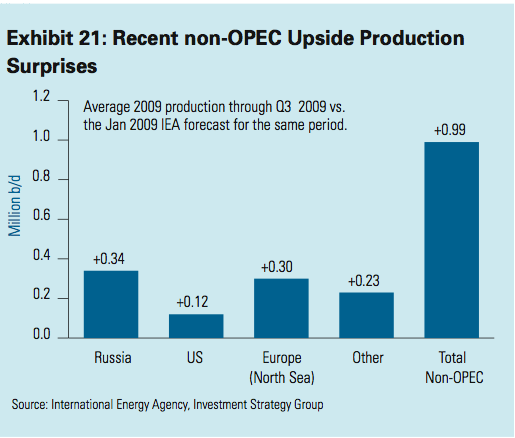
On the supply side, the IEA estimates an increase in non-OPEC supply of about 400,000 b/d and an increase in OPEC Natural Gas Liquids (NGLs) of about 900,000 b/d. The call on OPEC supply is estimated to increase by about 230,000 b/d. In the most optimistic scenario, FACTS Global Energy estimates supply exceeding demand by about 1.5 million b/d; in a more pessimistic scenario, our colleagues at Goldman Sachs’s ECS Research expect a short-age of about 580,000 b/d. We should note that in spite of repeated warnings of depleteing oil wells, non-OPEC production has actually surprised to the upside in 2009, as shown in Exhibit 21, by about 990,000 b/d.
It seems to us that with a combination of high inventory levels, increased production in non-OPEC countries, marginal increases in OPEC crude production and increases in OPEC NGL production, prices do not have much further upside from current levels, barring a major geopolitical event. Even if economic growth exceeds our expectations and drives up consumption, OPEC spare capacity is quite significant. As shown in Exhibit 22,
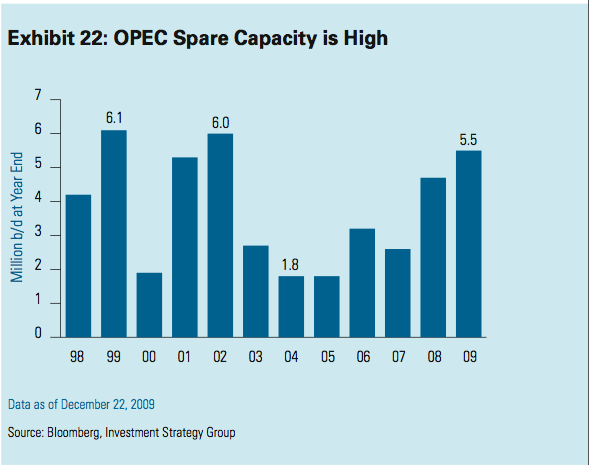
year-end 2009 spare capacity is estimated at 5.5 million Exhibit 19:
Industry Inventories – Days of Forward Cover b/d, which is 3.7 million b/d above the low levels seen in 2004 and 2005. This spare capacity is expected to increase by up to 1 million b/d in 2010 and excludes any growth in Iraq’s production capacity. While Iraq’s future production capacity is highly uncertain given the structural and political problems the country faces, it is reasonable to assume that the increase in productionwill be over 2-3 million b/d in the next few years. In the last year, Iraq has signed deals with several major oil companies including Exxon Mobil, BP, Royal Dutch Shell, China National Petroleum Corporation and Eni with incentives to increase production quickly. In fact, some have estimated an increase in production capacity by as much as 10 million b/d by 2020.
For the near term, we estimate prices will range between $60-85 per barrel. The low end of the range among major contributors to the Bloomberg consensus survey for year-end 2010 is $60. Goldman Sachs research is at the high end at $95 per barrel.Some OPEC members have indicated a preference for stable prices in the $70-80 range; the futures curve for end of 2010 is $80 per barrel. With current prices at about $74 per barrel and 6-month realized volatility at 36%, we do not believe that a tactical overweight to oil is warranted at this time. While we realize that “financial buyers” may drive short term prices higher, we think that the supply and demand factors point toward stable or slightly declining prices. Furthermore, our view of muted inflation for the next two years does not provide any tailwind and our favorable view of the dollar might actually provide a slight headwind to sustained oil price increases.
“Peak Oil” and the Long-Term Upside
One of the common themes that pervades most oil discussions is the impending shortage of supply to meet the increasing demand from emerging markets. People conjure images of hundreds of millions of cars in China and India juxtaposed with declining production in non- OPEC countries, attacks and kidnappings in Nigeria’s Niger Delta and 24,000-foot deep wells in the offshore Tupi field in Brazil. Such discussions end with a conclusion that oil prices are on a significant upward trajectory. At the extreme, the discussion ultimately leads to “peak oil” – a point in time when the maximum rate of global production is reached, and after which production declines. In 1956, M. King Hubbert predicted peak oil production in the US between 1965 and 1970 (US peak production was, in fact, reached in 1970) and globally by 2000 (this obviously has not occurred, and we do not expect it to in the foreseeable future). Peak oil theorists generally believe that supply shortages will be very disruptive to global economies.
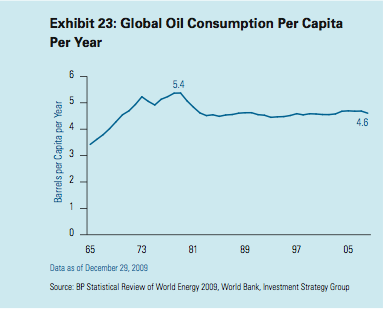
We do not believe in peak oil. First, improvements in energy efficiency and concerns about carbon emissions have led to a decline in global oil consumption per capita per year since 1979, as shown in Exhibit 23.
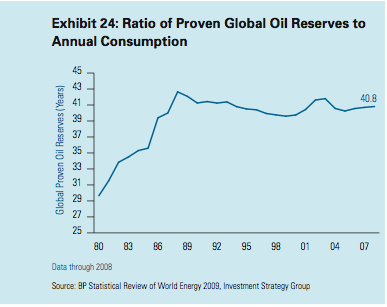
Even more amazing to us is the fact that the ratio of proven global oil reserves to consumption has held quite steady near the 40-year level; in other words, in spite of increasing overall consumption and depletion of reserves of many fields, proven global oil reserves have steadily increased with consumption to maintain this reserve to-consumption ratio, as shown in Exhibit 24.
In addition, technological improvements in exploration and production have increased recoverable reserves from existing fields and made deep-water fields such as Tupi accessible. In spite of earlier predictions that no major finds were going to occur, these discoveries have surprised to the upside, as shown in Exhibit 25.
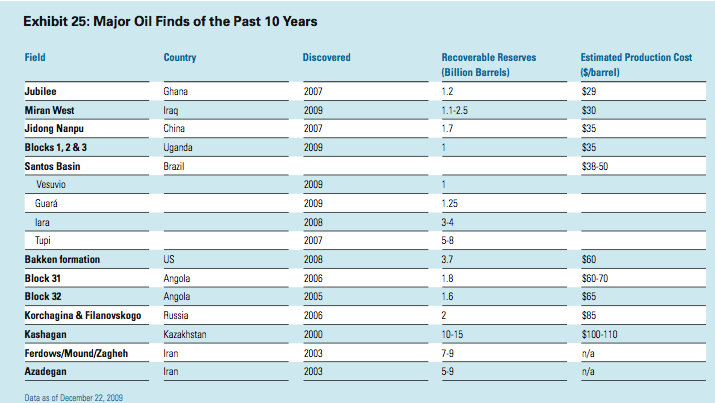
For example, in 2008, the US Geological Survey reported 3.65 billion barrels of undiscovered technically recoverable oil in the Bakken formation in North Dakota. While production in the Bakken dates back to 1970, improvements in horizontal drilling and hydraulic fracturing and the higher prices that make such techniques economical have increased the recoverable reserves substantially. In another example, Chevron has been trying to extend the life of one of the world’s oldest oil fields, the Kern River, by using enhanced recovery techniques involving high-technology temperature sensors to monitor production.13 It is worth noting, incidentally, that not all the discoveries will require higher production costs.
Outside the United States, the potential for significant discoveries is also high. As shown in Exhibit 26, with the exception of North America and Latin America, most of the drilling activity is small relative to the current estimates of proven world reserves: the Middle East holds 60% of the world’s proven reserves, yet accounts for only 15% of the world’s drilling activity; Africa has 10% of the proven reserves, yet accounts for just 4% of drilling activity.

In our view, the peak oil theories are alarmist and unwarranted. After steady price increases in the 1970s from a low of $1.80 per barrel to a high of $44 per barrel (which is equivalent to $109 per barrel in today’s dollars), it was common to hear about production peaks and long term oil shortages. Some 30 years later, the message is being repeated. However, we go back to Economics 101: higher prices beget higher supply, albeit with some lag and at higher marginal costs. So while we don’t believe in oil short- ages in the foreseeable future, we do think that, on average, marginal costs will be higher, thereby putting a floor on prices and supporting a sustainable increase in prices toward the $80- $100 range over the next several years.
Our expectation of broadly higher prices represents only a modest and gradual increase over current levels, and it is not significant in the context of oil’s volatility level (which averaged about 40% over the past decade). As such, we don’t believe that investing in oil futures is an optimal long-term solution at this time.
Furthermore, contango will be a persistent drag on returns and short-term downside risk, given oil’s volatility, is significant.
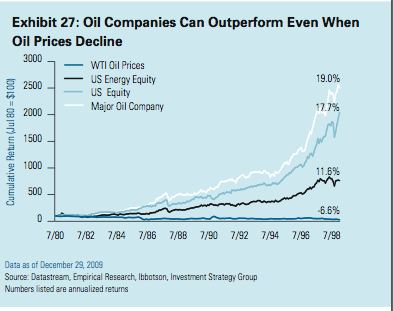
For those who have a strong bullish view, we recommend investing through the public or private equity market, where an effective operator can add value in the long run irrespective of the direction of prices and provide some downside protection should oil prices decline to the low end of our 12-month range (which, as noted above, is $60-85 per barrel). Exhibit 27 shows how a major oil company performed well over an 18-year period where oil prices declined over 70% in nominal terms.