
Daily Updates
Editor Note: Money Talks highly recommends that you make a regular trip to this monday morning site to this Don Vailoux monday report where he analyses an astonishing 40 to 50 Stocks, Commodities and Index charts and, provides a “Bottom Line” and some very interesting commentary.
– a few of the 40+ charts and commentary below. Full site HERE.
Ed Note: Be sure to read the The Bottom Line below this brief commentary. A few of the 40 charts below:
What happened during the last 30 minutes of trading on Thursday? At best, the sharp drop by U.S. equity indices looks suspicious. It happened during a time when most traders already were gone for the holiday. A few traders, who knew the location of stop loss orders, probably sold futures down to the trigger points (most likely in the S&P 500 futures market) which, in turn, triggered automatic computerized selling. Weakness in individual stocks, that are part of the Index, was not a factor. An examination of technical action by individual stocks that were part of the Index showed that only three stocks (Ensco, Health Care REIT and Rowan Companies) broke support.
The next major anticipated event is calendar fourth quarter earnings reports Consensus estimates show strong growth in most sectors compared to depressed earnings reported during the same period last year. Consensus for fourth quarter earnings by S&P 500 companies is an increase on a year over year basis of 203%. Excluding the financial service sector, consensus is a year over year gain of 8%. Of greater importance, the reports will include upbeat guidance for 2010. CEOs of major companies like to release upbeat comments when fourth quarter and annual results are released. This year, they will have lots to cheer about. According to Thomson Reuters, S&P 500 profits on a year over year basis are expected to rise 37% in the first quarter of 2010, 22% in the second quarter and 22% in the third quarter.
Technical parameters (Bullish Percent indices, Up/Down ratios, Percent of stocks trading above their 50 and 200 day moving averages, short term momentum indicators) are intermediate overbought. Last week they showed for the first time since October that they are experiencing resistance to additional strength. A correction to 50 day moving averages by major U.S. and Canadian equity indices would not be unusual implying short term downside risk ranging between 2% and 7%. Short term weakness into January will provide an opportunity to add to favoured seasonal positions or to introduce new seasonal trades.
The traditional period for the Santa Claus rally from December 15th to January 6th is approaching an end.
Weather conditions in North America continue to have a temporary negative influence on the economy and equity markets. Economic data for December to be released in January could imply a stall in the recovery due to extraordinary cold and stormy weather.
Seasonal influences in the month of January are mixed at best. During the past 10 Januarys, the TSX Composite has gained an average of 0.40% per period, fifth strongest month of the year. The S&P 500 Index lost an average of 1.63%, third worst month of the year. Other well known North American equity indices did not fare much better. The Russell 2000 Index gained 0.37% per period, the NASDAQ Composite Index slipped 0.14% and the Dow Jones Transportation Average dropped 1.75%. International equity markets also fared badly: The Nikkei Average lost 1.59% per period, the London FT Index plunged 3.31%, the Frankfurt DAX Index gave up 2.00%, the Paris CAC Index fell 2.21% and the Australia All Ordinaries Composite Index slipped 1.00%.
Selected sectors perform well in January. According to Thackray’s 2010 Investor’s Guide, top performing sectors since 1990 (in order of performance) were Information Technology, Consumer Discretionary and Financials. Poorest performing sectors (in order of performance) were Consumer Staples, Utilities and Energy. Please note that the Information Technology sector tends to outperform during the first half of January and the energy sector tends to underperform until the second half of January.
Currency trends will have a significant influence on equity markets. Technicals suggest that the U.S. Dollar likely will remain under short term pressure early in January. That could support U.S. equity markets. However, the U.S. Dollar also has a period of seasonal strength from January to April. Weakness early in January likely will be shallow.
The four year presidential cycle suggests that U.S. equity markets likely will be flat to slightly lower in January and February followed by a significant upside move thereafter. See comments below on the outlook for 2010 for additional comment.
Money flows into equity markets are positive early in January. Year end bonuses and upwardly revised pension contributions add to equity buying.
The Bottom Line
‘Tis the season to adjust equity portfolios! Sectors reaching an end to their period of seasonal strength include gold, natural gas, agriculture, Canadian financial services and (in mid January) information technology. All have been profitable. Watch for technical signs to fine tune exit points. Other sectors are just entering their period of seasonal strength including small cap, silver, platinum and (after mid January) energy. (Ed Note: be sure to check out “An Outlook for North American Equity Markets for 2010” at the bottom of Don’s Website HERE.
The Dow Jones Industrial Average lost 92.04 points (0.87%) last week. All of the loss occurred in the last 30 minutes of trading on Thursday. Intermediate trend remains up. Its 50 day moving average has proven to be a significant support level. Short term momentum indicators are overbought and have rolled over. A test of its 50 day moving average is imminent. Seasonal influences are positive. Strength relative to the S&P 500 Index is negative, typical at this time of year.
The TSX Composite Index slipped 8.50 points (0.08%) last week. Intermediate trend is up. Resistance is at 11,816.33.The Index remains above its 50 and 200 day moving averages. Short term momentum indicators are overbought, but have yet to show signs of rolling over. Strength relative to the S&P 500 Index remains negative, but is showing early signs of improvement. Seasonal influences remain positive.

The U.S. Dollar added $0.10 last week. Short term resistance could be forming at 78.45 and near its 200 day moving average at 79.17. Short term momentum indicators are overbought and showing early signs of rolling over. Year end transaction by international companies placed a short term cap on the Dollar. A short term correction to its 50 day moving average at 76.04 is possible. However, its intermediate downtrend has been broken and the next trend has yet to be determined.

The Canadian Dollar eased 0.23 last week. However, volatility was exceptionally high. Early last week, the Dollar broke above resistance at 96.08 did not hold. Its three month trading range remains between 92.16 and 97.69. Rumors of buying by the Russian and Chinese central banks continue to circulate. Short term momentum indicators are neutral.

Gold and silver continue to show short term technical signs of bottoming. Modest weakness in the U.S. Dollar contributed to the recovery. Intermediate trend remains up. Short term support is forming at $1,075. Short term momentum indicators are recovering from oversold levels. Gold is approaching the end of one of its two periods of seasonal strength. A short term recovery is an opportunity to switch gold into silver.
Fear of Missing Out (FOMO)
Stockscores.com Perspectives for the week ending January 11, 2010
![]()
Stockscores Founder Tyler Bollhorn will be a featured speaker at the 2010 World Outlook Conference in Vancouver Jan 22 and 23. This is a great conference and this year, Tyler will be demonstrating the new Money Talks/Disnat Trading Challenge game.
Those interested in attending this conference should Click Here to visit the World Outlook website for more information and to register.
There are approximately 15,000 actively traded stocks on the major North American stock markets. That gives investors looking for a stock to trade a lot of choices. Good traders respond to these varied alternatives by being selective and taking the best of the best. Struggling traders end up taking marginal opportunities that may not have a high probability of success. What causes traders to trade marginal opportunities?
Most trading mistakes come down to one of three things:
- lack of trading knowledge
- succumbing to fear
- succumbing to greed
An experienced, well trained trader should know how to trade and identify good opportunities. Despite their knowledge and skill, many of these traders still take marginal trades because of one of the other two mistakes. Simply put, they are afraid that they will miss out on something good.
Get the $3,600 StockSchool Pro Free by just opening an account at:

- DisnatDirect named the number one Canadian brokerage for Traders by Surviscor! Open and Fund a brokerage account with DisnatDirect and receive the StockSchool Pro home study course free, including special Pro level access through the DisnatDirect client website. Offer only available to Canadian residents. For information, click here
Most traders can remember a time when they thought about entering a trade but decided not to because the set up was less than ideal. What makes the memory stick is when that trade turns out to be a great money maker. Being left on the curb as the bus is leaving the station on its way to Profit City is frustrating.
The next time a marginal trading opportunity comes along, we decide to take the trade. Essentially, we are reacting to our painful memory of missing out on the previous marginal trade that proved to be successful.
We are afraid of missing out, and are eager to make money. Blinded by fear and greed.
A marginal trade is marginal because it has a lower probability of success. Keep in mind that the nature of probability is that there will be instances when the low probability outcome occurs rather than the high probability outcome. Otherwise, we would be talking about certainty and not probability.
If you are looking at a marginal trade, it probably means that the expected potential for profit is less than 60%. That means that the trade will work some of the time. The problem is that we remember those times that it did work and take the trade the next time a similar set up occurs. But, because probability is not on our side, that reactionary trading decision often leads to a loss.
The real problem comes when our losses affect our confidence. With the losing trade fresh in our mind we tend to shy away from high probability trades because we are afraid of losing again. The problem is not the quality of the trade that we are considering but our conditioned response to risk as a result of taking a marginal trade.
Any time I have a streak of losers I find that I almost always have taken some marginal trades, those that do not quite fit my trading criteria. When I go back and analyze these trades I realize that the problem is not in my rules but the undisciplined application of my trading rules. By getting back to disciplined trading I almost always reverse my losing streak.
Our brains are wired to remember pain. The pain of missing out on a good trade can lead us to take a marginal trade. What good traders remember is that there are a lot of busses leaving the station. By sticking to their disciplined trading approach, good traders will find the high probability trades that provide some nice rides and for those marginal money makers that we miss, remember that there is always another bus.
![]()
This week, I ran the Stockscores Simple Market Scan on US stocks under $20. From the results of the scan, I look for stocks that have good chart pattern set ups. To see what I liked about each of the stocks that I picked, check out this week’s Stockscores Market Analysis video by clicking here.
![]()
1. HCF
HCF is breaking from an ascending triangle chart pattern, a good indication that an up trend is starting. Volume could be stronger in support of the breakout but with bullish market conditions, this stock should move higher. Support at $6.28.
2. SFL
The buyers have been in control of SFL for a few months but the stock had stalled in a 5 week consolidation pattern until Friday when it made a good break through resistance with a jump in volume. Support at $13.70.
Click HERE for the Speaker Lineup at the World Outlook Financial Conferance and click HERE if you want to learn from some of the timeless advice from some of worlds best traders including the very successful Tyler Bollhorn.
![]()
Tyler Bollhorn started trading the stock market with $3,000 in capital, some borrowed from his credit card, when he was just 19 years old. As he worked through the Business program at the University of Calgary, he constantly followed the market and traded stocks. Upon graduation, he could not shake his addiction to the market, and so he continued to trade and study the market by day, while working as a DJ at night. From his 600 square foot basement suite that he shared with his brother, Mr. Bollhorn pursued his dream of making his living buying and selling stocks.
Slowly, he began to learn how the market works, and more importantly, how to consistently make money from it. He realized that the stock market is not fair, and that a small group of people make most of the money while the general public suffers. Eventually, he found some of the key ingredients to success, and turned $30,000 in to half a million dollars in only 3 months. His career as a stock trader had finally flourished.
Much of Mr Bollhorn’s work was pioneering, so he had to create his own tools to identify opportunities. With a vision of making the research process simpler and more effective, he created the Stockscores Approach to trading, and partnered with Stockgroup in the creation of the Stockscores.com web site. He found that he enjoyed teaching others how the market works almost as much as trading it, and he has since taught hundreds of traders how to apply the Stockscores Approach to the market.
References
Get the Stockscore on any of over 20,000 North American stocks.
Background on the theories used by Stockscores.
Strategies that can help you find new opportunities.
Scan the market using extensive filter criteria.
Build a portfolio of stocks and view a slide show of their charts.
See which sectors are leading the market, and their components.
Disclaimer
This is not an investment advisory, and should not be used to make investment decisions. Information in Stockscores Perspectives is often opinionated and should be considered for information purposes only. No stock exchange anywhere has approved or disapproved of the information contained herein. There is no express or implied solicitation to buy or sell securities. The writers and editors of Perspectives may have positions in the stocks discussed above and may trade in the stocks mentioned. Don’t consider buying or selling any stock without conducting your own due diligence.
Spot 60 Minute Trends for Gold, Oil, Nat Gas, and Indexes
Welcome back everyone! It’s time to buckle up and get ready for another exciting year of trading.
When the market is moving on light volume I tend to focus on very short term plays to minimize my exposure to volatility. The past couple of weeks have been great for day traders and futures trades as we took advantage of the short term seasonal holiday rally in the broad market and also by shorting gold when bounces reached resistance levels.
This year I will be providing many more trades as I focus more on 60 minute trading charts to scalp the market with low risk quick reward setups. Also I will start providing futures trading analysis and signals for those who want to be more active and generate more income on a monthly basis.
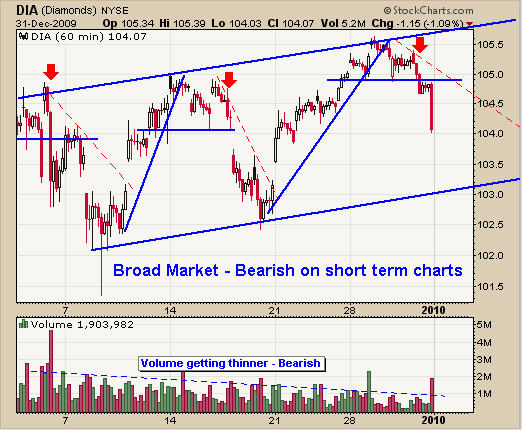
DIA – Dow Jones Exchange Traded Fund – 60 Minute Chart
The Dow has been trading in this range for a couple weeks providing some excellent short plays. Although I tell members not to short in a bull market, there are times when shorting in a bull market looks and feels right. The past month has been the perfect mix for shorting using the 60 minute charts.
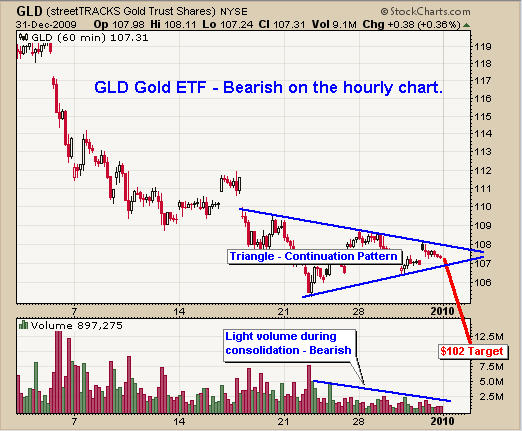
GLD – Gold Exchange Traded Fund – 60 Minute Chart
Gold is in a strong bull market but the short term charts have provided over 13 short trades in the past 2 weeks for futures traders playing the bounces to resistance levels. The triangle on the 60 minute chart with declining volume is a continuation pattern of the short term trend which is down.
Because gold is trading near a support level on the daily chart, I am waiting patiently for a perfect setup to go short, or long depending on what happens in the coming hours. I predict lower prices with $102 area for the next support level.
UNG – Natural Gas Fund – 60 Minute Chart
Natural gas is trading at resistance on the daily and weekly charts. This 60 minute chart allows us to take a closer look at the intraday momentum which clearly shows there are more sellers than buyers at this level. I see lower prices in the coming hours/days.
UNG not a good fund for holding positions more than 2 weeks, it does provide excellent trading opportunities for day traders and 60 minute chart setups.

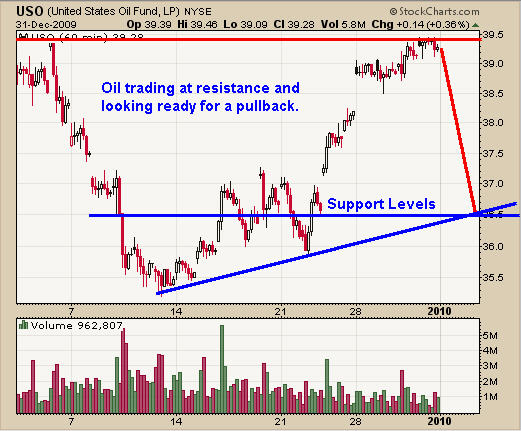
USO – Crude Oil Fund – 60 Minute Chart
Crude oil had a perfect bounce off of a support level on the weekly and daily charts back on the 14th. Oil is now trading at a short term resistance level and I feel it will head lower in the coming days. We still need more price action before taking a position. Let’s watch and wait.
Trends of Gold, Dow, Oil and Natural Gas Conclusion:
The broad market and commodities listed above seem to be trading at resistance levels with signs of rolling over. As a technical trader the charts do all the talking and they are pointing to lower prices in the near term which falls in line with my gut feeling that a sharp pullback across the board is lurking in January. Once the big money start getting pushed around again we will know who is in control, buyers or sellers.
Let’s continue to focus on these short term charts to take advantage of any low risk setups which come our way.
Sign up to get these Free Weekly Trend Trading Charts Emailed to you HERE.
Quotable
“I am not sure Chinese policymakers fully understand how vulnerable China is to trade war. This is perhaps because the “success” of the stimulus package has convinced them that they are less vulnerable to external demand than they originally thought. But this would be a serious misreading. The stimulus package has postponed the effect of declining net foreign demand on Chinese unemployment, but has actually increased its vulnerability by increasing the future gap between what China produces and what it consumes. China needs foreign demand to keep absorbing its excess capacity for several more years while it engineers the difficult transition to domestic consumption led growth, but I don’t see either China taking the necessary steps to force the transition or foreigners looking very eager to help China through the process.” – Michael Pettis
FX Trading – Bernanke Setting a Bad Precedent?
How badly does Ben Bernanke want to keep his job?
Frankly, I’m surprised he’d even sign-up for all the responsibilities and criticisms that come with being Fed chairman; just seems like it’s not worth it.
But so it goes for so many politicians and power-mongers in the upper echelon of social influence.
Former Fed Chairman Alan Greenspan – you might know him as The Maestro – obviously soaked up the fame and glory that came with his command over all things monetary. But since stepping down from his role as economic front-man for the “private” sector, Greenspan has been slammed for his role in creating and harboring asset bubbles.
……read more HERE.
For the better part of 2009 the U.S. dollar was the world’s most hated currency. But it’s looking increasingly likely the tables could turn in 2010. And the euro could take over that unenviable title.
In recent weeks we’ve seen a surge in scrutiny over sovereign debt. First, it was announced that Dubai would be “restructuring” its debt (i.e. default). And then the focus quickly turned toward the Eurozone’s weakest link — namely Greece.
This type of scrutiny can snowball quickly. Now other weak spots in the Eurozone, such as Spain, Italy, Ireland and Portugal are getting more attention. All of these countries are running massive budget deficits, many have huge debt burdens and all have muted prospects for growth.
That’s a recipe of trouble. Consequently, yields on government bonds in these countries have surged in recent weeks, reflecting the rising uncertainty surrounding their ability to meet debt obligations.
Investors are concerned about a spillover of debt defaults that could escalate into in a sovereign debt crisis. That is, debt defaults that spread throughout emerging market countries, perhaps even the industrialized world.
These problems aren’t new. And they’re occurring in the same European countries that have been vulnerable from the outset of the global financial crisis.
But the attention for much of 2009 has been squarely on the U.S. And because of that, these weak countries have gotten a free pass for quite a while.
Flaws of the Euro …
Countries that have joined the euro currency have unique challenges when economic times are tough. And we’ll likely find that the range of problems within the Eurozone will present a major threat to the euro’s lifespan.
The monetary union in Europe consists of a common currency and a common monetary policy. But fiscal policy is determined by each individual country. And to patrol those fiscal decisions, the European Union established its Growth and Stability Pact that, among other things, sets two criteria for member countries:
1) Deficit spending by its member countries cannot exceed three percent of GDP, and
2) Total government debt cannot exceed 60 percent of GDP.
As you can see in my table below, those limitations have been completely ignored by the countries that are having the biggest financial problems, exposing the structural flaws of the monetary union …
In short, the euro member countries are in trouble for all of the reasons Milton Friedman, one of the most influential economists of the 20th century, cited prior to the euro’s inception 10 years ago.
I’ll paraphrase four of Friedman’s statements and follow each with how it’s playing out:
A one-size fits all monetary policy doesn’t give the member countries the flexibility needed to stimulate their economies.
The European Central Bank’s mandate is inflation targeting, not growth. A premature exit from easy money policies could drive weaker European countries further into recession.
A fractured fiscal policy forced to adhere to rigid EU rules doesn’t enable member governments to navigate their country-specific problems, such as deficit spending and public works projects.
A majority of the sixteen countries in the monetary union have completely disregarded the EU’s Stability and Growth Pact by running excessive deficits.
Nationalism will emerge. Healthier countries will not see fit to spend their hard earned money to bail out their less responsible neighbors.
The cornerstone of the euro, Germany, has rejected the notion of big spending to bail-out troubled countries. And German citizens are in a protectionist mode.
A common currency can act as handcuffs in perilous times. Exchange rates can be used as a tool to revalue debt and improve competitiveness of one’s economy.
Under the euro, weak member countries are helpless. Italy has a history of competitive devaluations of the lira during sour times. Now, in the euro regime, its economy is left flapping in the wind.
Today, the most challenging issue facing the euro might be addressed in this statement by Friedman:
“Political unity can pave the way for monetary unity. Monetary unity imposed under unfavorable conditions will prove a barrier to the achievement of political unity.”
Milton Friedman saw the vulnerability of this single currency concept coming and predicted the euro’s demise within a decade. While the euro has outlasted that prediction, if a sovereign debt crisis defines 2010, look for the viability of the euro to come under attack again.
Regards,
Bryan
Bryan Rich is an accomplished currency specialist with more than 12-years of experience in trading, research, and consulting in the global foreign exchange markets. He is President of Logic Fund Management, a currency management and consulting firm.
Bryan began his career as a trader for a $600 million family office hedge fund in London. The macro-oriented fund managed assets for a prominent European family, and was one of the largest players in global currency markets in the 1990s. Later, he was a senior trader for a $750 million leading global macro hedge fund located in South Florida. There, he helped manage and trade a multi-billion dollar foreign exchange options portfolio.
His consulting resume includes work for a boutique currency fund in New York, where he developed trading models and strategy for the core investment program of the company. He later joined the company as a partner, based in their Wall Street office.
Bryan has also served for several years in a management and consulting role for the Weiss Group, performing in a variety of analytical areas across its economic research, money management, ratings, and institutional research divisions.
He has a BA from the University of North Florida and an MBA from Rollins College.
This investment news is brought to you by Money and Markets. Money and Markets is a free daily investment newsletter from Martin D. Weiss and Weiss Research analysts offering the latest investing news and financial insights for the stock market, including tips and advice on investing in gold, energy and oil. Dr. Weiss is a leader in the fields of investing, interest rates, financial safety and economic forecasting. To view archives or subscribe, visit http://www.moneyandmarkets.com.
-
I know Mike is a very solid investor and respect his opinions very much. So if he says pay attention to this or that - I will.
~ Dale G.
-
I've started managing my own investments so view Michael's site as a one-stop shop from which to get information and perspectives.
~ Dave E.
-
Michael offers easy reading, honest, common sense information that anyone can use in a practical manner.
~ der_al.
-
A sane voice in a scrambled investment world.
~ Ed R.
Inside Edge Pro Contributors

Greg Weldon

Josef Schachter

Tyler Bollhorn

Ryan Irvine

Paul Beattie

Martin Straith

Patrick Ceresna

Mark Leibovit

James Thorne

Victor Adair