
Daily Updates
From Dennis Gartman – “Turning then to gold, let us mince no words: yesterday was not fun. Yesterday was horrible; yesterday was the type of trading session that does indeed “try men’s souls. But yesterday was a correction along a well defined bull market, and yesterday was consistent with past corrections in gold”
“However, let’s keep things in perspective. If one were dealing with a stock that had sold Wednesday afternoon on the NYSE at $123.40/share and saw that it was trading Thursday morning at $119.75, one would take that price change very much in stride for that would seem like random noise and little more. Yet, this is simply what spot gold has done if we move the decimal point on gold one place to the left. The percentage changes are the same, but a $34/ounce tumble in gold seems far more serious than does a $3.40/share tumble in a $123.40 stock. Perception oft times becomes reality in the world of commodities, and that is what is taking place in gold at the moment.”
“With crude oil tumbling $7/barrel this week and with stock prices under pressure and with margin clerks looking about for pools of liquidity into which to dip, is there any wonder why gold sold off sharply? No really there is not. The wonder, in retrospect, is how well it withstood weak crude and weak stocks previously!” Dennis Gartman For a Trial Subscription go to The Gartman Letter
Gold prices: A bad day at the office
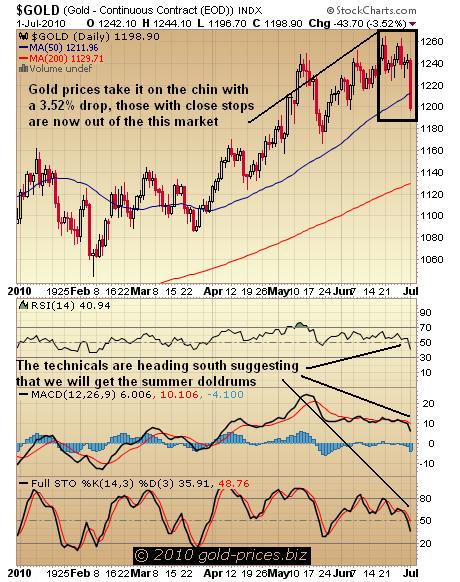
A strange day indeed where we see both silver and gold prices get hammered, the US Dollar knocked down from 86 to 84.6 on the US Dollar Index, the DOW down 40 points or so and WTI Crude now trading at around $72.66, nowhere to run and nowhere to hide.
As the chart depicts gold prices took it on the chin with a 3.52% drop, the technicals are heading south suggesting that we could be in for a lackluster summer. The summer being all of two months, July and August and in the past we would look to be buying in August, so as we see it the summer is a tad more than one month. If you are a very nimble trader you may be able to come out and go back in at lower levels, but that strategy does not do it for us. We will sit through it and look for bargains should there be a decent dip. (continued below the chart)
This might help you to keep your sea legs as the bears leap into life and short their fur off, its a missive just in for Jim Sinclair which we think sums up the situation pretty well.
There are times when you must ignore the hedgie madness in the marketplace and revert to why we are doing what we are doing.
The deflation being spoken of today is the catalyst for the coming hyperinflation. The fact is it has been so in all historic examples. The flooding of markets with debt has been brought on for different reasons, but the ways and means of hyperinflation has always been the same.
Therefore it is today’s financial market deflation talk that is the reason why you should own gold.
This continued downturn in business will find government in a panic, not in austerity when their constituency does the Greek dance of panic as the pain on Main Street becomes intolerable. It will.
Contemplate what each of the following means to you one at a time. Do not try to do them all at once. You do not want to do this as a routine memory exercise as much as a meditation on why you have bought the insurance you have.
-Gold is a currency with no liabilities attached.
-Gold is competition to paper currency.
-Gold is not a commodity.
-Gold is a barometer of fear.
-Gold is a barometer of confidence in Government.
-Gold is insurance.
-Insurance is not something to trade.
-Gold is money when money fails.
-Hyperinflation is a currency event, not an economic event.
-Hyperinflation is a currency event described as a loss of confidence in the currency.
-Gold in your hand eliminates counter-party risk.
-Gold is the high ground when the global tsunami hits.
-Gold removes financial agents between you and your assets.
Be strong in your conviction and do not be bothered by the return of the Prechterites and top callers.
Respectfully,
Jim
As Michael Campbell says about Richard Russell…”Ignore him at your peril”
Wall Street to Bay Street says: Anyone who hasn’t read any Richard Russell I would highly recommend. He has one of the longest (if not the longest) market newsletter out there and it is filled with tremendous insights from the last 75+ years. Here is a snippet from his latest post:
…….read Whats Next HERE
Technical Analysis and comment by the highly respected Don Vialoux of Timing the Market HERE for more information.
Technical Action Yesterday
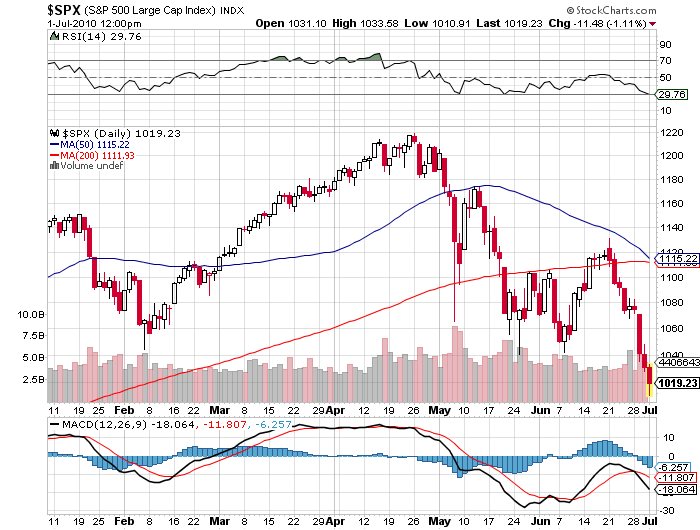
Technical action by S&P 500 stocks was substantially bearish. No S&P 500 stocks broke resistance and another 52 stocks broke support. The list of stocks was too long to include in this report. The Up/Down ratio fell from 0.66 to 9156/283=) 0.55.
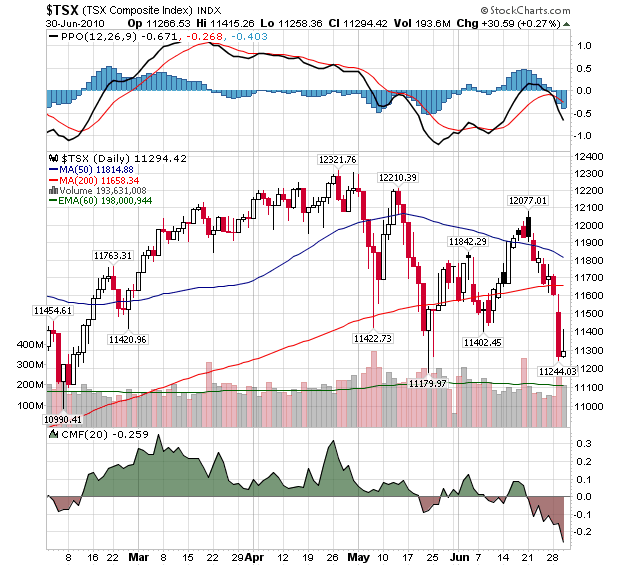
Technical action by TSX Composite stocks also was bearish. No TSX Composite stocks broke resistance and four stocks broke support (Manitoba Telecom, Sherritt, Taseko Mines and Sino-Forest). The Up/Down ratio slipped from 0.92 to (85/95=) 0.89.
The Dow Jones Industrial Average has support at 9,757.55. A break below support completes a bearish head and shoulders pattern.

The Dow Jones Transportation Average has support at 3,983.18.
Interesting Charts
Two more S&P sectors broke key support levels:
Wheat and corn prices rose sharply yesterday following a crop report. The grain ETN (JJG) recorded a significant gain. The Ag sector is on the radar screen for a possible seasonal trade later this month if improving grain prices are sustained.
Read the Stock Market Outlook for July 1st from Equity Clock HERE. Equity Clock’s mission is to identify periods of reoccurring strength among individual equities in the market using methodologies presented by some of the top analysts in the industry, including that of Don Vialoux, author of TimingTheMarkets.com.
2010: A Time When Stocks Got Cheap, Then Cheaper, Then Dirt Cheap
If the move in equities and, in particular, large-cap tech (think Microsoft (MSFT), Cisco (CSCO) and Intel (INTC)) over the past two months are precursors for what lies ahead in the second half of 2010, we feel that most investors are going to be highly disappointed with where equities go from here. Still in denial about the re-emergence of the secular bear, perhaps continued moves lower in the aforementioned blue chip tech stocks will wake investors up to 2010’s market reality: valuations are being compressed.
Worse yet, valuations will become even more compressed as the year wears on. While various market pundits continue to rightfully point to a number of very disconcerting macro factors to explain the recent move back into bear market territory for equities, why not simplify matters for investors by stating that this is what happens at the tail end of secular bear markets: stocks get cheap, then cheaper, and then dirt cheap before a generational bottom can be hit.
The Inflection Point (TIP™) is a weekly long/short market newsletter focused on market trends and companies at important inflection points in both their business models and technical stock formations. TIP™ is produced each week by John Henderson, an independent trader who turned $10,000 into $4.5 Million during his tenure at Smith Barney in the 1990s, and his team of market professionals including Jason George, Tom Henderson, an Executive MBA student at NYU’s Stern School of Business, and Mike McCausland.
-
I know Mike is a very solid investor and respect his opinions very much. So if he says pay attention to this or that - I will.
~ Dale G.
-
I've started managing my own investments so view Michael's site as a one-stop shop from which to get information and perspectives.
~ Dave E.
-
Michael offers easy reading, honest, common sense information that anyone can use in a practical manner.
~ der_al.
-
A sane voice in a scrambled investment world.
~ Ed R.
Inside Edge Pro Contributors

Greg Weldon

Josef Schachter

Tyler Bollhorn

Ryan Irvine

Paul Beattie

Martin Straith

Patrick Ceresna

Mark Leibovit

James Thorne

Victor Adair