

 It could be 2017 before the commodity supercycle is evident again, but stormy weather in the mining space has a silver lining: It is encouraging miners to develop new, innovative approaches to their business. In this interview for the first edition of
COMPANIES MENTIONED: ALPHA MINERALS INC. : AVRUPA MINERALS LTD. : DIAGNOS INC. : FIRST POINT MINERALS CORP. : FISSION URANIUM CORP.: LITHIC RESOURCES LTD. : MIDAS GOLD CORP. :NAMIBIA RARE EARTHS INC. : NEVADA EXPLORATION INC. : PEREGRINE DIAMONDS LTD. :PROBE MINES LIMITED : TASMAN METALS LTD. : URAVAN MINERALS INC.
The Mining Report: John, you have characterized the current resource market as a bear market unlikely to have higher metal prices in the next year, with the possible exception of zinc. Why are you drawing a different conclusion than other analysts who believe we are in a resource supercycle?
John Kaiser: I believe the general supercycle is still intact as nations with very large populations are embracing capitalist methods. Because they are starting with much lower standards of living, they have a long way to grow. However, I do think we are in a bit of a pause. We are still dealing with the fallout from the 2008 financial crisis, a dysfunctional political system in the United States and Europe’s issues.
Also, China’s growth rate is slowing and the country is shifting from a capital-intensive development of infrastructure and production capacity to more domestic consumption spending. On top of this, the mining industry generated a lot of supply in response to the higher real prices of the past decade. So there is a supply glut coming as demand cycles downward, and we’re going to see weak prices for a while. Unfortunately, or perhaps fortunately depending on what hat you are wearing, we have also seen rising costs, the response to which may curtail the supply glut sooner than expected.
I would say by 2017, however, the supercycle will be evident again, because this bear market is creating the same supply/demand imbalance conditions that existed 10 years ago, when the big bull market started.
TMR: What indicators will tell us we might see the supercycle in 2017?
JK: What we have to watch is the world’s gross domestic product growth. The International Monetary Fund scaled back expectations in its October World Economic Outlook. We also have to see how the U.S. deals with its debt ceiling problem, and the U.S. won’t get any traction until there is a political change where nothing blocks spending the money to get the economy ramping up again.
We also want to see which mines in the pipeline actually come onstream. This applies more to the raw materials that are used in the real world as opposed to gold, which is treated largely as an insurance policy hedging various future outcomes.
A lot of projects are being shelved right now because of escalating costs. All this misery that we’re witnessing will actually underpin a future bull market in the commodity sector.
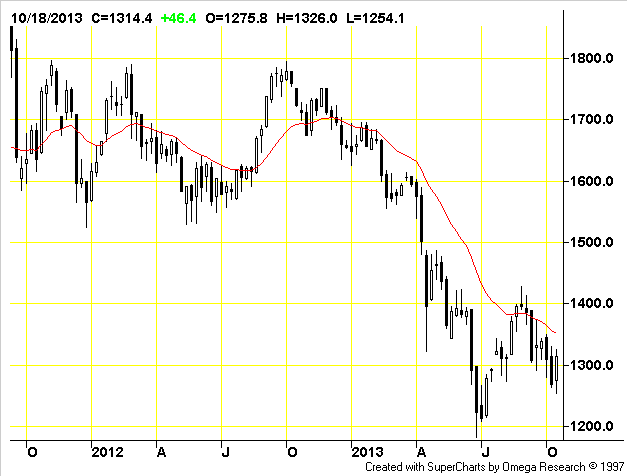
TMR: What gold price is required to make mines economic these days?
JK: The average all-in cost for gold production is about $1,200/oz. Even though we’re looking at a gold price that has increased three, four times since 1980’s stabilized price, the costs have risen right along with it. We need something around $1,500/oz-plus to justify putting a lot of these deposits into production.
TMR: Are the costs for getting copper out of the ground also higher than the selling price?
JK: In the past five years, we have seen above-average cost escalation in the mining sector. Both capital costs and operating costs have been increasing about 10% annually. In the case of copper, if your all-in cost was $2.49 per pound ($2.49/lb) in 2007 and you apply 10% inflation each year, you’re looking at a $4/lb copper price just to break even, and we’re currently at $3.20–3.30/lb.
Now some of these costs are going to come down, but we’re still looking at numbers that are at or higher than the current spot prices for gold and copper. It is not a wonderful situation for deposits where they have reduced the cutoff grade and started mining lower-grade deposits to meet the increase in demand. We’re in a situation where we’re going to have to just wait to see higher prices materialize to justify a fresh push of putting deposits into production.
TMR: If most of these commodities and the juniors that mine them are waiting for prices to go up, what does that mean for the juniors’ common exit strategy—being taken over by a major?
JK: During the past seven to eight years, we’ve had a tremendous round of takeover bids, where 200-plus Canadian juniors were taken over at a value of over $128 billion ($128B). A lot of these deposits are waiting to be developed. The other companies out there own deposits that tend to be lower grade and have a more expensive cost structure. There is no appetite amongst the majors right now for that type of deposit, and the capital markets are not going to be interested in directly funding development because the profit margin just isn’t there.
The one group that has not yet made a big move is Chinese sovereign wealth companies, which we know have been studying the landscape looking for opportunities. When these Chinese national companies start buying cheap gold assets, that will be a signal that the turnaround for gold is coming sooner rather than later.
TMR: While we’re waiting for that to happen, what strategies should investors know about when looking for companies that will be successful?
JK: Look for a company that has a high enough deposit grade so that even at the current metal price there is still a decent profit margin. These companies are available at bargain prices. One that I’ve recently recommended is Midas Gold Corp. (MAX:TSX), with its Golden Meadow gold project in Idaho, which has a grade of about 1.5 gram gold per ton (1.5 g/t), plus an antimony byproduct credit. This is significantly better than the 0.8 or 0.9 g/t deposits with their 5–10 million ounce (5–10 Moz) resources that everybody was excited about during the past few years. Midas Gold is working on its prefeasibility study; it has 5 Moz that it would mine over a 14-year period. You are not paying much of a premium to own this type of company.
TMR: Does the company have enough money in the bank to keep going?
JK: Yes. It recently raised almost $10 million ($10M) from Teck Resources (TCK:TSX; TCK:NYSE), a company that makes shrewd acquisitions. It’s counting on a lot more ounces being present than are already outlined. The company has a 9.9% foothold. Teck is a potential future exit strategy for Midas.
Franco-Nevada Corp. (FNV:TSX; FNV:NYSE) also paid $15M for a 1.7% net smelter return, which, based on the permitting timeline and the ore mining schedule that the company proposed in its Preliminary Economic Analysis (PEA), suggests a 19% discount rate for the future royalty stream. Both these investments, totaling $25M, have given Midas sufficient capital to complete the prefeasibility study expected sometime in the first half of next year.
TMR: So look for a company with a higher-grade deposit. What’s another strategy?
JK: I like the strategy of a discovery within a discovery that could completely eclipse the original low-grade resource. Looking for higher grade zones within the system is a way a gold junior can revitalize an existing deposit that doesn’t work at current low metal prices. One of the companies that I’m very enthusiastic about that’s doing just that is Probe Mines Limited (PRB:TSX.V). It made a grassroots discovery several years ago, which was one of these 4 or 5 Moz deposits of 1 g/t. Unfortunately, that deposit is not very valuable at $1,200–1,300/oz gold. However, the company continued to explore this system and found a higher grade zone. We’re talking about 5 to 10 g/t. The zone so far is very continuous.
Probe has also just finished some infill drilling and one step-out hole on the high-grade zone. We will get a resource estimate in early 2014. I’m estimating we will see ~1–1.5 Moz of about 5 g/t gold.
This finding is a surprise that has the company and many investors wondering, are we dealing with something a lot bigger? That’s the kind of blue sky that you want exposure to in this sort of market that we have now.
TMR: So look for a discovery within a discovery. Can you give us another approach?
JK: Look for companies that have an innovative target-generation strategy. All the easy gold that’s at surface has been found and harvested. You now have to look deeper. One that I have been focusing on for the last few years is Nevada Exploration Inc. (NGE:TSX.V), which uses a groundwater sampling technique to look for gold and Carlin-type pathfinder elements in northern Nevada, where we know there’s already been 300 Moz found, most of it on land that Newmont Mining Corp. (NEM:NYSE) and Barrick Gold Corp. (ABX:TSX; ABX:NYSE) control.
The general perception is that Barrick and Newmont have it all and there’s nothing really left outside of their holdings. However, before Nevada Exploration, nobody had a very good way of looking beneath the gravel covering the basins. One can argue that another 300 Moz remains to be found in Nevada. University of Nevada Reno’s John Muntean has proposed a geological “magmatic sweep” theory, which explains why northern Nevada has such a fabulous gold endowment laid down during a brief window 42-25 million years ago. Nevada’s more recent stretching that created its basin and range topography resulted in half the region “disappearing” as gravel filled basins. Regional sampling by Nevada Exploration has identified dozens of off-trend geochemical gold anomalies within the basins that suggest a gold deposit in the bedrock “under cover.” The market is skeptical, but if you get a big intersection on one of these off trend targets, you have a game that’s wide open. You get replication possibilities because everybody will want access once it has been demonstrated that any one of them could be a huge 5–10 Moz-plus discovery.
TMR: Sounds like an interesting target-generating approach. Any other strategies you think could work between now and 2017?
JK: Let’s shift to uranium exploration. A junior explorer, Uravan Minerals Inc. (UVN:TSX.V), has developed an interesting geochemical sampling method it is using on projects in the Athabasca Basin.
A big discovery event in the past year is the Patterson Lake South discovery in the Athabasca Basin byFission Uranium Corp. (FCU:TSX.V) and Alpha Minerals Inc. (AMW:TSX.V). This is a classic high-grade unconformity type of uranium deposit with grades of up to 20% uranium. The size of this discovery is stimulating interest in the potential for a new Athabasca Basin area play.
Uravan has spent the last five to six years developing its geochemical sampling method in collaboration with Queens University’s Kurt Keyser, which looks for the lead isotope decay products of a uranium deposit. These get absorbed by vegetation and clay particles. The company takes tree core samples at surface to find evidence of a resource that may be 1,000–1,500m deep. You still can’t tell the size of it or the grade, but at least you know you’re going to hit something once you drill down there.
This approach opens up a much deeper portion of the basin that has been largely out of bounds because of the difficulty in finding these deposits, which almost always are right at the unconformity between the basement rocks and the overlying sandstone rocks in association with graphite. The conventional targeting tool is a geophysical survey that looks for conductors representing these graphite beds. But deeper than 450m, these conductors become fuzzy just as drill holes that need to pinpoint the target become expensive. This is problematic because most of the graphite beds at the Athabasca Basin unconformity do not host a uranium deposit. Uravan’s radiogenic isotope based sampling tool allows the junior to see evidence of a uranium deposit at substantial depth from the surface. A case study done this summer apparently demonstrated that Cameco’s 850m deep Centennial deposit shows up as a well-constrained geochemical anomaly. Theory says that in the Athabasca Basin, the thicker the sandstone cover, the bigger and richer the potential uranium deposit at the unconformity. Uravan now has a tool that enables it to stalk super-elephants in uncharted territory.
Uravan can also perform this research as a service to companies that have claims in the Athabasca Basin and then earn a royalty or a small interest in exchange for generating the geochemical part of the target that you need to justify raising money for a high-stakes drill program.
Another company I cover, Diagnos Inc. (ADK:TSX.V), has developed computer algorithm-based methods for reassessing existing data sets. Most deposits are small and high grade, squirreled away inside complex geology. Diagnos loads data into the system and uses pattern recognition software to look within the data set to see what the previous exploration geologists didn’t see.
Juniors have spent millions of dollars on projects where they found smoke but no fire. Even though the previous exploration generated “negative results,” those results themselves constitute valuable information because one knows where not to look. Juniors can rent the services of Diagnos to take a fresh look at projects. Diagnos also collects a royalty when it generates the prospect from old assessment data and farms it out to another junior.
TMR: Another unique exploration model makes another good tactic. Any others you’d like to suggest?
JK: Let’s discuss the old-fashioned prospect-generator farm-out model. I’ve taken a shine to Avrupa Minerals Ltd. (AVU:TSX.V) because it focuses on an area nobody has been particularly interested in—Europe. Avrupa has claims in Portugal, Kosovo and Germany.
In Portugal, the company is rethinking the geology of the Iberian Pyrite Belt, which hosts world-class polymetallic volcanogenic massive sulfide ore deposits. Antofagasta Minerals Plc (ANTO:LSE) has been paying to earn its share of this project. Here you have the junior’s geologists coming up with an innovative reconceptualization of the geology that hosts the deposits, acquiring prospects, doing some basic work to dress them up and then attracting a major company to farm in to the project. The company has done something similar in Kosovo, a region that has not had modern exploration.
In eastern Germany and northern Portugal, areas both known for their tungsten production, Avrupa is applying the intrusive-related Fort-Knox/Pogo-style model to look for gold systems in areas where past mining and exploration has simply been focused on tungsten. This little company runs a tight ship. There are strong people in management and if we do get a general turnaround, this would be one of the first companies to acquire a higher profile.
TMR: We’ll add the farm-out model to the list. Any others?
JK: Yes, I’m excited about the prospects for zinc, and for a zinc junior, Lithic Resources Ltd. (LTH:TSX.V). I have been generally negative about the upside for metal prices, but zinc is one metal where I think we may get upside relatively sooner. There have not been a lot of big zinc deposits pushed into the development pipeline and yet we’re approaching a rapid shutdown of zinc mines due to depletion. Analysts are now predicting that zinc, which has been in surplus, will start to go into deficit by next year and this will worsen over the next five years. We are expecting zinc to reach $1.25–1.50/lb within the next year or two, which is much better than its current $0.80–0.85/lb level. If China continues to shift toward more domestic consumption, we can also expect demand for zinc to rise even as the supply is declining.
Lithic Resources’ West Desert deposit isn’t in the middle of nowhere; it’s in Utah, one of the more mining-friendly states in the U.S. This would be potentially partly open-pit for the oxide resource, but more likely underground for the sulfide resource.
Lithic’s PEA, produced several years ago, was essentially negative even at $1.10/lb zinc. However, the base case prices they used for the deposit’s copper, silver and gold were substantially lower than even today’s spot prices. By rethinking the PEA in contemporary spot prices, adding in a higher zinc price and throwing in the company’s rethinking of the magnetite as a waste product and treating it instead as a potential saleable product, things could develop rapidly.
Lithic is going to produce an updated PEA, probably by the end of the year. It will likely do some additional drilling to take care of some of the resource expansion potential. Then it will go into a resource feasibility demonstration and ultimately need to spend $20–25M on an underground program as part of a feasibility study. If we have zinc ramping up, there’ll be the capital available to make this happen.
Last year, there were some significant management changes at the company, when some very experienced people were brought on board who were CEOs of two different companies, which were bought out for a total of $4.5B. There’s also a hedge fund that is now a significant stakeholder in the company. This one’s all teed up and ready to go.
TMR: Interesting take on zinc as a strategy. Any thoughts about rare earths?
JK: I’m interested in Namibia Rare Earths Inc. (NRE:TSX, NMREF:OTCQX) as a shorter-term solution to the future heavy rare earth element (HREE) shortage. The HREE deposits we’ve identified in the West, such as Quest Rare Minerals Ltd.’s (QRM:TSX; QRM:NYSE.MKT) Strange Lake deposit and Tasman Metals Ltd.’s (TSM:TSX.V; TAS:NYSE.MKT; TASXF:OTCPK; T61:FSE) Norra Karr deposit, are world-class deposits, which, once they come onstream, will take care of the world’s HREEs for a very long time. However, these deposits are not going to come onstream tomorrow.
The shorter-term solution that has caught my attention, Namibia Rare Earths, has discovered a HREE-enriched zone that is low grade—the Lofdal Area 4 property within the larger Lofdal carbonatite complex. By “enriched” I mean 85% or higher HREE compared to 40–50% for Strange Lake and Norra Karr. The company will release some metallurgical studies in about a month, which will tell us if it can produce a concentrate that could be shipped to a company like Molycorp (MCP:NYSE) or Rhodia Group (RHA:NYSE) for separation.
Within three years, I could see Namibia Rare Earths supplying a significant amount of HREEs, which make up 80–90% of the ore, furnishing about 50% of non-Chinese demand, all of which is currently supplied by China’s depleting HREE enriched deposits. That’s much faster than the four to six years we can expect for any of the bigger projects.
TMR: So another good strategy: a rare earth junior who might get to market faster. Let’s keep going.
JK: Let’s talk about nickel, another unpopular metal, currently around $6.25/lb. Used in stainless steel, it was selling for $25/lb in 2007. A seemingly unlimited supply of nickel pig iron is haunting the market right now. Nickel pig iron is made in Chinese blast furnaces from low-quality laterite ore direct shipped from Indonesia and the Philippines, which have in recent years emerged as the world’s biggest nickel suppliers. Experts are pretty negative about the supply/demand surplus deficit in the next four years, but by 2018 they expect this to reverse.
A company that’s caught my attention is First Point Minerals Corp. (FPX:TSX.V), which for the past five years has been looking at a different style of nickel mineralization called awaruite, a naturally occurring alloy of nickel and iron that is quite low grade. It’s 75% nickel, 25% iron and exists as small grains within the ultramafic rock. You can use simple magnetic and gravity separation techniques to get this out.
Cliffs Natural Resources Inc. (CLF:NYSE) is the partner on one of these projects for a big open-pit 110,000 ton per day operation for which the PEA was published earlier this year.
Frankly, at the current price of nickel that project is close to being worthless. However, because of the nature of the production, if we saw higher nickel prices driven by higher energy costs or chemical costs, First Point’s cost structure would not be affected in the same manner because the only significant energy costs the company has is for grinding the rock, which all the sulphide producers share.
Cliffs is interested in developing a North American supply of nickel, which would not experience the same cost inflation as competing sulfide and laterite deposits. I think that when the company completes the prefeasibility study in a couple of years, we will see that it has optimized the project and that this is a profitable project even at $6/lb nickel.
By then we will start seeing that the Philippines’ supply of laterite for nickel pig iron production is not infinite and that perhaps Indonesia has put a stop to exporting raw ore. Then once again we’re caught off balance because the big guys during the interim have had to scale back their development plans because of this current glut of supply that’s depressing the metal prices. It’s a bit of a longer-term speculation, but it’s based on a different processing style targeting a different type of mineral.
TMR: Can you give us one more idea that’s completely different?
JK: OK, how about diamonds? Peregrine Diamonds Ltd. (PGD:TSX) has a bulk sample that’s in the midst of being processed. We may even see results before Christmas. If there are big beautiful diamonds inside that bulk sample, suggesting a high-carat value, then this stock will be ready to participate in what I think is a revival in the diamond sector.
We know that as long as the world doesn’t go into a depression, demand for quality diamonds will continue to grow. Explorers have not found any giant diamond mines in a very long time, and no big new diamond mines are coming onstream. Peregrine Diamonds has been in the doghouse for a few years, but I think it is poised for a bit of a revival. To me, this is a very attractive play in this sector.
TMR: When will we find out if this bulk sample is valuable?
JK: The 500-ton sample, if it runs 300 carats (300 ct) per hundred tons, should deliver 1,500 ct. That is a large enough parcel to allow a formal valuation that will tell us what kind of value we would get when we go into commercial production. What we’re always looking for is a type of Holy Grail—a high-grade pipe with a high value. This sample, which they hope to have out before Christmas, or the first week or two in January, could change the market’s perception of this project dramatically.
TMR: Interesting. Can you leave us with advice for investors who are trying to survive 2013, or as Rick Rule says, thrive, because fortunes are made in bear markets rather than bull markets?
JK: Fortunes are made in resource sector bear markets by those with great patience, especially when you target juniors with deposits that are near worthless at prevailing metal prices. However, if higher real metal prices take a long time to arrive, such juniors run the risk of diluting away their upside to stay alive, or getting swallowed cheaply by predators with deep pockets and even greater patience. Most investors do not have Rick Rule’s capacity to influence the destinies of the companies in which they make investments. The resource sector juniors that I generally target in the current bear market climate are ones with innovative stories that can flourish and create shareholder value whether or not higher metal prices materialize. If we do get into a stronger overall market, it’s companies like these, which have well-articulated stories, that will accelerate out of the bottom faster than other companies with deposits that require a substantially higher metal price to be back in the money.
TMR: Thanks for giving us that wrapup. We appreciate your time.
JK: You’re welcome.
John Kaiser, a mining analyst with 25+ years of experience, produces Kaiser Research Online. After graduating from the University of British Columbia in 1982, he joined Continental Carlisle Douglas as a research assistant. Six years later, he moved to Pacific International Securities as research director, and also became a registered investment adviser. He moved to the U.S. with his family in 1994.
Want to read more Mining Report interviews like this? Sign up for our free e-newsletter, and you’ll learn when new articles have been published. To see a list of recent interviews with industry analysts and commentators, visit The Mining Report.
Related Articles
- John Kaiser’s Strategies for Success in a Bloody Market
- Three Essentials to Look for in Junior Mining Equities: Derek Macpherson
- Thibaut Lepouttre: Juniors That Can Deliver the Goods
DISCLOSURE:
1) JT Long conducted this interview for The Mining Report and provides services to The Mining Report as an employee. She or her family own shares of the following companies mentioned in this interview: None.
2) The following companies mentioned in the interview are sponsors of The Mining Report: Probe Mines Limited, Namibia Rare Earths Inc., Tasman Metals Ltd. and Fission Uranium Corp. Streetwise Reports does not accept stock in exchange for its services or as sponsorship payment.
3) John Kaiser: I or my family own shares of the following companies mentioned in this interview: First Point Minerals Corp., Lithic Resources Ltd., Namibia Rare Earths Inc., Avrupa Minerals Ltd., Uravan Minerals Inc., Nevada Exploration Inc., Peregrine Diamonds Ltd. I personally am or my family is paid by the following companies mentioned in this interview: None. My company has a financial relationship with the following companies mentioned in this interview: None. I was not paid by Streetwise Reports for participating in this interview. Comments and opinions expressed are my own comments and opinions. I had the opportunity to review the interview for accuracy as of the date of the interview and am responsible for the content of the interview.
4) Interviews are edited for clarity. Streetwise Reports does not make editorial comments or change experts’ statements without their consent.
5) The interview does not constitute investment advice. Each reader is encouraged to consult with his or her individual financial professional and any action a reader takes as a result of information presented here is his or her own responsibility. By opening this page, each reader accepts and agrees to Streetwise Reports’ terms of use and full legal disclaimer.
6) From time to time, Streetwise Reports LLC and its directors, officers, employees or members of their families, as well as persons interviewed for articles and interviews on the site, may have a long or short position in securities mentioned and may make purchases and/or sales of those securities in the open market or otherwise.


 This is what I believe the theme of our times is. We are in a period where the “haves” are determined to hold on to their positions in the world. The “haves” include the world’s leaders and politicians, and the world’s “masters of the earth,” which includes those who control the world’s money.


