
Stocks & Equities
One of the most remarkable aspects of the rally in the S&P 500, apart from the fact that it has coincided with the worst economic recovery in US history, is its high correlation with the expansion of the Fed’s balance sheet.
This is something that former chief North American economist at Merrill Lynch David Rosenberg has been at pains to point out.
As you can see from the chart below from Canadian asset manager Gluskin Sheff, where Rosenberg is now chief economist, when adjusted for the Fed’s expansion since 2009 there has been no bull market.
Put another way, the US stock market has risen dollar for dollar over the last four years.
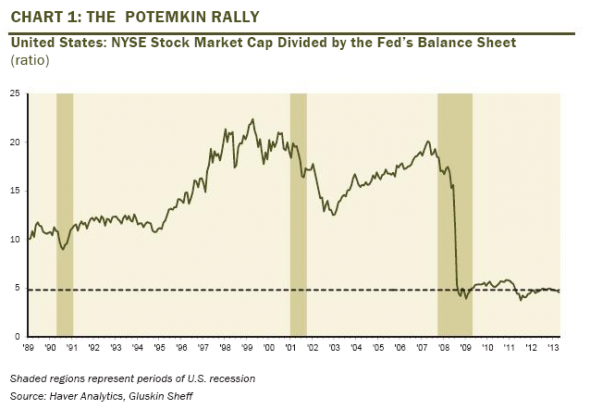
In the absence of decent earnings growth (now in single digits) this poses an important question for long-term investors: What happens when the Fed starts to unwind QE and shrink its balance sheet?
If the correlation between stocks and Fed balance sheet expansion holds, we can expect significant downside ahead.
As Bill (Bonner) l says, it’s summer. Trading volume is light. Most traders and investors are on vacation.
But come the fall there’ll be plenty of focus on the Fed’s exit strategy. First, we’ll have the Fed’s annual meeting at Jackson Hole. Then we’ll have news on the appointment of a new Fed chairman.
Expect volatility to pick up… as the focus shifts back to the relationship between stock prices and QE.
Your Only Advantage in the Markets
by Bill Bonner – Diary of a Rogue Economist
Whew!
We spent most of last week on airplanes. From Paris to Amsterdam… then to Vancouver… then to Beijing… and finally back to Paris.
The best flight was Air Canada from Vancouver to Beijing. The plane was almost empty. We got on… put the seat back… and went to sleep.
A few times in the night we woke up… opened the window blind… and tried to figure out where we were. There was a red glow off to the right side of the plane, which we took to be the Arctic.
The air hostesses on the plane were all Chinese. Very pleasant and professional.
Remarkably, all the flights were on time.
But then, returning to terra firma, things started to go wrong.
Nobody Knows Anything
We hadn’t much time to keep up with the markets last week. But nothing much happened anyway.
It’s summer. Investors don’t seem to be paying attention. On Friday, US stocks went nowhere. Gold slipped a little.
Analysts and commentators continued to bore and distract us with their explanations. Ultimately, nobody knows anything. Like Socrates, smart investors’ only advantage is knowing they don’t know anything.
A big storm ripped through France on Friday. Electric lines went down. This delayed trains to the southwest.
Then manmade problems took over. We sat on the train from Paris to Poitiers for an hour in the station while the SNCF tried to find a conductor. The one slated for the job had gone home when his shift was over. By the time we finally made it home, it had been a very long day.
Where is home? It is a big, old house in the country, southeast of Poitiers.
Twenty years ago, we decided to globalize our business and our family. We looked for a base in Europe. Mostly by accident, we found this pile nearly a four-hour drive from Paris. South of the Loire, but in a region where few tourists set foot, prices were low and the quality of life – as near as we could determine after only a couple of visits – seemed high.
Looking back, it was a rather impractical move. Whatever business we were to do in Europe, it wouldn’t be out in the French countryside. We would have done better to stay closer to the city. But nearer to Paris seemed less authentic, less “picturesque,” and it was more expensive.
We were amazed by how much house you could get for your money out here. The place cost us about the same thing as a nice beach house in Ocean City, Maryland. But it came with 11 bedrooms and what seemed like acres of roof – some in slate, some in clay tile.
In addition to the house, with its turrets, towers, gables and oeil-de-boeuf windows, there were barns, stables, several farmhouses, workshops, wine caves, garages and other buildings.
We thought all these things were a plus. Later, we learned that they were a big negative; the roofs had to be repaired at great expense. The house was a wreck too – with barely a single functioning bathroom and a kitchen that wouldn’t have been out of place in the Dark Ages.
There was also a large pond and a huge walled garden – an acre of space hidden behind a 10-foot-tall stone wall – which had been abandoned.
In 1995, it was to this setting that our American family arrived – two naïve parents and five baffled children. It has been our home in Europe ever since – serving as a summer house for the last 12 or so years. Now it is summer again, and we have taken up our summer quarters.
Rocking the Boat
We got back Saturday night. On Sunday, Elizabeth rode a bicycle into the village to buy bread and croissants. We had our breakfast outside. Then we took a walk around to inspect the state of things. There were tree limbs down from the storm. One of them had knocked our gypsy wagon on its side. Otherwise, we saw no damage.
We bailed out the rowboat for a little tour of the pond and the orchard on the other side in the walled garden. A goose was trailed by five or six little goslings. A ragondin – a South American relative of the muskrat – slipped out of its hole and escaped under the bridge.
We rowed around the pond, checking on the status of plants and trees. Then we edged the boat up to shore on the walled garden side, near a small stone building where we keep garden tools. Stepping out of the boat, Elizabeth lost her footing and fell in the water.
“I know you find this amusing,” she said, dripping wet, “so go ahead and laugh.”
“No, I don’t find it the least bit amusing. I’m deeply distressed that you think I would.”
“Don’t worry. It would probably be unnatural not to find it funny when someone else falls in the water. Besides, we’re on our summer vacation. We can enjoy ourselves.”
“Then ha-ha!”
A Real Summer House
Americans don’t typically go in for summer houses. They have suburban houses that are comfortable in all seasons and are meant to serve all year round. Prosperous families even have swimming pools behind their houses, giving their homes a holiday atmosphere in warm weather.
But a summer house is different. The idea is not just to decamp to a cooler place in the hot summer months, but also to leave your normal, workaday life behind. An ideal summer house has no TV. And no Internet. Maybe not even a telephone. It is a place to escape the news and let your mind and body recover.
We have friends in Scotland who have a summer house in the Shetland Islands.
“It’s paradise there, of a sort,” they report. “We’re on our own. We fish. The kids play in the tidal pools and turn purple because it is so cold. We go out in the boat and check on the sheep on a nearby island. We have a radio and a telephone, but nothing else.”
Here in France, people tend to head to the South:
“While you were away I visited friends down near Nimes,” Elizabeth reported.
“They have an old family house out in the country. It is what they call a mas. Very simple. With thick stone walls. A square building. The sun is hot down there. So they keep the shutters closed most of the time.
“But it was very restful. It is just a summer house. They use it only once a year. The rest of the year the furniture is covered with sheets. But the whole family goes there in July and August. They take off the sheets and open the shutters to air the place out. They come with a pile of books to read. They see their old family friends. They eat well. And that’s about it.”
The charm of a summer house is that you do not do there what you do in your regular house. You do not rush from one thing to another. You do not go shopping – except for food. You do not try to stay “in the loop.”
You do not try to catch up on your office work. You do not eat fast food. You do not drive fast cars. No. A summer house is a different thing. It is for slowing down… reading… thinking… wandering… wondering… talking.
But there is work to do too. Each year, we paint shutters. Or redecorate a room. Or repair a stone wall.
This year, we have to fix our gypsy wagon. Remarkably, the glass in the windows wasn’t cracked. But much of the trim on one side was broken. We got the wagon back upright with the help of our neighbor’s tractor. Now we have to put the trim back on.
But what’s the hurry?
Regards,
![]()
Bill

DOW – 37 on 1200 net declines
NASDAQ COMP – 14 on 850 net declines
SHORT TERM TREND Bearish (change)
INTERMEDIATE TERM TREND Bearish
STOCKS: There was most likely some worry about the news this was week which is going to be heavy. We get 2nd quarter GDP, FOMC minutes and non farm payrolls so we had a light volume day with a downside bias in spite of strength in Europe.
GOLD: Gold inched up again, this time up $7.
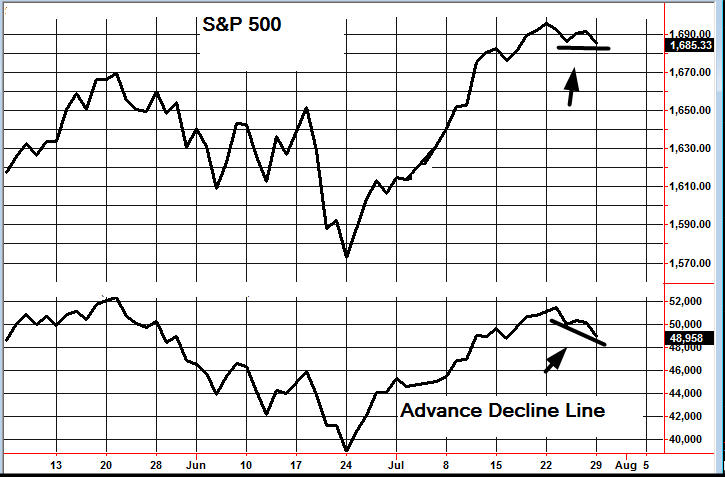
CHART: For months we were bullish because of strong internals. Well, now the internals have weakened. The S&P 500 made a marginal low below a previous low while the advance decline line made a more substantial declining bottoms pattern (arrow).
TORONTO EXCHANGE: Toronto rose 21.
S&P\TSX Venture Comp: The Venture Comp was lower by 1.
BONDS: Bonds were lower on Monday.
THE REST: The dollar stabilized. Silver, copper and crude were all marginally lower.
BOTTOM LINE:
Our intermediate term systems are on a sell signal as of June 4, 2013.
System 2 traders Are in cash. Stay there on Tuesday.
System 7 traders Are in cash. Stay there on Tuesday.
Stock investors We are long Intel from 21.61 with a stop at 22.50.
NEWS AND FUNDAMENTALS:
Pending home sales dropped 0.4%, but not as bad as the expected drop of 1.4%. The Dallas Fed. Mfg. Survey came in at 4.4, less than the expected 6.4. On Tuesday we get the Case Shiller home price index and consumer confidence.
————————————————————————————————————
We’re on a buy for bonds as of July 11.
We’re on a sell for the dollar and a buy for the euro as of July 10.
We’re on a buy for gold as of July 11.
We’re on a buy for silver as of July 11.
We’re on a sell for crude oil as of July 26.
We’re on a buy for copper as of July 1.
We’re on a buy for the Toronto Stock exchange TSX as of July 11.
We are on a sell for the S&P\TSX Venture Comp. as of Jan. 29.
We are long term bullish for all major world markets, including those of the U.S., Britain, Canada, Germany, France and Japan.
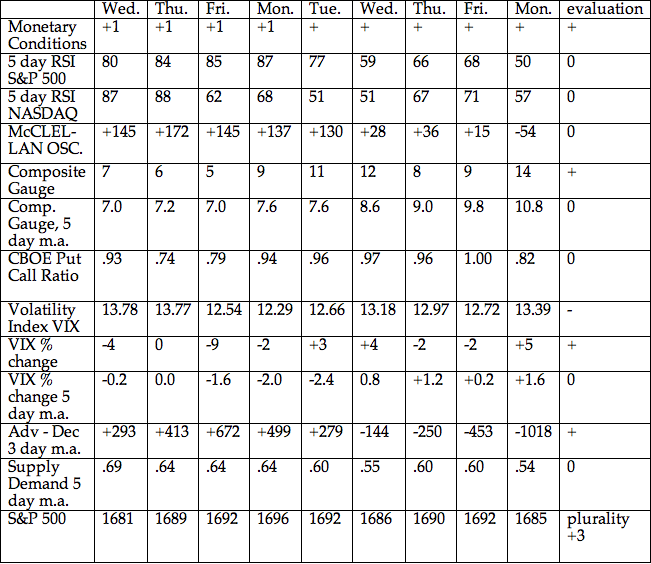
INDICATOR PARAMETERS
Monetary conditions (+2 means the Fed is actively dropping rates; +1 means a bias toward easing. 0 means neutral, -1 means a bias toward tightening, -2 means actively raising rates). RSI (30 or below is oversold, 80 or above is overbought). McClellan Oscillator ( minus 100 is oversold. Plus 100 is overbought). Composite Gauge (5 or below is negative, 13 or above is positive). Composite Gauge five day m.a. (8.0 or below is overbought. 13.0 or above is oversold). CBOE Put Call Ratio ( Below .80 is a negative. Above 1.00 is a positive). Volatility Index, VIX (low teens bearish, high twenties bullish), VIX % single day change. + 5 or greater bullish. -5 or less, bearish. VIX % change 5 day m.a. +3.0 or above bullish, -3.0 or below, bearish. Advances minus declines three day m.a.( +500 is bearish. – 500 is bullish). Supply Demand 5 day m.a. (.45 or below is a positive. .80 or above is a negative).
No guarantees are made. Traders can and do lose money. The publisher may take positions in recommended securities.
DJ Ind 15521.97 -36.86
Nasdaq 3599.14 -14.03
TSX 12669.04 +21.14
TSX-V 924.69 -0.60
TSX-Gold 186.69 -1.46
London Au 1329.75 -1.25
$Cad/Usd 0.974 +0.001

Ahead of a week full of data and central banks, it is likely unsurprising that volumes were dismal and protection/hedging was sought. Once again we saw dips bought with a rush to get markets green (after the collapse in Asia overnight weighed very modestly on Europe and US markets) but once a few people realized the impact of the Treasury’s latest refunding data (must read) stocks did sell off into the close.
…..read more HERE
Equity markets have just completed a traditional period of strength from the last week in June to the third week in July. Since the low on June 24th, gains have been extraordinary. The S&P 500 Index gained 8.44%, the Dow Jones Industrial Average improved 6.82% and the TSX Composite Index advanced 5.76%. It’s time to take trading profits in equity index based investments.
Selected sectors with traditional positive seasonality are the exceptions. Gold, gold equities, biotech and utilities are bucking the trend by moving higher as well as outperforming equity indices.
May Case-Shiller 20 City Home Price Index to be released at 9:00 AM EDT on Tuesday is expected to decline to on a year-over-year basis to 12.4% from12.7%
July Consumer Confidence Index to be released at 10:00 AM EDT on Tuesday is expected to increase to 81.6 from 81.4 in June
July ADP Private Employment to be released at 8:15 AM EDT on Wednesday is expected to drop to 180,000 from 188,000
Preliminary U.S. Second Quarter Annualized Real GDP to be released at 8:30 AM EDT on Wednesday is expected to fall to 1.1% from 1.8% in the first quarter
Canadian May Real GDP to be released at 8:30 AM EDT on Wednesday are expected to increase 0.3% versus a gain of 0.1% in April.
July Chicago PMI to be released at 9:45 AM EDT on Wednesday is expected to slip to 51.5 from 51.6 in June
FOMC decision on interest rates to be released at 2:00 PM EDT on Wednesday is expected to maintain the Fed Fund Rate at 0%-0.25% as well as continue monthly $85 billion purchases of Treasuries and Mortgage Backed Securities
Weekly Initial Jobless Claims to be released at 8:30 AM EDT on Thursday are expected to increase to 345,000 from 343,000 last week.
July ISM to be released at 10:00 AM EDT on Thursday is expected to improve to 51.5 from 50.9 in June
June Construction Spending to be released at 10:00 AM EDT on Thursday is expected to increase 0.2% versus a gain of 0.5% in May.
July Non-farm Payrolls to be released at 8:30 AM EDT on Friday are expected to slip to 184,000 from 195,000 in June. July Private Non-farm Payrolls are expected to ease to 192,000 from 202,000 in June. The July Unemployment Rate is expected to ease to 7.5% from 7.6% in June. July Hourly Earnings are expected to increase 0.2% versus a gain of 0.4% in June.
June Personal Income to be released at 8:30 AM EDT on Friday is expected to increase 0.4% versus a gain of 0.5% in May. June Personal Spending is expected to increase 0.5% versus a gain of 0.3% in May.
June Factory Orders to be released at 10:00 AM EDT on Friday are expected to increase 1.4% versus a gain of 2.1% in May. .
Equity Trends
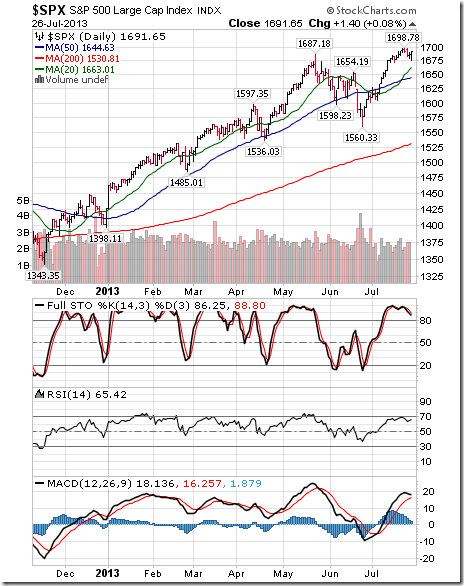
The S&P 500 Index was unchanged last week. Trend remains up. The Index remains above its 20, 50 and 200 day moving averages. Short term momentum indicators are overbought and showing early signs of rolling over.
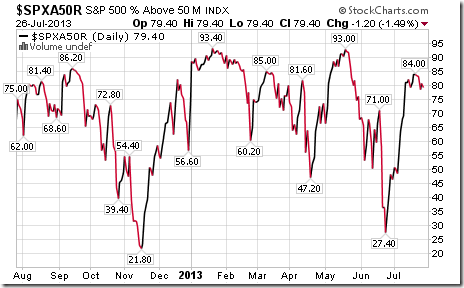
Percent of S&P 500 stocks trading above their 50 day moving average fell last week to 79.40% from 84.00%. Percent is intermediate overbought and showing signs of peaking.
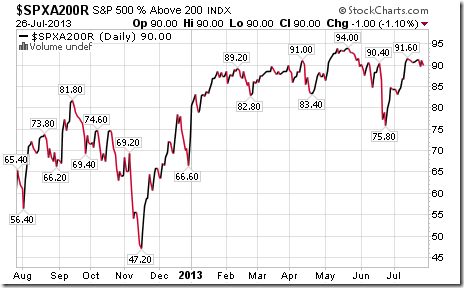
Percent of S&P 500 stocks trading above their 200 day moving average slipped to 90.00% from 90.80%. Percent remains intermediate overbought and showing signs of peaking.
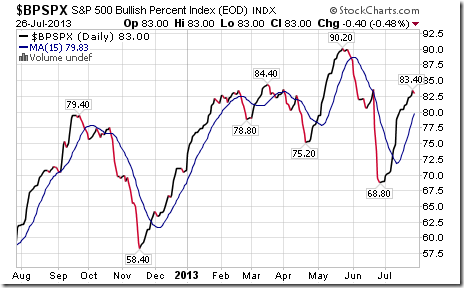
Bullish Percent Index for S&P 500 stocks increased last week to 83.00% from 81.2% and remained above its 15 day moving average. The Index remains intermediate overbought.
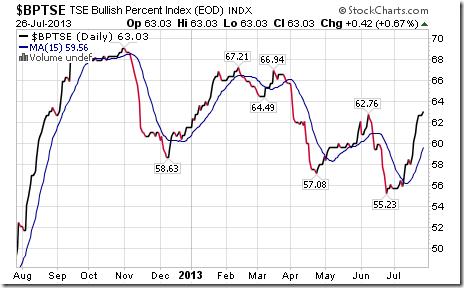
Bullish Percent Index for TSX Composite stocks increased last week to 63.03% from 60.92% and remained above its 15 day moving average. The Index remains intermediate overbought.
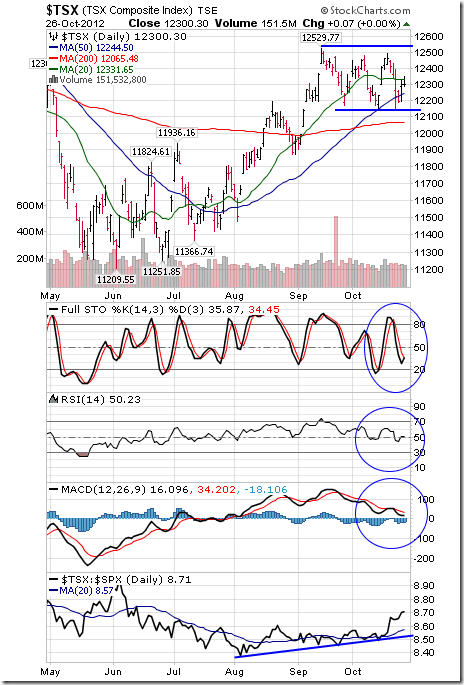
The TSX Composite Index fell 37.23 points (0.29%) last week. Trend remains down. The Index remains above its 20, 50 and 200 day moving averages. Strength relative to the S&P 500 Index remains neutral. Technical score based on the above technical indicators remains at 1.5 out of 3.0. Short term momentum indicators show early signs of rolling over from intermediate overbought levels.
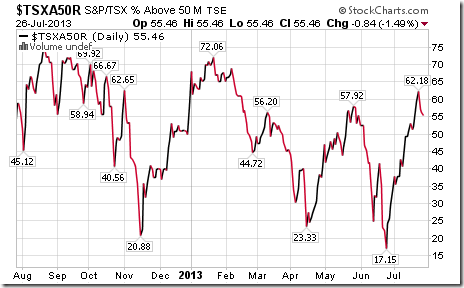
Percent of TSX Composite stocks trading above their 50 day moving average slipped last week to 55.45% from 57.14%. Percent is intermediate overbought.
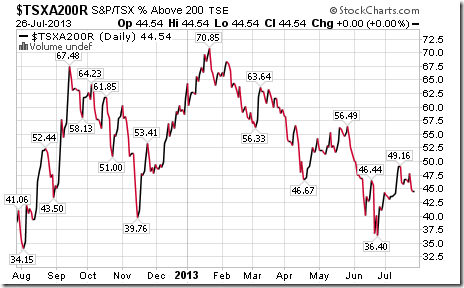
Percent of TSX Composite stocks trading above their 200 day moving average fell last week to 44.54% from 46.64%.Intermediate trend remains down.
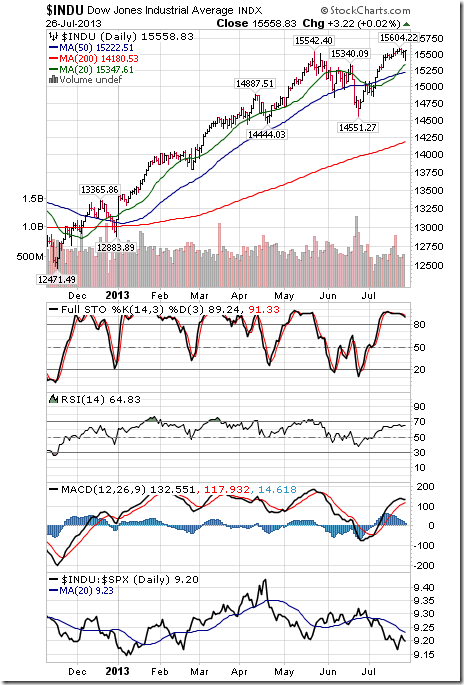
The Dow Jones Industrial Average added 15.09 points (0.10%) last week. Trend remains up. The Average remains above its 20, 50 and 200 day moving averages. Strength relative to the S&P 500 Index remains negative. Technical score remains at 2.0 out of 3.0. Short term momentum indicators are overbought
…..view Nasdaq, Russell, Nikkei and 40 more charts and commentary HERE

-
I know Mike is a very solid investor and respect his opinions very much. So if he says pay attention to this or that - I will.
~ Dale G.
-
I've started managing my own investments so view Michael's site as a one-stop shop from which to get information and perspectives.
~ Dave E.
-
Michael offers easy reading, honest, common sense information that anyone can use in a practical manner.
~ der_al.
-
A sane voice in a scrambled investment world.
~ Ed R.
Inside Edge Pro Contributors

Greg Weldon

Josef Schachter

Tyler Bollhorn

Ryan Irvine

Paul Beattie

Martin Straith

Patrick Ceresna

Mark Leibovit

James Thorne

Victor Adair