
Equity markets have just completed a traditional period of strength from the last week in June to the third week in July. Since the low on June 24th, gains have been extraordinary. The S&P 500 Index gained 8.44%, the Dow Jones Industrial Average improved 6.82% and the TSX Composite Index advanced 5.76%. It’s time to take trading profits in equity index based investments.
Selected sectors with traditional positive seasonality are the exceptions. Gold, gold equities, biotech and utilities are bucking the trend by moving higher as well as outperforming equity indices.
May Case-Shiller 20 City Home Price Index to be released at 9:00 AM EDT on Tuesday is expected to decline to on a year-over-year basis to 12.4% from12.7%
July Consumer Confidence Index to be released at 10:00 AM EDT on Tuesday is expected to increase to 81.6 from 81.4 in June
July ADP Private Employment to be released at 8:15 AM EDT on Wednesday is expected to drop to 180,000 from 188,000
Preliminary U.S. Second Quarter Annualized Real GDP to be released at 8:30 AM EDT on Wednesday is expected to fall to 1.1% from 1.8% in the first quarter
Canadian May Real GDP to be released at 8:30 AM EDT on Wednesday are expected to increase 0.3% versus a gain of 0.1% in April.
July Chicago PMI to be released at 9:45 AM EDT on Wednesday is expected to slip to 51.5 from 51.6 in June
FOMC decision on interest rates to be released at 2:00 PM EDT on Wednesday is expected to maintain the Fed Fund Rate at 0%-0.25% as well as continue monthly $85 billion purchases of Treasuries and Mortgage Backed Securities
Weekly Initial Jobless Claims to be released at 8:30 AM EDT on Thursday are expected to increase to 345,000 from 343,000 last week.
July ISM to be released at 10:00 AM EDT on Thursday is expected to improve to 51.5 from 50.9 in June
June Construction Spending to be released at 10:00 AM EDT on Thursday is expected to increase 0.2% versus a gain of 0.5% in May.
July Non-farm Payrolls to be released at 8:30 AM EDT on Friday are expected to slip to 184,000 from 195,000 in June. July Private Non-farm Payrolls are expected to ease to 192,000 from 202,000 in June. The July Unemployment Rate is expected to ease to 7.5% from 7.6% in June. July Hourly Earnings are expected to increase 0.2% versus a gain of 0.4% in June.
June Personal Income to be released at 8:30 AM EDT on Friday is expected to increase 0.4% versus a gain of 0.5% in May. June Personal Spending is expected to increase 0.5% versus a gain of 0.3% in May.
June Factory Orders to be released at 10:00 AM EDT on Friday are expected to increase 1.4% versus a gain of 2.1% in May. .
Equity Trends
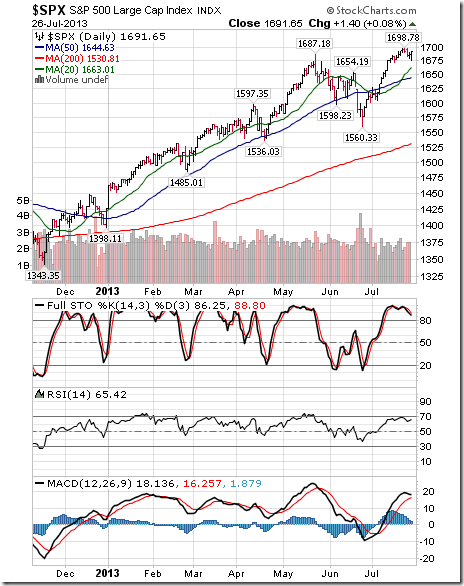
The S&P 500 Index was unchanged last week. Trend remains up. The Index remains above its 20, 50 and 200 day moving averages. Short term momentum indicators are overbought and showing early signs of rolling over.

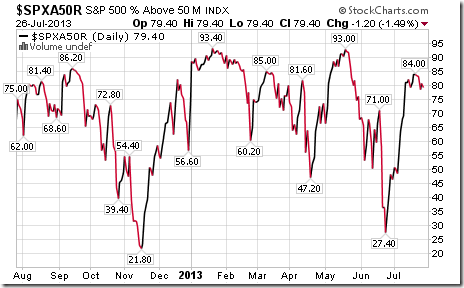
Percent of S&P 500 stocks trading above their 50 day moving average fell last week to 79.40% from 84.00%. Percent is intermediate overbought and showing signs of peaking.
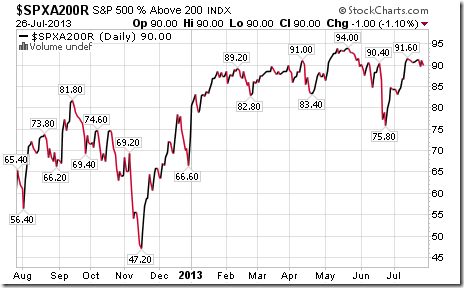
Percent of S&P 500 stocks trading above their 200 day moving average slipped to 90.00% from 90.80%. Percent remains intermediate overbought and showing signs of peaking.
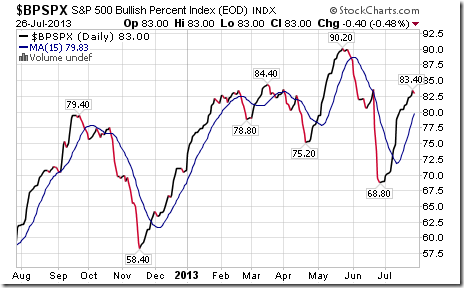
Bullish Percent Index for S&P 500 stocks increased last week to 83.00% from 81.2% and remained above its 15 day moving average. The Index remains intermediate overbought.
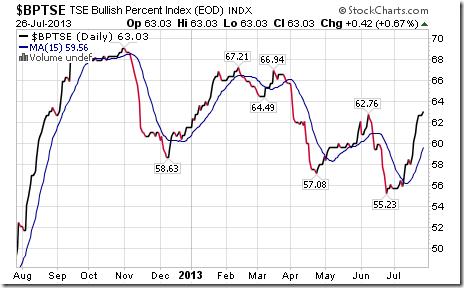
Bullish Percent Index for TSX Composite stocks increased last week to 63.03% from 60.92% and remained above its 15 day moving average. The Index remains intermediate overbought.
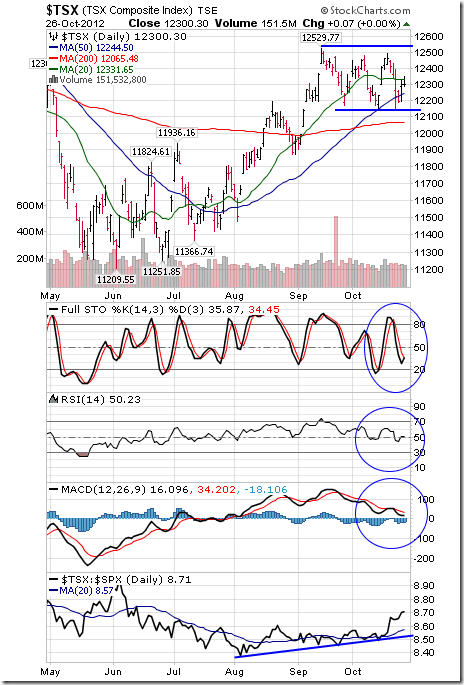
The TSX Composite Index fell 37.23 points (0.29%) last week. Trend remains down. The Index remains above its 20, 50 and 200 day moving averages. Strength relative to the S&P 500 Index remains neutral. Technical score based on the above technical indicators remains at 1.5 out of 3.0. Short term momentum indicators show early signs of rolling over from intermediate overbought levels.
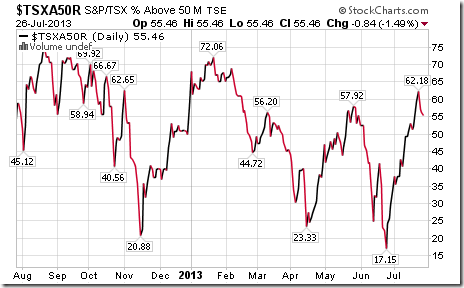
Percent of TSX Composite stocks trading above their 50 day moving average slipped last week to 55.45% from 57.14%. Percent is intermediate overbought.
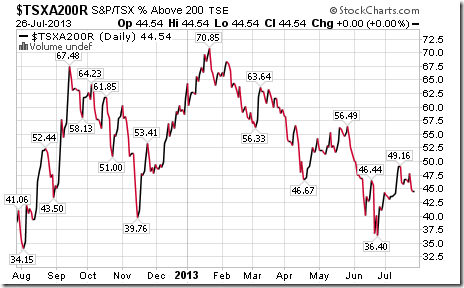
Percent of TSX Composite stocks trading above their 200 day moving average fell last week to 44.54% from 46.64%.Intermediate trend remains down.
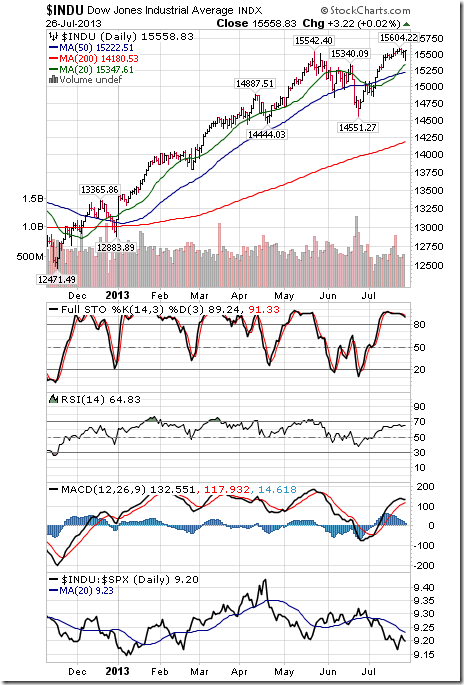
The Dow Jones Industrial Average added 15.09 points (0.10%) last week. Trend remains up. The Average remains above its 20, 50 and 200 day moving averages. Strength relative to the S&P 500 Index remains negative. Technical score remains at 2.0 out of 3.0. Short term momentum indicators are overbought
…..view Nasdaq, Russell, Nikkei and 40 more charts and commentary HERE


