
Personal Finance
 Has Our Government Become Dysfunctional?
This a.m. we comment on president Obama’s state of the union message from last evening. Perhaps the most obvious impact of the speech was the potential for further intrusion of government into our lives and the pledge that that intrusion would cost “not one dime.”
Any reasonable person will know that pledge cannot easily be fulfilled.
The top five elements of the speech according to this morning’s Wall Street Journal were:
- A Strong push for gun control.
- A call for smarter government that sets priorities.
- A climate change initiative he said he will do on his own if Congress doesn’t do it.
- A nonpartisan commission to improve the voting process.
- The President called on Congress to avoid to sequester said the devil is in the details and then failed to provide any (details) thus failing to advance the debate.
Completion of these five elements is highly suspect. Gun control, as proposed by Sen. Feinstein, cannot pass. Second, it is unlikely that the government bureaucracy is smarter than the individual nor can it increase its level of “intelligence” easily due to political dynamics. Third, there is significant evidence that climate change is not caused by humans and therefore cannot be changed by humans. Change to the voting process will be a strawman issue and difficult to achieve. And finally it’s beginning to appear likely that we shall have a Sequester as proposed over a year ago and extended in the recent fiscal cliff compromise.
Very clearly the president thinks he can roll the Republican House and he is indeed on a roll. To date he has had the upper hand in this regard.
Most important it is difficult to see how these top five issues can be accomplished in a “not one dime” fiscal scenario. We all know taxes must increase, but if these top five priorities are to be attained, government spending must increase. Thus far president Obama has proven very adept at assembling a power.
The assault on our lifestyle is well underway in Washington D.C. It is evident everywhere in every administration policy. It is evident to everyone. It is also evident that the Republican Party is badly split and may be unable to arrest the intrusion. While the president’s focus was on the middle class he continued to refer to “billionaires and high-powered accountants” again demonizing those in the country, many of whom have taken risks and created great wealth for hundreds of thousands of people.
This is a president that is expert in polarization of the electorate. He believes in assembling power by broadening the entitlement economy through wealth transfers. He also is convinced that government is smarter than the individual; that individual freedom must be constrained and be subservient to government fiat.
For example, last evening the president called for higher minimum wages ($9.00 an hour up from $7.25 a 24% increase) a sop to immigrants designed likely to accumulate their votes. Increased minimum wages will impact service industries and also, to a large extent, small businesses owners. So the assault is not just on ALL taxpayers. The assault is yet to be felt on business also in small business is critically important to the U.S. economy.
As we write this a.m., we admonish our readers to realize that revenues, known as taxes, must increase significantly. They must increase across the board. We do not doubt that. However taxing the rich only will not produce enough revenue to deal with the current deficit. So we shall all bear the economic problems (slower economic growth, stagnant real income, frustratingly high unemployment) arising from higher taxation. In itself this is a major issue fomenting austerity, what Bill Gross of PIMCO calls the “New Normal” American lifestyle.
The U.S. economy is driven 70% by the consumer. It has morphed into that framework over the past 60 years, since 1952. American consumerism is a well-entrenched culture that has driven growth in the U.S. and the world. China relies on the U.S. consumer. Because the country that controls the Reserve Currency may borrow at will the U.S. government has continued to borrow to sustain the American lifestyle. The U.S. has continued to run increasingly large annual deficits to the extent that now our children and grandchildren are saddled with a huge debt that likely can never be repaid.
Last evening I was interviewed by The Gold Report. One of the many questions related to the moribund natural resource market. I told the interviewer my views. I believe that we are on a downward slope in terms of our quality of lifestyle. In truth this is necessary and unavoidable. It has impacted investment dramatically.
The programs emanating from this administration, the Congress, the inability of the Republican Party to mobilize and define itself appropriately and the apparent felicity of an electorate willing to believe in every gift they are to receive from a “lame duck” President indicate that a vast wealth transfer is underway and that the endgame must be a reorganization of the economy to accommodate our grandchildren’s unsolvable debt problem.
This view may seem extreme. But you must look at the facts and decide for yourselves. No government or central bank can electronically create $85 billion a month to support paper markets. In other words, you cannot support paper debts by printing paper. Interest rates must increase at some point in the future, perhaps the near future. At that time the Federal Reserve and the Treasury will no longer be able to control interest rates at zero.
This scenario will unfold, deflation a central banker’s real fear, notwithstanding. No one yet knows the outcome. Gary Shilling believes that deflation is inevitable and must last for years as it has in Japan. Others, such as Mr. James Sinclair, believe we must see hyperinflation in our economy as soon as this year. There is no reason we cannot see both in succession. History tells us it is happened in the past. In any case the American citizen, perhaps the citizen of the world, must realize a declining lifestyle.
For example, last evening the untouchable “Third Rails” were hardly mentioned. Very clearly there are serious sustainability problems with Social Security, Medicare and Medicaid. Very clearly, mom-and-pop now to must consider postponing retirement. Obviously such considerations add to the unemployed, unemployable and under employed strata of our society. 43 million people (13%) now rely on food stamps in the United States of America and yet the Administration tells us we are not spending enough on food stamps.
In the past four years the President has pandered to the student population (the young voting population) now a $1 trillion problem of bad student loans beginning, in size, to challenge the housing problems of 2008 at 2009.
Meanwhile the emerging world is awakening from hundreds of years of poverty and economic malaise. Digital technology has served as a “Professor to the World.” The rapid distribution of cell phone technology, iPads and iPods has created an awareness of the potential increase in quality of life that is possible and highly desired. This is no longer the Third World but now the Emerging and Powerful World. It is the emerging world, largely free of the debt accumulated in the West that will, in the next two decades, lead global economic growth.
Emerging world infrastructure buildout will swamp the size of the infrastructure creation in the United States between 1950 and 2000. All sorts of commodities and hard assets will be required in quantity. Food, fertilizer, potable water, lifestyle metals such as graphite, and monetary metals will be in demand.
These have not yet been discovered.
Because they will be in short supply many will become good discovery investments. You must discuss your investment plans with your financial planner. 0% interest rates creating financial repression for your portfolio must be countered. You should consider an allocation to hard assets and in my case Discovery Investing.
Discovery investing it is risky and not for the faint of heart. However it is a socially responsible investing discipline as we have defined it using our 10 factors to analyze companies. Great discoveries create jobs and increase lifestyle through education and infrastructure for individuals.
Last evening in The Gold Report interview I reviewed a number of discovery companies mostly from Nevada a mining friendly state in a relatively mining friendly jurisdiction that I am considering at this time. They include International Enexco (see Monday’s Morning Note), Pershing Gold, Valor Gold, Almaden, Terraco Gold, NuLegacy Gold, Quaterra’s Yerington copper district, Corvus Gold, Geologix, Grande Portage is Herbert Glacier project, Quaterra’s Nieves project in Mexico and Gold Standard Ventures.
Chris and I are performing due diligence on all these names and more so these are not yet recommendations on the weekend positive Pershing Gold, Terraco Gold and Quaterra’s Yerington recently. We own shares in Pershing Quaterra, Terraco currently.
Please consider some allocation to gold and silver as we believe these prices must increase due to the current mercantilism of fiat currencies in the world. Your allocation may be to the metal itself to ETF’s or to discovery stocks. Please consider lifestyle discovery investments. The food space fertilizer space water spaces present some very attractive investment opportunities at this time.
And so we move forward with tepidity into a new economic era. It will be the era of our grandchildren and their generations. Our investment strategies today must keep pace and adjust to this rapidly changing and new economic environment.
The material herein is for informational purposes only and is not intended to and does not constitute the rendering of investment advice or the solicitation of an offer to buy securities. The foregoing discussion contains forward-looking statements within the meaning of the Private Securities Litigation Reform Act of 1995 (The Act). In particular when used in the preceding discussion the words “plan,” confident that, believe, scheduled, expect, or intend to, and similar conditional expressions are intended to identify forward-looking statements subject to the safe harbor created by the ACT. Such statements are subject to certain risks and uncertainties and actual results could differ materially from those expressed in any of the forward looking statements. Such risks and uncertainties include, but are not limited to future events and financial performance of the company which are inherently uncertain and actual events and / or results may differ materially. In addition we may review investments that are not registered in the U.S. We cannot attest to nor certify the correctness of any information in this note. We own shares in International Enexco Please consult your financial advisor and perform your own due diligence before considering any companies mentioned in this informational bulletin. We own shares International Enexco, Quaterra Resoruces and Terraco Gold

Precious metals mining stocks may not look too encouraging recently – with mostly declines in 2013 and lack of any spectacular rally. But other influential markets suggest that the situation is likely to change in the near future – the underlying metals seem poised to rally, the general stock market is rallying and the dollar is in a long-term downtrend. It is still hard to answer the title question, however, as the above factors do not give any crystal-clear signals. Let us then move on to the technical part of today’s essay to see if the charts can tell us more – we’ll begin with the analysis of the junior gold and silver stocks (charts courtesy by http://stockcharts.com.)
In the Toronto Stock Exchange Venture Index (which is a proxy for the junior miners as so many of them are included in it), the Junior’s sector did not do much this week as sideways trading was seen and price levels are now close to the declining resistance line. No significant breakout has been seen yet, but one is likely once additional strength is seen in the precious metals. This will probably lead to a continuation of the rally, and little else needs to be said. We expect prices to move to the upside here as well.
Let us have a look at gold senior miners now, with GDX ETF serving as a proxy.
In this week’s GDX ETF chart, not much has changed on a medium-term basis. A short-term rally was seen on Thursday but with accompanying low volume levels, it is unclear if this is a bullish sign or not. In the previous similar case when mining stocks were heavily oversold on a short-term basis after a big decline and after a bottom following a huge decline, low volume seen during the rallies which followed was not necessarily bearish. Higher prices continued and a big rally was seen to follow as well. Note that it did not happen immediately – one more move to the previous low was seen – maybe this is what we saw on Monday.
In today’s miners to gold ratio chart, little change was seen, and the ratio is still close to the 2012 low, which is a major support level. It will probably not move below this level as it seems the damage has already been done here, and recent high volume levels confirm it.
Since many of our readers are concerned about the state of gold and silver stocks, we would like to quote two of our subscribers’ questions regarding the precious metals market that were answered (along with many other ones in the last Premium Update). Both of them have to do with technical patterns.
Q: I have ONE major concern. The gigantic Head and Shoulders in the HUI since 2009 with the Right Shoulder now formed and a neckline at about 375-80. If that breaks don’t we see a fast 100-150 on the HUI? Isn’t that a scary chart? I would greatly appreciate an answer on this because I am seriously considering selling a lot of my stocks in gold and silver based on that alone. The CDNX chart looks very scary also.
A: The head of this pattern would be very large compared to the shoulders, meaning that this formation is not very reliable. Also, if we use the 2012 low as the neck level (approximately), then the HUI Index is still considerably above it, so this formation is not in place, at least not yet. Therefore, it doesn’t have bearish implications. The breakdown below the 2012 low (close to the 370 level in the HUI Index) would be a very bearish technical factor, if confirmed. However, we don’t think that such a breakdown is in the cards in the coming weeks.
As far as CDNX (Toronto Stock Exchange Venture Index) is concerned, we don’t view this chart as bearish, as a small rally here will mean a major breakout that will likely result in much bigger rallies.
Let us move on to the second question.
Q: Hello P.R. Doesn’t this seem like a bearish flag: Slow grind higher in miners on low volume after big declines. What should we be looking for if this is actually the bottom?
Should the move up be bigger and on higher volume? I don’t know anything, just wondering. Every time there seems to be a break after a big decline, the decline returns with a vengeance. How is this different?
A: Generally yes, we would like to see a strong rally on strong volume to be more confident that the final bottom is behind us. The price pattern in mining stocks does look like a bearish flag pattern that would result in the continuation of the decline. However, we will not know until the miners break out either above the flag or below it. The key point here is that other markets – gold, silver, platinum – suggest higher prices in our view, and the SP Indicators suggest higher prices as well. The situation in the USD Index is also favorable. As no market moves totally on its own, we take more of them into account, and in this case the results are bullish.
Summing up, the situation in the gold and silver mining stocks is not encouraging for the short term, but taking the long-term valuation into account, as well as the other precious metals markets and related signals, expecting higher mining stocks’ prices still makes sense.
Thank you for reading. Have a great and profitable week!
Przemyslaw Radomski, CFA
Founder, Editor-in-chief
Gold Investment & Trading Website – SunshineProfits.com
* * * * *
Disclaimer
All essays, research and information found above represent analyses and opinions of Przemyslaw Radomski, CFA and Sunshine Profits’ associates only. As such, it may prove wrong and be a subject to change without notice. Opinions and analyses were based on data available to authors of respective essays at the time of writing. Although the information provided above is based on careful research and sources that are believed to be accurate, Przemyslaw Radomski, CFA and his associates do not guarantee the accuracy or thoroughness of the data or information reported. The opinions published above are neither an offer nor a recommendation to purchase or sell any securities. Mr. Radomski is not a Registered Securities Advisor. By reading Przemyslaw Radomski’s, CFA reports you fully agree that he will not be held responsible or liable for any decisions you make regarding any information provided in these reports. Investing, trading and speculation in any financial markets may involve high risk of loss. Przemyslaw Radomski, CFA, Sunshine Profits’ employees and affiliates as well as members of their families may have a short or long position in any securities, including those mentioned in any of the reports or essays, and may make additional purchases and/or sales of those securities without notice.

 Short-Term Market Outlook
Back on November 19th we wrote a piece in our “Portfolio Manager’s Journal” that we felt the market was putting in an important low. Several technical indicators we were following at the time suggested that the post U.S. election sell-off had run it’s course. In particular, the NYSE Summation Index was at levels associated with previous market bottoms so the odds were stacking in favor of a significant rally. In hindsight our call was correct with the market trading higher and recording new recovery highs on Friday February 1st.
The rally has lasted more than two months, gaining almost 13% as measured by the performance of the S&P 500 Index. Now that the rally has unfolded as we anticipated we want to provide an update on the near-term outlook.
This week we are at an important juncture in terms of time and price with the odds now in favor of a short-term market top at current levels. We employ several different techniques in our market analysis, providing us with some interesting observations.
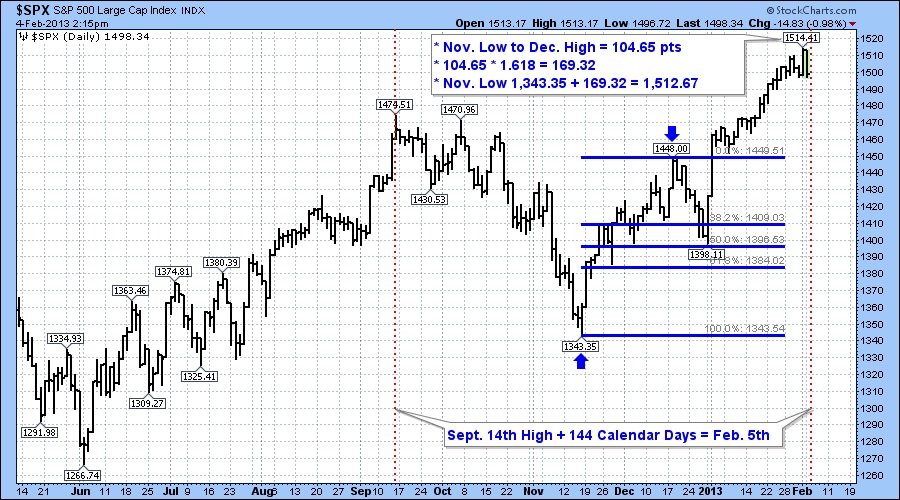
We like to use the Fibonacci number sequence to help us identify support and resistance price levels as well as projecting future time zones where we would be on the lookout for potential trend reversals. If we use the September 14th high and project out 144 calendar days the date for a potential turning point is Tuesday February 5th as indicated by the red dotted vertical dotted line on the chart.
The method for projecting the price target level involves taking the range between the November low and the December high. The range was 104.65 points. Next we multiply this value by the Fibonacci ratio of 1.618 which gives us a value of 169.32. If we then add this value to the November low of 1,343.35 we arrive at a price target of 1,512.67.
On Friday the market recorded an intraday high of 1,514.41 which is less than 2 points above out target!
Therefore with time and price at an important juncture we feel that the current rally is likely over for now and that we should expect a market correction to begin. Some other factors that support a price high is seasonality and sentiment. In post-election years the U.S. market tends to peak in the first week of February and decline into late March. In the past couple of weeks the bullish sentiment numbers indicate above average optimism and the bearish sentiment is also relatively low. From a contrarian perspective we interpret these numbers as another sign of a top.
Our current strategy is to hold off on any more buying until the market declines to an oversold level. We will be reviewing all our individual stock positions to identify stop loss levels in the event that the decline begins to accelerate on the downside.
The next six weeks should be choppy and volatile as those that came late to this rally become nervous and think twice about their recent purchases. We will provide another update when we feel that it’s safe to go back in the water!
Vancouver, Calgary and Toronto Detached Housing Priced in Gold:
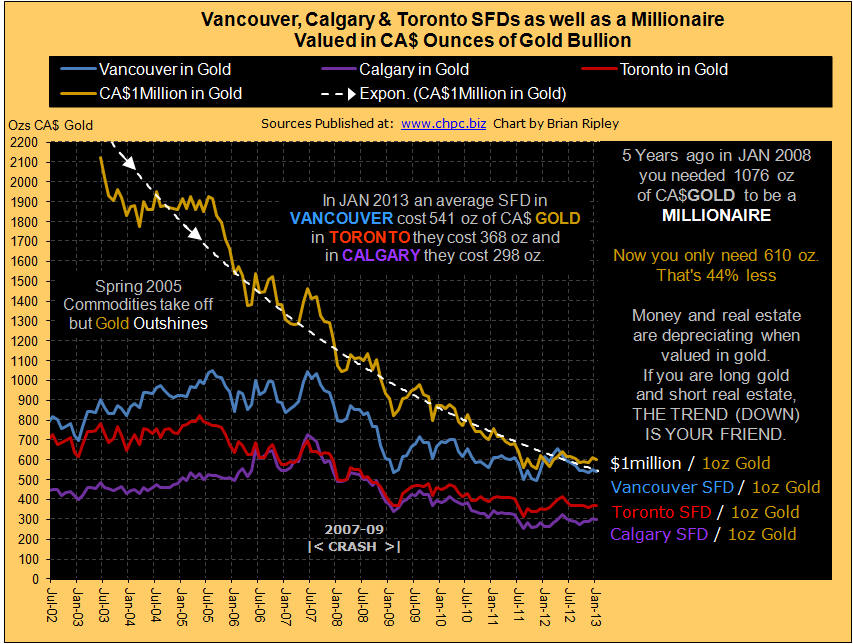
The chart above shows Vancouver, Calgary and Toronto detached housing priced in ounces of gold valued in CA$. Gold mining share prices rise as the “real price” of gold rises eg: the Gold/Commodities Ratio because the commodity cost (fuel, materials, equipment) is falling against the nominal price. See the Homestake Mining Chart from 1924 to 1935. Bullion attracts investment when credit markets contract because of its classic use as a hedge against currency depreciation and its ability to act as money.
The Millionaire Metric allows you to see what your dollar is worth and the (declining) amount of gold you need to be a millionaire. In January 2013 the spot price of gold continued trending in the middle of a channel base that has been established since last summer. It requires 44% less gold now to be a millionaire than 5 years ago. See also the GOLD/CRB ratio here.
Ratios of Gold, Commodities and TSX Real Estate – The Real Price
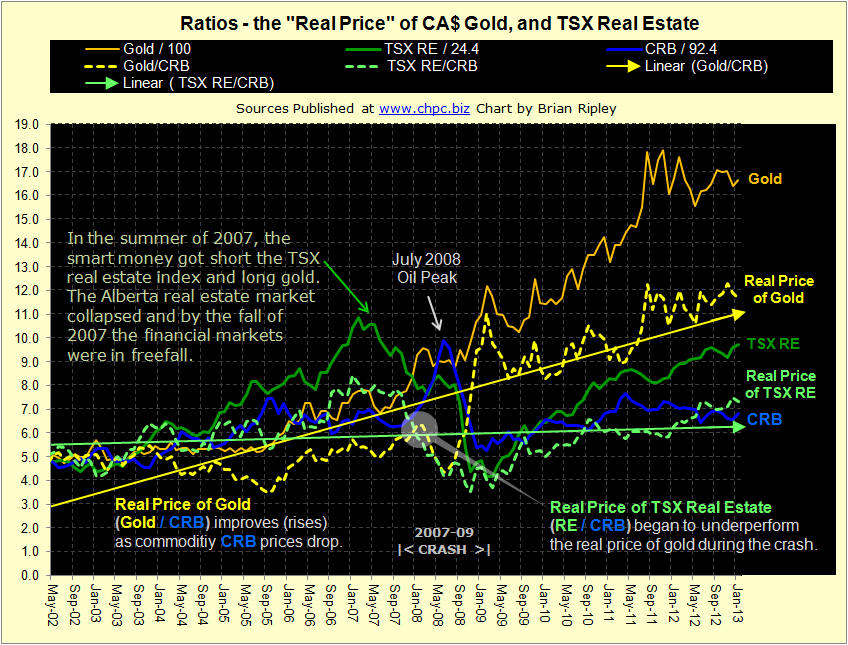
The chart above shows the “Real” price of gold (Gold/CRB) and the real price of real estate (RE/CRB). Gold miner’s profitability depends on the nominal price of gold and the cost of getting the metal out of the ground. When the cost (fuel, and industrial materials) goes down, the real price rises even in the absence of a nominal price rise. Housing is a bundled commodity (lumber, steel, copper, materials, fuel to get to the site) and the TSX-RE/CRB ratio (green dotted line) plunged with the spike in oil prices in 2008 as did the real price of gold (dotted yellow line). But by the end of the 2007-09 crash the real price of gold zoomed with the BoC ZIRP policy and the real price of TSX real estate rallied but on a much more subdued trend; gold has been outperforming since. As of January 2013 gold continues to trade sideways since the summer of 2011 but above its 6 year trend line. The CRB has been drifting down since the secondary April 2011 high and failed retest of the $147/barrel oil spike of July 2008. A falling CRB is excellent for gold miners and ultimately good for long term house buyers as the replacement value for real estate falls with the CRB. The TSX RE Index rally has been offset with an uptick in the CRB which has moved the real price (TSX-RE/CRB) down creating a near by double top test of the 2006-2007 highs. Stay tuned.
….for 10 more Real Estate Charts go HERE
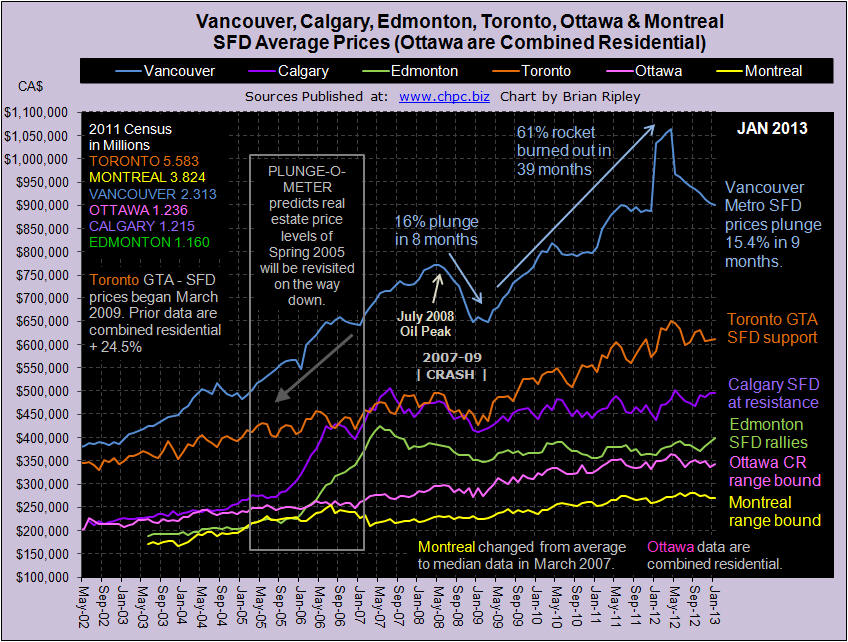
Sales rebounded after the December Bi-Polar festivities were out of the way and inventory gushed back onto the market. Hopefully Realtors persuaded their Vendors to reduce prices on all the re-listings otherwise it’s doubtful that the sales momentum will lift all boats (Momentum Chart).
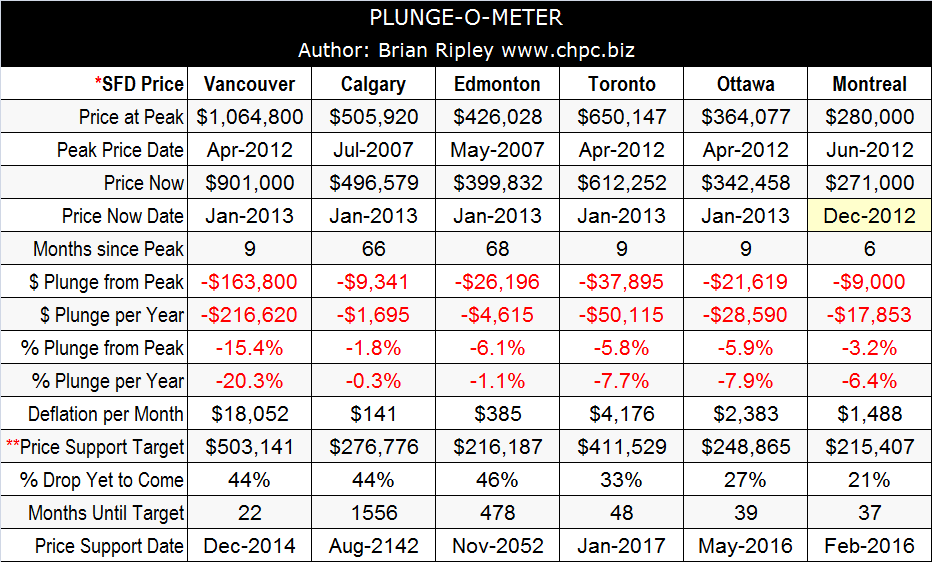
The counter trend rally going on in Alberta is being stoked by thin supply (Scorecard) and fantastic Earnings; and Calgary has almost made it back up to its peak SFD price from 66 months ago (Plunge-O-Meter). Readers on this site who have voted (Sentiment Polling) are saying that 12 months out, Calgary may be able to defend its pricing model from the bears who are clearly sharpening their claws in Toronto and Vancouver. (*Ottawa are combined residential; Montreal are median not average).

-
I know Mike is a very solid investor and respect his opinions very much. So if he says pay attention to this or that - I will.
~ Dale G.
-
I've started managing my own investments so view Michael's site as a one-stop shop from which to get information and perspectives.
~ Dave E.
-
Michael offers easy reading, honest, common sense information that anyone can use in a practical manner.
~ der_al.
-
A sane voice in a scrambled investment world.
~ Ed R.
Inside Edge Pro Contributors

Greg Weldon

Josef Schachter

Tyler Bollhorn

Ryan Irvine

Paul Beattie

Martin Straith

Patrick Ceresna

Mark Leibovit

James Thorne

Victor Adair